A. Elakkiya
et al
, International Journal of Computer Science and Mobile Applications,
Vol.6 Issue. 4, April- 2018, pg. 163-169
ISSN: 2321-8363
UGC Approved Journal
Impact Factor: 5.515
©2018, IJCSMA All Rights Reserved, www.ijcsma.com 163
BIOMETRIC AUTHENTICATION SYSTEM
USING ELMAN NEURAL NETWORKS
A. Elakkiya
1, G. Emayavaramban
2 1Assistant Professor, Kongu college of Arts and science, [email protected]
2
Faculty of Engineering, Karpagam Academy of Higher Education, [email protected]
Abstract: In this paper we investigated the use of brain signature as a possible biometric authentication technique. EEG signals are generated while the subjects perform three various tasks, namely relax, read and spell are acquired from twenty four subjects. We propose an algorithm for recognition of individuals using signal power and backpropagation neural networks.Second methods spell task is more suitable for biometric authentication or verification. The Elman neural network with an average accuracy of 85%- 93%. Twenty four subjects were used in this study. The usage of brain signatures as a possible for biometric verification technique.
Keywords: Biometric authentication, biometric task signals, EEG signal processing, signal power, Neural Network and Brain signature
1.
Introduction
The most and common and widely used the biometrics. The common authentication approaches are those band of personal identification number(PSN). The main objective are biometrics is reliable verification and identification. Biometrics characteristics can be divided into two main classes. Physiological and behavioural characteristics Physiological is related to the human body characteristics, such as DNA, fingerprints eye retinas and irises, voice patterns facial patterns and hand measurements for authentication purposes. Behavioral is related and analyzing to the behavioral of a person (eg: signature.Gait). Electroencephalography(EEG) a a biometric is relatively compared other biometrics previous paper has propose only three task protocol and EEG signal acquired from six subject power spectral density feature and multilayer network are used this paper. The average classification 94.4 to 97.5%[2]. In this paper We are using three task protocol, the EEg signal acquired from twenty four subject. power spectral density using burg algorithm and a simple neural network used to train and test the data. An average classification of 92.4 % was achieved from the single trial analysis. Power spectral modal used in the present study and have been used in other EEG biometrics authentication and identification as well. In this paper a new algorithm for signal acquisition is proposed and EEG biograph dataset from 24 subjects are used in the experimentation to validate the algorithms proposed..EEG signal are classified using three mental tasks namely read, relax, and spell. Each task should be repeated for 10 sec for 20 trials.
2.
Methodology
A) EEG biographs
A. Elakkiya
et al
, International Journal of Computer Science and Mobile Applications,
Vol.6 Issue. 4, April- 2018, pg. 163-169
ISSN: 2321-8363
UGC Approved Journal
Impact Factor: 5.515
©2018, IJCSMA All Rights Reserved, www.ijcsma.com 164
the processed signal is recorded from. Here we classified the fundamental barriers in biometrics into four main categories: (i) accuracy, (ii)
measure
, (iii) security, and (iv) privacy [1][17][18].B) Data collection
EEG signals are acquired from three non invasive electrodes. The electrodes are gold plated cup shape placed on the scalp. The subjects were seated conveniently in a noise free room. The subjects should perform the task mentally without any movements. The subjects are requested to perform three mental tasks and data from all the two electrodes F4 and O2 were reordered for 10s during a given task and each task was repeated five times per session. The total of 24 subject with a varied no of trials per subject ranging from 20 trials for a total of 60 trials. Data was collected form college student for two sessions on different days. The sampling ratio is 200 Hz. Each task to classified as follows
Figure1 : EEG signals for the three tasks (a) (b) channel1 for subject 2
Figure2: Electrode placement locations for data acquisition
1 (a) Read 1 (b) Read
2 (a) Relax
2 (b) Relax
3 (a) Spell
A. Elakkiya
et al
, International Journal of Computer Science and Mobile Applications,
Vol.6 Issue. 4, April- 2018, pg. 163-169
ISSN: 2321-8363
UGC Approved Journal
Impact Factor: 5.515
©2018, IJCSMA All Rights Reserved, www.ijcsma.com 165
Task1- Reading: The subject is shown a typed card with tongue twister sentences and they were requested to read the sentence mentally without vocalizing.
Task 2- Relax: No mental task is performed, subjects were asked to relax and try to think of nothing in particular. This task is used as a baseline measure of the EEG.
Task3- Spelling: The subject is shown a typed card with his name and is requested to spell his name mentally without vocalization and overt movements. EEG signals were collected from 24 subject all of them volunteers and college student. The 24 subject age group between 15 to 25 years. This subject do not smoke and diet. The subject were healthy add free from any medication. The signals are recorded from two sessions and each session take a 20 trials.2000 samples are collected from each subject.
C) Feature Extraction
The raw EEG biographs are band pass filtered using twelve frequency bands from the alpha and beta rhythms of 7 Hz to 42 Hz with a bandwidth of 3 Hz. The signal power of each band is extracted and a logarithmic transform is performed on the extracted features.No signal artifacts were displacingd in this experiment.129 features were extracted for each trial per subject per task. Each task is repeated ten times. 480 data samples for 24 subjects were obtained to train and test the neural network.
D) Power Spectral Density
PSD analysis provides the basic information about how power is distributed as a function of frequency. Spectral estimation techniques can be defined are non parametric methods, parametric methods and high-resolution methods.
A) Parametric Methods
The parametric spectrum estimation is based on assumption and a model of the data with prior knowledge. The frequency response of the model gives the estimate of power spectral density [14]. Covariance, modified covariance, burg, Yule-Walke methods based on parametric methods.
a. Covariance Method
(1)
The power spectral density using the covariance method gives the distribution of the power per unit frequency and the pre order of AR model.
b. Burg Method
Burg technique performs the minimization of the forward and backward prediction errors and estimates the reflection coefficient. The primary advantages of the Burg method are resolving closely spaced sinusoids in signals with low noise levels, and estimating short data records, in which case the AR power spectral density estimates are very close to the true values. The accuracy of the Burg method is lower for high-order models, long data records, and high signal-to-noise ratios and its high frequency resolution, AR model are always stable and computationally very efficient.
c. Modified Covariance Method
(3)
A. Elakkiya
et al
, International Journal of Computer Science and Mobile Applications,
Vol.6 Issue. 4, April- 2018, pg. 163-169
ISSN: 2321-8363
UGC Approved Journal
Impact Factor: 5.515
©2018, IJCSMA All Rights Reserved, www.ijcsma.com 166
d. Yule–Walker Method
Yule–Walker method the AR parameters are estimated by minimizing an estimate of prediction error power [14].
B) High-resolution methods
High-resolution methods include techniques such as multiple signal classification (MUSIC) and Eigenvector. These methods define a Pseudo-spectrum function with large peaks that are subspace frequency estimates, and they are commonly used in the communication area. Multiple signal classification method based on high-resolution method.
a. Multiple Signal Classification Method
(5)
The MUSIC is a noise subspace frequency estimator. It is used to distinguish the desired zeros from the spurious ones using the mean spectra of entire eigenvectors matching to the noise subspace. From the orthogonality condition of both subspaces, the MUSIC can be obtained using the following frequency estimator [15[19]].
C) Non-parametric methods
Non-parametric methods do not assume a fixed structure of a model. It can expand to accommodate the complexity of data. It is based on fewer assumptions like wide sense stationary hence their applicability is much wider than parametric methods [14]. Welch method is based on the non parametric method.
a. Welch Method
L is the length of the time series. Examining the short data registries with conjoint and non rectangular window reduces the predictive solution .In Welch method is segmented into eight sections of equal length with an overlapping 50% and each segment using a hamming window.
To extract the power spectral density features we used the following methods, namely covariance, burg, modified covariance, Welch, music and Yule walker algorithm.To extract the power spectral density features, we used to burg algorithm for data collection one.129 features were extracted for each trial per subject per task. Each task repeated 20 trials, 1440 for three task and 24 subject obtained test and train the Elman neural network.
D) Elman Neural Network classifier
A. Elakkiya
et al
, International Journal of Computer Science and Mobile Applications,
Vol.6 Issue. 4, April- 2018, pg. 163-169
ISSN: 2321-8363
UGC Approved Journal
Impact Factor: 5.515
©2018, IJCSMA All Rights Reserved, www.ijcsma.com 167
3. Results and Discussion
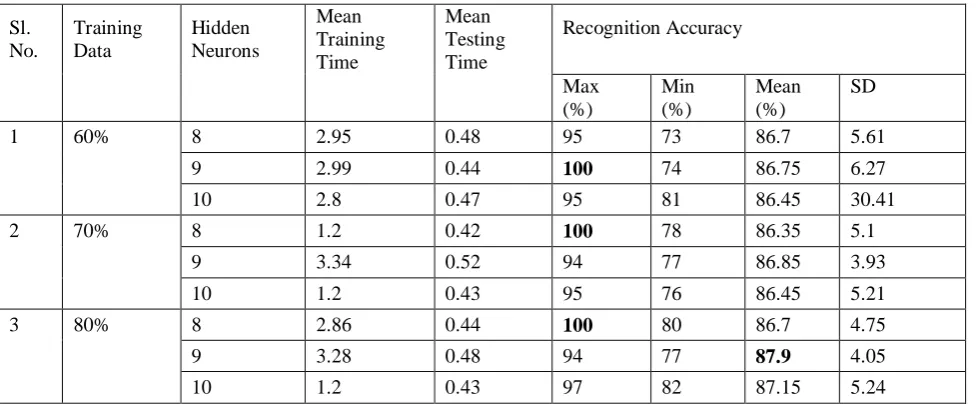
Three network models using the Elman method are developed for the three biometric tasks. The network performance is recorded for twenty trails and the average the performance values are shown Tables 1 different the three biometric tasks namely read, spell and relax. Second Column describes the percentage of training data used in the experiment, while third column describe the hidden layers used. Column four and five while columns six to eight describes the average values of maximum, minimum, mean and standard deviation of the identification and performance of the networks for each task and same content also second table. A mean recognition accuracy of 92.4% was achieved for the spell task Maximum recognition accuracy of 100% with an error tolerance of 0.0001 was observed for spell and relax tasks followed by 95%. Standard deviation of the performance accuracy is observed to be better for the relax task at 1.22. As the relax task is more of a baseline state of the EEG activity of individuals, the most suitable biometric tasks are the spell. Table 2 mean recognition accuracy of 91.7% was achieved for the spell task Maximum recognition accuracy of 100% with an error tolerance of 0.0001 was observed for spell. Standard deviation of the performance accuracy is observed to be better for the relax task at 1.22. As the relax task is more of a baseline state of the EEG activity of individuals, the most suitable biometric tasks are the spell. From the experimental results it is observed that the spell task is more suitable for biometric authentication or verification compared to the relax task. The experimental results of the biographs of twenty four subjects used in this study validate the proposed algorithms. Comparing to the previous method table 3 mean recognition accuracy of 87.9% was achieved for the spell task Maximum recognition accuracy of 100% with an error tolerance of 0.0001. power spectral density using burg method is best performance is achieved for the spell task with a mean accuracy92.4%.
4. Conclusion
Recognition of EEG biographs using Elman networks is proposed in this study. Biographs of twenty four subjects is acquired non invasively using three electrodes. Network models are developed using band power features and one hidden neuron configuration. Experimental results validate the proposed biometric tasks and algorithms. Best performance is achieved for the spell task with a mean accuracy of 92.4% The spell protocol proposed in this study for signal acquisition has improved the recognition performance in comparison with previous method Back propagation network. Future works will involve the single trail analysis of the signals and experiments with dynamic network models.
References
[1] Biometrics: A Grand Challenge Anil K. Jain, Sharath Pankanti, Salil Prabhakar, Lin Hong, Arun Ross, James L. WaymanMichigan State University, IBM T. J. Watson Research Center, DigitalPersona Inc., Siemens Corporate Research,West Virginia University, San Jose State University.
[2] A modality for biometric authentication Author(s): Hema, C.R. Sch. of Mechatron. Eng., Univ. Malaysia Perlis, Arau Paulraj, M.P. ; Kaur, H. Page(s): 1 - 4 Product Type: Conference Publications
[3] AR Spectral Estimation by Application of the Burg Algorithm To Irregularly Sampled Data R. Bos, S. de Waele, P. M. T. Broersen Department of Applied Physics Delft University of Technology
[4] A Modified Burg Algorithm Equivalent InResults to Levinson Algorithm Rami Kanhouche [5] Biometrics’ available online http://en.wikipedia.org/wiki/Biometrics
[6] Hema C.R., Paulraj M.P., Harkirenjit Kaur, Brain Signatures: A Modality for Biometric c Authentication. International Conference on Electronic Design 2008, Penang, pp. 1-4,
[7] Hema, C.R., Adzizul A Osman, Single Trial Analysis on EEG Signatures to Identify Individuals, 6th International Colloquium Signal Processing and it’s Applications, 2010, March 2010, pp. 1-3.
[8] Michal Teplan, “Fundamentals of EEG Measurement”, Measurement Science Review, 2002, Volume 2, Section 2 ,
[9] D.G. Domenick, “International 10-20 Electrode Placement System for Sleep”, 1998.
http://members.aol.com/aduial/1020sys.html
10] S.N.Sivanandam, M.Paulraj, Introduction to Artificial Neural Networks Vikas Publishing House, India. 2003.
A. Elakkiya
et al
, International Journal of Computer Science and Mobile Applications,
Vol.6 Issue. 4, April- 2018, pg. 163-169
ISSN: 2321-8363
UGC Approved Journal
Impact Factor: 5.515
©2018, IJCSMA All Rights Reserved, www.ijcsma.com 168
[12] Michal Teplan, “Fundamentals ofEEG Measurement”, MeasurementScience Review, 2002, Volume 2,Section 2 .[13] Dinesh Chandra Jain Dr. V.P. Pawar, “The Brain Fingerprinting Through Digital Electroencephalography Signal Technique”, International Journal on Computer Science and Engineering, ISSN : 0975-3397 Vol. 3 No. 3 Mar 2011
[14] Akankshya Shradhanjali, Subhra Chowdhury and Neelesh Kumar “ Power Spectral Density Estimation of EMG SignalsUsing Parametric and Non-Parametric Approach” Global Advanced Research Journal of Engineering, Technology and Innovation (ISSN: 2315-5124) Vol. 2(4) pp. 111-117, April, 2013.
[15] Lahcène Noureddine Omar Touhami “Application Of Parametric Psd Methods For Rotor Cage Fault Detection Of Induction Motors” Journal of Electrical Engineering,pg no1-7.
[16] G Emayavaramban, A Amudha, sEMG based Classification of Hand Gestures using Artificial Neural Network, Indian Journal of Science and Technology, Vol 9(35), September 2016.
[17] Paulraj MP Hema C.R ,Elakkiya. A Biometric Identification using Electroencephalography, International Journal of Computer Applications, Volume106,Issue15.
[18] Elakkiya Hema C.RA Biometric Authentication Using Brain Signatures, Journal karpagam journal of computer science, Volume 9 Issue 3.
[19] Hema C.R , Elakkiya. A , Paulraj MP Biometric Identification using Electroencephalography, International Journal of Computer Applications (0975 – 8887) Volume 106 – No. 15, November 2014.
[20] G.Emayavaramban, S.Ramkumar, A.Amudha Classification of Hand Gestures Using FFNN and TDNN Networks , International Journal of Pure and Applied Mathematics, Volume118, Issue 8, Pages 27-32.
[21] A Elakkiya, S Ramkumar, G Emayavaramban, “Performance Evaluation of Mobile Sensor Network” Journal Of Applied Engineering, 2014.
Table 1. Recognition performance results of Elman network for read, relax spell task Method – 80%
Table 2. Recognition performance results of Elman network for read , relax spell task Method -70% Sl. No Training Data Hidden Neurons Mean Training Time Mean Testing Time Recognition Accuracy Max (%) Min (%) Mean (%) SD
1 Read 9 6.046 0.540 95 87 90.4 1.84
2 Relax 9 6.212 0.73 94 89 91.35 1.22
3 Spell 9 5.67 0.59 95 90 92.4 1.56
Sl. No Training Data Hidden Neurons Mean Training Time Mean Testing Time Recognition Accuracy Max (%) Min (%) Mean (%) SD
1 Read 9 5.67 0.53 91 82 82.5 2.62
2 Relax 9 6.21 0.73 94 89 91.35 1.22
A. Elakkiya
et al
, International Journal of Computer Science and Mobile Applications,
Vol.6 Issue. 4, April- 2018, pg. 163-169
ISSN: 2321-8363
UGC Approved Journal
Impact Factor: 5.515
©2018, IJCSMA All Rights Reserved, www.ijcsma.com 169
Table 3. Recognition performance results of Elman network for read , relax spell task Method -60%Table 4 . Recognition Performance Results of Back propagation Network for Spell Task
A Brief Author Biography
Dr. Elakkiya. A is currently working as Assistant Professor in the Department of Computer Applications at Kongu college of Arts and science, Karur. She received her PhD in 2017 from Karpagam academy of higher Education, Coimbatore. She holds the Master of computer Application and Master of Business Administration degree from Bharathiyar University respectively. Elakkiya. A has over 10 publications including various International journals and conference. Her areas of interest include System Software, software Testing, Software Engineering, Neural Networks and Digital and Signal Processing.
Dr. G. Emayavaramban is currently working as Assistant Professor at Karpagam Academy of Higher Education, Coimbatore. He Received BE and ME [EEE] Degree at Anna University. He received him Ph.D in 2017 at Karpagam Academy of Higher Education, Coimbatore. His areas of interest include Neural Networks, Digital Signal Processing and human machine interaction.
Sl. No
Training Data
Hidden Neurons
Mean Training Time
Mean Testing Time
Recognition Accuracy
Max
(%)
Min (%)
Mean (%)
SD
1 Read 8 2.95 0.48 95 73 86.7 5.61
2 Relax 9 2.99 0.44 100 74 86.75 6.27
3 Spell 10 2.8 0.47 95 81 86.45 30.41
Sl. No.
Training Data
Hidden Neurons
Mean Training Time
Mean Testing Time
Recognition Accuracy
Max
(%)
Min (%)
Mean (%)
SD
1 60% 8 2.95 0.48 95 73 86.7 5.61
9 2.99 0.44 100 74 86.75 6.27
10 2.8 0.47 95 81 86.45 30.41
2 70% 8 1.2 0.42 100 78 86.35 5.1
9 3.34 0.52 94 77 86.85 3.93
10 1.2 0.43 95 76 86.45 5.21
3 80% 8 2.86 0.44 100 80 86.7 4.75
9 3.28 0.48 94 77 87.9 4.05