DEMOGRAPHIC RESEARCH
VOLUME 34, ARTICLE 11, PAGES 321−358
PUBLISHED 18 FEBRUARY 2016
http://www.demographic-research.org/Volumes/Vol34/11/ DOI: 10.4054/DemRes.2016.34.11
Research Article
Reliability of retrospective event histories within
the German Generations and Gender Survey:
The role of interviewer and survey design factors
Kerstin Ruckdeschel
Lenore Sauer
Robert Naderi
This publication is part of the Special Collection on “Data Quality Issues in the First Wave of the Generations and Gender Survey,” organized by Guest Editors Aart C. Liefbroer and Joop Hox.
©2016 Kerstin Ruckdeschel, Lenore Sauer & Robert Naderi.
This open-access work is published under the terms of the Creative Commons Attribution NonCommercial License 2.0 Germany, which permits use, reproduction & distribution in any medium for non-commercial purposes, provided the original author(s) and source are given credit.
1 Introduction 322 2 Possible distortions due to survey implementation 323 3 Implementation and distortions in the German GGS 325
3.1 Structure of the GGS questionnaire 325
3.2 Distortions in the retrospective parts of the German GGS 329
4 Hypotheses 331
5 Method 332
6 Results 334
6.1 Causes of distortion on the part of the interviewee 334
6.1.1 Response gap 334
6.1.2 Increase of biased survey responses to screening questions in later sections of the survey
336 6.1.3 Mothers who were never married in older cohorts 337 6.2 Causes of distortion on the part of the interviewer 340 6.2.1 Learning effects of inexperienced interviewers 341 6.2.2 Learning effects of experienced interviewers 343
7 Conclusion and outlook 345
8 Acknowledgements 348
References 349
Reliability of retrospective event histories within the German
Generations and Gender Survey:
The role of interviewer and survey design factors
Kerstin Ruckdeschel1
Lenore Sauer2
Robert Naderi3
Abstract
BACKGROUND
In order to explain demographic phenomena, the Generations and Gender Survey covers a wide variety of demographic topics. Such a survey requires elaborate survey design and implementation. Previous research has shown problems with the complex parts of retrospective fertility data and retrospective partnership data in the German GGS. Until now, no satisfying explanations have been given for these distortions.
OBJECTIVE
In this paper we investigate if the distortions in the German GGS can be explained by questionnaire design factors or by survey implementation, with special regard to rational behaviour of the interviewers and interviewees.
METHODS
Using the fertility and partnership histories in the first wave of the German GGS of 2005, we checked for fatigue and learning effects, resulting in avoidance strategies concerning follow-up questions for respondents as well as for interviewers. Furthermore, we included extensive interviewer controls.
RESULTS
Results suggest that distortions in the German GGS are related to interviewers and interviewees. We found indicators of learning effects of respondents, which lead to a shortening of interviews and to more biased survey responses to screening questions in later sections of the survey. We also found strong hints that interviewers learned how to shorten interviews.
1 Federal Institute for Population Research, Germany. E-Mail: [email protected]. 2 Federal Institute for Population Research, Germany.
CONCLUSIONS
The analysis provides insights into the distortions of the retrospective parts of the German GGS and their causes. On the one hand, researchers may use this information to decide how to deal with the German GGS and especially the information on cohorts 1955 and older. On the other hand, our findings lead to several suggestions concerning the survey design and implementation of future large-scale demographic surveys.
1. Introduction
The Generations and Gender Survey (GGS), which is part of the Generations and Gender Programme (GGP), has been one of the most ambitious projects in Population Studies in the last decade. Its stated goal is to “improve understanding of demographic and social development and of the factors that influence these developments” (UNECE 2005). This requires elaborate survey design and implementation, resulting in a long and complex questionnaire. Previous research has shown that with increasing length and complexity, the probability of distortions in a survey rises. In this paper we focus on the German GGS, in which distortions appear in parts of the questionnaire which are complex, i.e., the retrospective parts on fertility and partnerships. There are various types of distortion: compared to German vital statistics the total number of children in the GGS is too low for birth cohorts 1930–1954 and too high for the cohorts born thereafter. When looking at partnership history we have too many women who were never married in our data in the older cohorts and too many married ones in the younger cohorts (Kreyenfeld et al. 2010; 2011; Kreyenfeld, Hornung, and Kubisch 2013; Sauer, Ruckdeschel, and Naderi 2012; Vergauwen et al. 2015). So far, approaches explaining these distortions have not provided satisfactory results. In this paper we try another approach by investigating if and under which conditions the complexity of the questionnaire could hinder the GGS improving the knowledge of the factors that influence demographic and social development. We investigate if the distortions in the German GGS can be explained by questionnaire design factors, interview situations, or other aspects of the implementation of the survey. In the following we especially assume that length, complexity, and structure of the GGS questionnaire are factors that affect respondents’ as well as interviewers’ behaviour and which offer advantageous conditions for shortening interviews by recording or giving incomplete or wrong answers.
hypotheses are formulated concerning the nature and causes of the distortions in the GGS. Data and methods used as well as the results are presented in the subsequent sections. Finally, the conclusion suggests lessons for future surveys and provides advice for handling data from the German GGS in empirical analyses.
2. Possible distortions due to survey implementation
After discovering and identifying the distortions in the German GGS, different explanations have been posited, but with limited success. Kreyenfeld and her colleagues came to the conclusion that “question wording, question placement and technical problems do not seem to be the major sources of error leading to the bias in the fertility histories” (Kreyenfeld, Hornung, and Kubisch 2013: 20). A paper by Sauer, Ruckdeschel, and Naderi (2012) instead concluded that the complexity of the retrospective histories could be a main source of distortion. In this paper we will elaborate upon this aspect.
Therefore it might be rational behaviour on the part of the interviewees to shorten long and complex interviews. There are several possibilities to achieve this goal – the interviewee could abort the interview, but for some this might seem too confrontational. Other possibilities are generic answers, independent of the actual content of the question, such as always indicating the middle category (Schräpler 2001) or avoiding questions which lead to long follow-up questions. Based on the British General Household Survey, Murphy (2009: 130) found that particularly among older cohorts of women deliberate “under-reporting of childbearing is due to the circumstances of the survey interview, that, for example, some respondents may simply lose interest and report themselves as childless as a non-confrontational way of shortening the interview”.
It is known from panel or longitudinal studies that responses are influenced by previous experience in the same or similar surveys, which can be interpreted as survey or panel conditioning or learning. Conditioning can occur within a single survey as well, if the responses to survey items placed in the later sections of a questionnaire are affected by experience gained from earlier sections (Duan et al. 2007). Screening items followed by subsequent questions, which is typical for retrospective questions, are prone to this kind of conditioning. After learning that answering such questions in a certain way can lengthen the interview, respondents might not answer subsequent screening items correctly in order to avoid follow-up questions (Hart, Rennison, and Gibson 2005; Matschinger, Bernert, and Angermeyer 2005; Duan et al. 2007; Savage and Waldman 2008; Kreuter et al. 2011; Ní Bhrolcháin, Beaujouan, and Murphy 2011). Accordingly, survey responses in the later sections of a long questionnaire may be biased towards underreporting.
people they do not know, 3) organisational factors, such as inadequate remuneration, commitment and training of the interviewers, as well as 4) external factors, such as bad weather or a neighbourhood, in which interviewers do not feel comfortable (Crespi 1945; Stewart and Flowerman 1951; Köhne-Finster and Güllner 2009). These factors may lead to “data fabrication” as an attractive option (Crespi 1945; Schräpler and Wagner 2003). We can distinguish between several forms of data fabrication: 1) an interviewer fabricates all responses for an entire questionnaire, 2) an interviewer asks some questions in an interview and fabricates the responses for the remaining questions, 3) an interviewer deliberately misreports disposition codes and falsifies process data (e.g., the recording of a refusal case as ineligible for the sample), 4) an interviewer deliberately miscodes the answer to a question to avoid follow-up questions, and 5) an interviewer knowingly deviates from prescribed interviewing procedures, such as conducting an interview with someone who is easily accessible and willing to participate in place of the actually intended person (Schreiner, Pennie, and Newbrough 1988; Groves et al. 2009). Procedures 3) through 5) are likely the most frequent, because cheating interviewers try to “keep it simple” (Hood and Bushery 1997: 820). If surveys are intended to collect large amounts of retrospective data, accompanied by screening questions, it is “rational” for interviewers to shorten the interview by avoiding follow-up questions. Very similar effects are known from research on interviewer-related variation in network size (van Tilburg 1998; Marsden 2003; Wolf 2004; Brüderl, Huyer-May, and Schmiedeberg 2013). According to Brüderl and his colleagues (2013: 157), “almost half of the variation in network size in the German Family Panel is not ‘real’ but is due to more or less careful interviewer behaviour.”
3. Implementation and distortions in the German GGS
In order to derive hypotheses from these general considerations that could explain response patterns in the German GGS, we must first describe the questionnaire and its peculiarities (section 3.1), as well as the observed distortions in the retrospective parts of the German GGS in detail (section 3.2).
3.1 Structure of the GGS questionnaire
Additionally, it includes a wide variety of context information from other domains of life, such as economic situation, housing conditions, and social networks. Against the background of these various demographic topics, the GGS provides information on the individual, partnership, and household levels, by integrating both retrospective and prospective approaches (Vikat et al. 2007). In accordance with these goals, the GGS questionnaire covers 11 different topics, namely household composition, information on children,4 on actual and previous partnerships, on household organisation, on parents and the parental home, on fertility, on health and well-being, on respondent’s activity and income (as well as the partner’s, if available), on household possessions, income, and transfers, and finally on value orientation and attitudes (see Core Questionnaire5). This information is attained in a very detailed manner. In Germany this resulted in interviews of about one hour in length on average. However, the duration of the interviews varied quite a lot – from 27 minutes to 2 hours and 44 minutes (Ruckdeschel et al. 2009: 4). If the topic of the survey appears important or interesting enough to the respondents, the length of the interview should not pose a problem (Groves, Presser, and Dipko 2004). However, the GGS mainly consists of collecting facts and figures, and contains only a small number of questions on personal opinions or values.
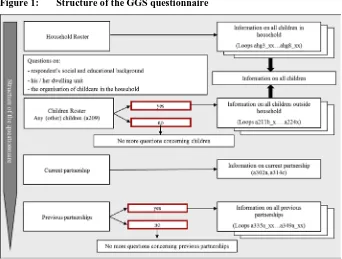
The questions about children were divided into two blocks, one about children in the household (included in the household roster), the other on children not living in the household. Both blocks were featured separately in the questionnaire (see Figure 1). In between these two blocks the survey contained questions concerning the respondent’s social and educational background, his or her dwelling unit, and the organisation of childcare for children living in the respondent’s household. In a later part of the questionnaire the block on previous partnerships was placed after an extensive part on current partnership, including household organisation and partnership quality. The part on children living outside of the household as well as the part on previous partnerships started with a screening question.
4 Including childcare and information on resident, non-resident, step and adopted children.
5 Available online: http://www.ggp-i.org/index.php?option=com_docman&task=doc_download&gid=46&It
Figure 1: Structure of the GGS questionnaire
Own representation
The target population of the German GGS consists of German-speaking persons aged 18 to 79 living in private households in Germany. The sample was taken through a multi-stage selection procedure6 and was carried out by TNS Infratest in the period of February to May 2005. The contents were collected using face-to-face interviews based on CAPI software on laptops. A total of 528 interviewers were deployed. They were prepared through written instructions that contained information on the selection procedure and on how to carry out the interviews. It should be noted that the average of roughly 19 interviews per interviewer varies from one interviewer to another. Nine interviewers did not complete a single interview, while 41 interviewers delivered 51 or more interviews (one interviewer carried out the maximum of 180 interviews). In total, 10,017 analysable interviews were carried out, of which 7,760 took place in the Western and 2,257 in the Eastern Federal States (Ruckdeschel et al. 2009: 11f.).
6 First step: random selection of geographical units; second step: selection of households via random route
The socio-economic composition7 of the realized GGS sample does not show any peculiarities apart from typical survey bias problems, which can be shown by comparing the characteristic distribution of the German GGS with reference statistics8. Hence, we use the German Microcensus9, an official representative population sample containing not only structural population and labour market data but also (starting in 2008) information on the total number of children a woman has in her lifetime10. The comparison reveals deviations typical in surveys (see also Kreyenfeld et al. 2011; Kreyenfeld, Hornung, and Kubisch 2013; Sauer, Ruckdeschel, and Naderi 2012). Respondents from one-person households appear less frequently in the actual sample of the GGS in comparison to the overall population in the Microcensus (26% to 35%). This could be explained by both the lower accessibility of economically active one-person households, and by the higher willingness of persons with children to participate in surveys such as the GGS (Festy and Prioux 2002; Hartmann and Schimpl-Neimanns 1992: 320). In other GGS-participating countries this under-representation also occurred, although to a lesser extent (Statistik Austria 2009: 14). Regarding the age distribution, it can be ascertained that large parts of the GGS sample mirror findings from the official statistics accurately. Research shows that respondents with a higher level of schooling tend to be more willing to participate in surveys (Hartmann and Schimpl-Neimanns 1992; Schnell 1997; Koch 1998; Neller 2005; Loosveldt, Carton, and Pickery 2008). We reach the same conclusion for the German GGS, as well as for other GGS-participating countries such as Austria (Statistik Austria 2009: 14) and France (Regnier-Loilier 2006: 19). The composition of the population varies in terms of nationality, with 5.5% being non-nationals in the GGS and nearly 10% being foreigners in the Microcensus. One reason for this difference might be that the GGS concentrates on persons who are linguistically able to follow the interview.
7 i.e., age, sex, level of schooling, number of household members, and municipality type.
8 Such a comparison should take into account whether effects exerted by different question and measurement
concepts can be largely ruled out with the characteristics in both data sources. As far as the results of the official statistics are consulted as a reference, this condition is only met for a small number of characteristics of the social structure.
9 Throughout this paper we used remote execution to access the Microcensus. Remote execution is the only
form of access permitting the analysis of formally anonymised original data. Instead of direct access to the data, the users receive structural data records (dummy files) that resemble the original material with regard to the structure and values of the variables. With the help of these dummy files, evaluation programmes (syntax scripts) can be prepared using analysis programmes, which then are used by the statistical offices to analyse the original data. After a required confidentiality check, the users finally receive the results of this analysis (see Statistisches Bundesamt, available online: http://www.forschungsdatenzentrum.de/en/data_access.asp, extracted on: 2015-06-01).
10 There have been problems in the Microcensus concerning underreporting of childlessness in older cohorts.
3.2 Distortions in the retrospective parts of the German GGS
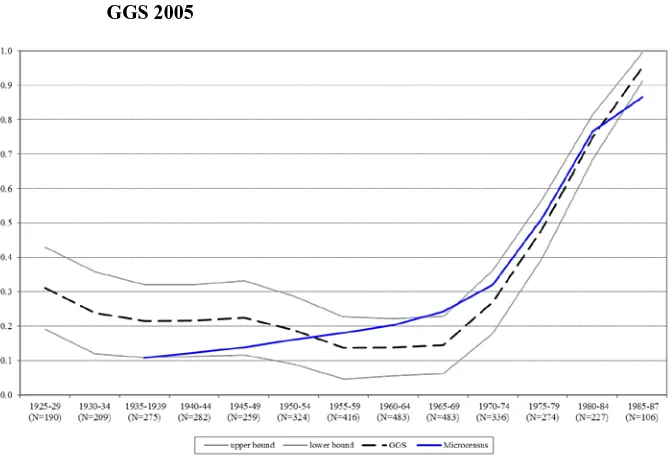
The comparison with the Microcensus confirms that there are distortions in the German GGS’ retrospective data. Figure 2 presents the proportion of childless women across cohorts. The curve of the GGS shows the deviations from the Microcensus mentioned above, i.e., there seems to be an overestimation of childless women for the cohort 1949 and older, while for the 1955–64 cohorts there is an underestimation. Kreyenfeld et al. (2011) also draw this conclusion. By contrast, the results for the 1970–84 cohorts are similar to the Microcensus. Sauer, Ruckdeschel, and Naderi (2012: 18) show that the parity distribution of mothers is in fact satisfactory, i.e., the proportion of mothers with one, two, three, and four children does not show significant peculiarities in comparison to the Microcensus. Nevertheless, the GGS appears to provide a misleading picture of the overall trend of fertility in Germany (Kreyenfeld, Hornung, and Kubisch 2013; Vergauwen et al. 2015).
Figure 2: Proportion of childless women by cohort, Microcensus 2008 and
GGS 2005
Notes: Women with German nationality living in Western Germany Microcensus cohorts start with 1933
N=all members of selected cohorts in GGS
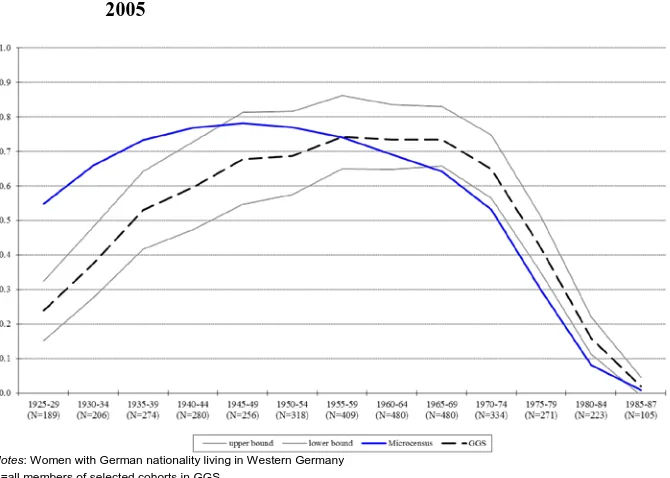
When looking at the second set of retrospective questions in the GGS, the partnership history, we find a similar picture.11 In the 1925–44 cohorts there is a large gap between the two data sources’ curves (see Figure 3). The lines converge for the 1945–64 cohorts but for the 1965–69 cohorts the difference again increases. The results for the 1970–84 cohorts are again quite compatible with the Microcensus. All in all, the proportion of married women is too low in the older cohorts and too high in the younger ones.
Figure 3: Proportion of married women by cohort, Microcensus 2005 and GGS
2005
Notes: Women with German nationality living in Western Germany N=all members of selected cohorts in GGS
Data sources: German GGS V 3.0 unweighted data; Microcensus by remote execution, own calculations
11 In order to validate retrospective data on former partnerships, however, we must limit our analysis to marital
4. Hypotheses
The literature shows that time-consuming surveys may cause particular distortions in data not when interviews are broken off but when one or both of the interview partners try to shorten the process (see section 2). Recurrent screening questions facilitate this action, as they allow for an easy abbreviation without offending the interview partner. In combination with learning effects, this could increase the risk of intentionally wrong answers to screening questions. In the GGS these conditions are met and distortions were found in the respective parts of the survey. With this assumption, we concentrate on purely methodological causes inherent to the questionnaire. There also may be other possible reasons, such as certain biographical events or personal feelings, for not mentioning former partners or children living outside the household. These cannot be detected with the available data. For this reason, we concentrate on technical questions where distortions should be systematic and produce recognisable patterns in the data.
Our first hypothesis concerns the average length of the questionnaire of 57 minutes, and the maximum of 164 minutes (Ruckdeschel et al. 2009: 4). In combination with the recurring screening questions for the children and partner rosters, fatigue effects could have regularly occurred.
H1 Follow-up questions to screening questions are more likely to remain unanswered by respondents in later parts than in earlier parts of the GGS.
As far as respondents are concerned, we assume that they learned to recognise screening questions during the interview. The design of the GGS questionnaire was such that after affirmative answers on screening questions, a large number of subsequent questions followed. For all persons mentioned in the household, follow-up questions concerning sex, age, current activity etc. were added. Both the section on children living outside the household and that on previous partnerships started with a screening question. A reference to “following questions” made it especially obvious to respondents that there would be follow-up questions on the topic. This may particularly be the case for data on previous partnerships, because respondents could have already learned from the household and children roster how to shorten the interview. Respondents who answered questions on children living outside the household, which was the first block of retrospective data initiated by a screening question, learned that the procedure was time-consuming and they might have omitted previous partners. Our second hypothesis therefore reads as follows:
On the other hand, the complexity and length of the survey tempts not only respondents but also the interviewers themselves to shorten an interview. This is especially applicable if interviewers are paid per interview, regardless of its length, such as in the German GGS. This could provide incentives to miscode the answers in order to avoid follow-up questions and to save time. In comparison to respondents, interviewers have the advantage of having better knowledge about the procedure and hence know the possibilities of shortening an interview undetected. Negations should affect the sections on children living outside the household and on partnerships. This is an effect which is expected to differ for inexperienced and experienced interviewers. Inexperienced interviewers learn over the course of the fieldwork. This means that with an increasing number of interviews the interviewers would learn how to shorten the process to their advantage:
H3 In interviews conducted by inexperienced interviewers the answers to screening questions are more likely to be negative in later than in earlier interviews.
Experienced interviewers who have already conducted other surveys do not have to learn how to take shortcuts during interviewing for the GGS. They already know how to keep interviews short without attracting attention. They also know how to keep the probability of discovery low.
H4 Experienced interviewers are more likely to have more and shorter interviews, with a lesser percentage of willingness to be recontacted than the average.
5. Method
Based on these hypotheses, our aim is to find explanations for the distortions in the German GGS by identifying problematic interviews and interviewers. The separation into interviewee and interviewer effects is purely analytical because the result of an interview is always dependent on the interview situation, which is in turn influenced by the interaction of both partners. In our context, it is problematic to filter out the effects of this interaction. Therefore we concentrate on both parties separately.
from that in the western states. Respondents are defined as Western Germans by the region they lived in at the time of the interview. The German GGS (GGS_Wave1_Germany_V3.0) contains 10,017 responses. After having selected females with German citizenship within the 1925-87 cohorts who are resident in the Western States of Germany, the sample size is reduced to 3,864 respondents.
In order to test our hypotheses on interviewers (H3 and H4) we will concentrate our monitoring on interviewers with ten or more interviews, to get enough variance for our tests and models. Furthermore, a large number of interviewers only conducted a very small number of interviews. This could lead to extreme parameter values on the one hand, yet on the other hand should have only a small effect on total results. We do not exclude male respondents from these analyses, as we want to ensure that all of an interviewer’s interviews are analysed. This leaves us with 275 interviewers12who conducted 8,861 interviews. Nonetheless, it is nearly impossible to decide which interviews are problematic by looking at answers ex-post. Although, for example, mothers who have never been married should be less common in older cohorts, they nevertheless exist and we have no means of separating ‘true’ answers from ‘false’ ones. There are no general solutions, but indicators must be chosen in accordance with the questionnaire in a case-sensitive manner. One possibility of finding at least hints of what went wrong is to try to recognize conspicuous patterns in the answers. With the GGS, this means that we examine in greater detail the answers to screening questions, because they provide an easy route to shortening the interview and are prone to the learning effect as they occur several times in the questionnaire. Regarding interviewees, we are looking for systematic missings after screening questions and their development over the course of the interview (H1, H2). Regarding interviewers, contacting alleged interviewees to enquire about the interviews is insufficient. With this method only fully faked results can be found, which are usually only made by inexperienced interviewers (Menold et al. 2013: 26; Storfinger and Winker 2013: 63; Hyman et al. 1954; Reuband 1990). Experienced interviewers only falsify parts of the interview, and this is even more difficult to detect by statistical means.
We applied logistic regression analysis to detect conspicuous interviewers (H3). Using cluster analysis, we tried to identify groups of interviewers with similar outcomes, determining the significance of the different separating factors with a discriminant analysis (H4). As opposed to experimental studies with known falsifiers, we cannot offer any proof that certain interviewers were problematic. We can merely offer probabilities that individual interviewers have an enhanced likelihood to skip certain questions, as well as which parts of the data are problematic. Generally, as we cannot
12 In fact, we have the information on laptop numbers. 519 interviewers used 524 laptops. Hence, we assume
know ex-post which interviews were actually falsified, we can only produce soft indicators, rather than hard statistical proof, of problematic data.
6. Results
We assume that the distortions in the GGS are caused by survey design and implementation, which affect both the respondents (H1 and H2) and the interviewers (H3 and H4).
6.1 Causes of distortion on the part of the interviewee
To test whether there might be fatigue and learning or conditioning effects due to the length and complexity of the GGS questionnaire, we look at three points: 1) increasing response gaps during the course of the interview, 2) more biased survey responses on screening questions in the later sections of the survey, 3) a surprisingly high proportion of mothers who were never married in older cohorts.
6.1.1 Response gap
To test the first hypothesis, we constructed a variable which we called “response gap”. A response gap exists if screening questions were positively answered, but there was no further information on this aspect. In the case of a response gap, respondents might have realised that their answer led to a lot of follow-up questions and therefore after the screening question they decided to give no further information13. If there were fatigue effects, this response gap should have increased during the course of the interview. This means that the response gap concerning information on the household roster should be lower than the response gap on information on children living outside the household, which again should be lower than the response gap on information on previous partnerships.
13 As stated in section 5, missing information in the data cannot be attributed positively as intentionally wrong.
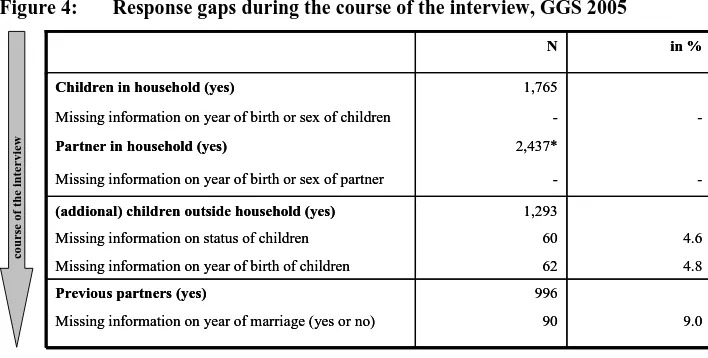
Figure 4: Response gaps during the course of the interview, GGS 2005
Notes: Women with German citizenship living in Western Germany
* 2,348 women indicated that they live together with a partner in the household. As one respondent mentioned four partners in the household, we excluded this case.
Data sources: German GGS V 3.0 unweighted data
In total, out of our sample of 3,864 women, 1,765 indicated that they had children in the household and 2,434 indicated that they were living together with a partner in the household (see Figure 4). We did not find any case in which further information on these children or partners is missing. As the household roster was the first block of questions of the interview this is no surprise. 1,293 women indicated that they had children outside the household. 60 of them did not give any further information on status of the children and 62 did not give any further information on the children’s birth year, which represents response gaps of 4.6% and 4.8%, respectively. When looking at the response gap regarding previous partnerships, out of 996 women who indicated a previous partnership 90 women did not give any further information, which reflects a proportion of about 9%. This means that during the course of the interview the proportion of missing answers or the response gap increased, which can be interpreted as a hint that the assumption of a fatigue effect holds true. In only six cases are the respondents who did not give any further information on children outside the household the same as those who did not give any further information on previous partnerships. Therefore we can exclude the possibility that there are respondents who are generally unable or unwilling to understand the questions and the interview procedure. These results offer strong support for H1.
1,293 (addional) children outside household (yes)
4.6 60
Missing information on status of children
4.8 62
Missing information on year of birth of children
9.0 90
Missing information on year of marriage (yes or no)
996 Previous partners (yes)
-Missing information on year of birth or sex of partner
2,437* Partner in household (yes)
-Missing information on year of birth or sex of children
1,765 Children in household (yes)
in % N
1,293 (addional) children outside household (yes)
4.6 60
Missing information on status of children
4.8 62
Missing information on year of birth of children
9.0 90
Missing information on year of marriage (yes or no)
996 Previous partners (yes)
-Missing information on year of birth or sex of partner
2,437* Partner in household (yes)
-Missing information on year of birth or sex of children
1,765 Children in household (yes)
6.1.2 Increase of biased survey responses to screening questions in later sections of the survey
In H2 we also hypothesized that during an interview respondents might learn that it could be beneficial to answer “no” to questions that will be followed by loops. Therefore we tested if survey responses to screening questions in later sections, such as previous partnerships, are more biased towards underreporting than screening questions in earlier sections, such as children outside the household. This should hold true especially for older birth cohorts who have children outside the household and who might have had several previous partnerships. We can see that for the cohorts 1949 and older, the proportion of childless women is about ten percentage points higher in the German GGS than in the Microcensus (see Figure 2 in section 3), while the proportion of married women in the GGS is underestimated by 30 percentage points in the 1925–29 cohort, by 25 percentage points in the 1930–34 cohort, by 20 percentage points in the 1935–39 cohort, and so on (see Figure 3 in section 3). This clearly shows that in the German GGS underreporting is higher in later sections. These results are supported by the work of Vergauwen and his colleagues (2015), who tested the quality of demographic data in the first wave of the GGS in 14 participating countries. For instance, they calculated the period and the total cohort fertility rate as well as the period and the cohort total female first marriage rate in GGS data and compared it with official statistics, where available. In countries such as France, the Netherlands, and Norway the total cohort fertility rate is reflected quite accurately, while in countries such as Bulgaria and Germany these results are distorted. In contrast to Bulgaria and Germany, countries with a less distorted representation of fertility implemented control questions14 in order to avoid mistakes. They asked questions such as “Do you really have no children?” in countries such as Austria, France, and the Netherlands. This might be an explanation for the varying results. In Germany such a question was not asked in order to implement the core questionnaire as accurately as possible. Another reason for omitting control questions was that we tried not to annoy respondents with interviewers apparently doubting their answers. The benefit of control questions is clear, however, when looking at the cohort female first-marriage rate. This is constructed by using the information on previous partnerships and was implemented without control questions in all the participating countries. In fact, it is underrepresented in the older cohorts in nearly all countries (Vergauwen et al. 2015). Generating demographic fertility indicators from retrospective event history data might be a specific German GGS problem, but generating demographic partnership indicators from retrospective event history data is a problem in nearly all GGS-participant countries. We trace this back to a combined fatigue and
14 The term “control questions” refers to questions that summarize information and ask the interviewee to
survey conditioning effect of respondents or interviewers who learned to identify screening questions over the course of the interview. As a consequence, and in line with H1 and H2, survey responses to screening questions in later sections, such as previous partnerships, are more biased towards underreporting than responses to such questions in earlier sections.
6.1.3 Mothers who were never married in older cohorts
If interviewees learned that shortening interviews by negating screening questions is effective (H2), then interviewees who had the chance to ‘learn’ this in earlier parts of the questionnaire (children roster) should have turned down the next screening question (partner roster) as well. In the GGS this means that
a) interviewees who have a response gap for the children roster could have learned for the partner roster to deny any previous partnerships, instead of indicating “yes” and then giving no further information.
b) interviewees who answered all the questions on the children roster could have a higher propensity to deny any previous partnerships in order to avoid answering the next round of loops.
for the older cohorts and slightly higher for the younger ones (Dorbritz 2008: 573; Grünheid 2011).
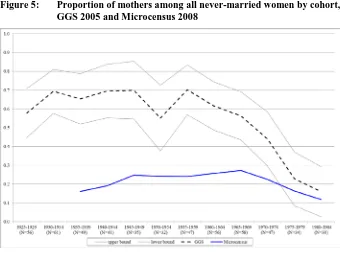
Figure 5: Proportion of mothers among all never-married women by cohort,
GGS 2005 and Microcensus 2008
Notes: Women with German citizenship living in Western Germany
Data sources: German GGS V 3.0 unweighted data; Microcensus by remote execution, own calculations
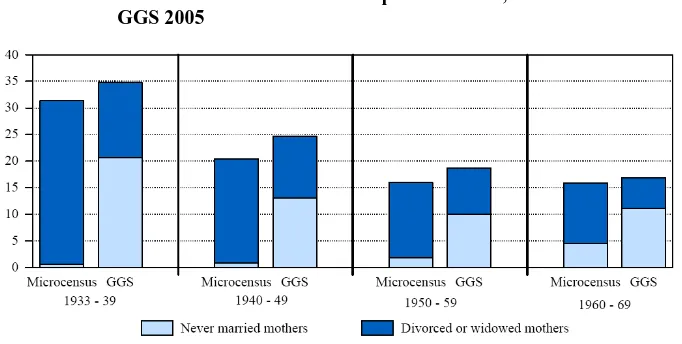
and divorced mothers are wrongly coded as “never-married”. Figure 6 shows that the differences between the sums of all currently not married mothers, i.e., the sum of the proportions of mothers who never have been married, who are actually divorced, or who are actually widowed in the Microcensus and in the GGS never exceed 4%. Statistical tests show that the differences are indeed insignificant15 in the three older cohorts. However, if we differentiate between the three categories and only look at mothers who were never married, the differences between the GGS and Microcensus are significant in all cohorts. While we find that less than 1% of all mothers were never married in the Microcensus for the 1933–39 cohorts, the GGS lists a rate of about 20%. These differences diminish across the cohorts, from 20% for the oldest cohorts to 12% for the 1940–49 cohorts to 8% and 7% for the two younger cohorts, respectively. The results are reversed for the proportions of widowed and divorced mothers. These findings support our assumption that mothers who are currently single were wrongly coded as never having been married because the interviewee or the interviewer avoided the questions on former partnerships, and thus no information on former partners was given. Judging solely from the survey results, it is impossible to differentiate between miscoded and actually divorced or widowed mothers. It can be assumed that in the middle-aged cohorts, in which divorce rates are higher (Dorbritz 2008), there should be a higher proportion of divorced mothers, while in the older cohorts widowhood should prevail. It is very likely that in many cases either the respondents or the interviewers avoided starting the loop on partnership.
15 Test for comparing two proportions, 5% level. Because of its large number of cases the Microcensus was
Figure 6: Proportion of never married or widowed/divorced mothers in relation to all women of the respective cohort, Microcensus 2008 and GGS 2005
Notes: Women with German nationality living in Western Germany
Data sources: German GGS V 3.0 unweighted data; Microcensus by remote execution, own calculations
6.2 Causes of distortion on the part of the interviewer
We assumed that not only respondents but also rational interviewers would be tempted to shorten interviews. This is especially applicable if interviewers are paid per interview, regardless of interview length, such as in the German GGS. In order to detect interviewer falsification, TNS Infratest used the so-called “verification method” by re-contacting a sample of an interviewer’s assigned interviewees to verify that their interviews were conducted correctly (Ruckdeschel et al. 2009: 11). If only parts of the interview, such as the retrospective questions, where omitted, this would have gone undetected by the verification method, because respondents would have answered that the interview itself was indeed conducted. In any case, the effectiveness of random recontacting is often doubted because the number of detected conspicuous interviews is typically low. (For an overview see Bredl et al. 2013: 12ff).
it is assumed that at least in partly fabricated interviews, an increased likelihood exists that those answers are given which lead to the avoidance of follow-up questions and therefore to a shortening of the interview.
6.2.1 Learning effects of inexperienced interviewers
In our first approach to interviewer control, we assumed that there could be a learning effect over the course of the fieldwork. We hypothesized that with an increasing number of interviews, the interviewers would learn how to shorten the process to their advantage. Nevertheless, we know that our interviewers were quite experienced in the first place and that they probably realised right away where and how to shorten the interview. Therefore this method will only be partly successful, mainly with inexperienced interviewers (e.g., Storfinger and Winker 2013: 63). We assume that the tendency to shorten interviews is a trait of the interviewer that is independent of characteristics of the interviewee such as sex, age, or region. Therefore we must evaluate all of an interviewer’s interviews and expand our sample to all interviews of interviewers with 10 or more interviews.
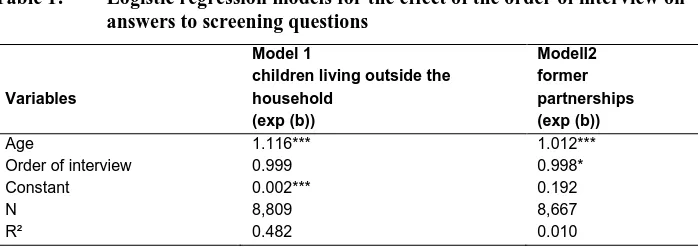
To test this hypothesis, in a first step we calculated a simple logistic regression approach by taking the answer to the question of whether there were children outside the household as a dichotomous dependent variable16. We applied the order17 of the interviews as an independent variable. Additionally, we controlled for the age of the respondent, because the fact of having children who have already left home is strongly dependent on the age of the respondent (i.e., the parent). The results of the logistic regression analysis revealed no significant effect of the order of the interview (see Table 1). As expected, with increasing age of the respondent the probability of having children outside the household increases. Thus, the age of the respondent has a significant effect. In a second step we then repeated this analysis separately for each interviewer, i.e., we computed 275 regression models by taking the answer to the question of if there were children outside the household as a dichotomous dependent variable. As a result, we identified 8 interviewers who completed 468 interviews in total where the order of the interview had a significant effect on the probability of having a child not residing in the household. Of these 8 interviewers, 4 show a significant negative effect, which supports our assumption that they learned how to shorten interviews. The other 4 interviewers have a significant positive effect, which supports the idea of unskilled interviewers who learn how to handle the questionnaire better with each interview. Although the effect is
16 Coded as 1 − “yes” and 0 − “no”.
17 This means that the interviews assigned to one interviewer are listed in the order they were carried out, i.e.,
opposite, the result for the quality of the data is also negative. Eight interviewers who completed 468 interviews constitute about 5% of all interviews and the results are no real proof of our assumptions. When we left these interviews out of our calculations we found slight reductions of about 1 to 2 percentage points of childlessness in the 1925–39 cohorts.
We also checked for learning effects of interviewers in the section on partnership history. Again, in a first step we used a simple logistic regression model with previous partnerships18 as the dependent variable and the order of the interview as the explanatory variable. As in the fertility history, age should have a positive influence in the partnership history. The probability of having lived together with a previous partner should increase with age, although social norms in Germany were such that in older cohorts the number of previous partnerships should be quite limited (Schmidt et al. 2006: 27f). The results of the logistic regression revealed a strong significant effect for age of the respondent and a weaker significant effect for order of the interview, which is a clear indicator of a fatigue effect. Again, in a second step we tested interviewers individually and identified 13 interviewers with significant effects regarding previous partnerships. Six out of these 13 had a significant negative effect on the probability of having previous partnerships, which is consistent with our assumption. The other 7 showed significant positive effects, which again indicates a possible learning effect in terms of improved handling of the questionnaire. These 13 interviewers conducted a total of 907 interviews. In comparison to the interviewer control on fertility history, two aspects must be mentioned. First, there are more questionable interviewers here than in the fertility history analysis, which can be explained by the fact that the questions concerning partnership history occur in a later section of the questionnaire. There could be a fatigue or conditioning effect during the interview, with more interviewers or interviewees omitting this second block of loops. Second, the interviewers who are problematic in the section on fertility history are not the same as the ones who are problematic in the section on partnership history. There are two explanations for this. On the one hand, interviewers may not always falsify systematically but rather somewhat erratically, while we only used a very conservative and simple test to detect them. On the other hand, again, the effect is not necessarily caused by interviewers only, but could also be caused by respondents. However, regardless of the actual cause, the effect on the data quality is negative.
Table 1: Logistic regression models for the effect of the order of interview on answers to screening questions
Variables
Model 1
children living outside the household
(exp (b))
Modell2 former partnerships (exp (b))
Age 1.116*** 1.012***
Order of interview 0.999 0.998*
Constant 0.002*** 0.192
N 8,809 8,667
R² 0.482 0.010
Data sources: German GGS V 3.0 unweighted data; own calculations
Statistical significance = ***: p<0.001; **: p<0.01; *: p<0.05
6.2.2 Learning effects of experienced interviewers
questions on (1) children living outside the household, (2) former partnerships, (3) mean duration, (4) number of interviews, and (5) mean willingness to be recontacted.
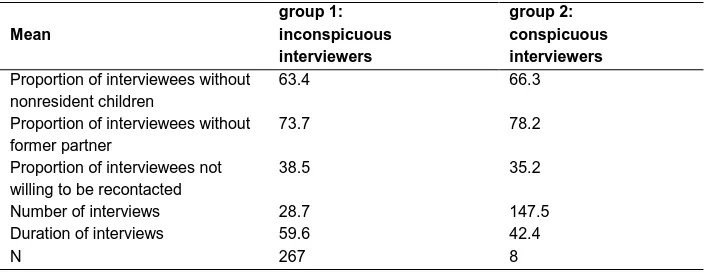
As a result of the cluster analysis19 we obtained two groups, one with 267 interviewers and the other with 8 interviewers. To find out which of the items were mainly responsible for the separation into two groups we performed a discriminant analysis20, which produced a very clear separation between the two groups: 98.9% of the cases were separated correctly. In comparison with the larger group, the smaller group has a higher percentage of negative answers on children living outside the household as well as on the question of former partnerships (see Table 2). It has a mean of 147.5 interviews per interviewer and a duration of 42.4 minutes, while the larger group has 28.8 interviews and 59.7 minutes. The percentage of respondents willing to be recontacted is 35.2 in comparison to 38.5 in the larger group. However, the results of the discriminant analysis show that only mean number and duration of interviews discriminate significantly between the two groups. These are the two items that indicate the direct positive output, i.e., the gain an interviewer gets from shortening interviews.
Table 2: Description of variables of the discriminant analysis
Mean
group 1: inconspicuous interviewers
group 2: conspicuous interviewers
Proportion of interviewees without nonresident children
63.4 66.3
Proportion of interviewees without former partner
73.7 78.2
Proportion of interviewees not willing to be recontacted
38.5 35.2
Number of interviews 28.7 147.5
Duration of interviews 59.6 42.4
N 267 8
Data sources: German GGS V 3.0 unweighted data; own calculations
Excluding these eight conspicuous interviewers did not lead to large changes in the results for childlessness or the share of single women. Taking the share of childless women from Western Germany without problematic interviewers into consideration, then in the older birth cohorts we have an approximation of two percentage points compared to the results of the Microcensus. Excluding conspicuous interviewers from
the analysis, therefore, hardly reduces the total amount of distortion, which is in line with results from other studies concerning the “quality” of fabricated interviews (Reuband 1990; Schnell 1991; Koch 1995; Schräpler and Wagner 2003). Therefore, we refrain from advising excluding suspicious interviewers from the data, as although we have strong indicators for problems with these interviewers we cannot definitively prove that their results were faulty, or which interviews were affected.
7. Conclusion and outlook
The GGS is a highly ambitious project with a complex and extensive questionnaire. This complexity might make the survey prone to distortion. We tested hypotheses about possible distortions using data from the German GGS. Indeed, problems did show up in complex parts of the survey. Compared with the Microcensus, there are severe distortions in the retrospective data on both fertility and partnership in the 2005 German GGS. In fertility histories there is a strong overestimation of childless women in older cohorts as well as an underestimation of this group in middle-aged cohorts. Regarding partnership histories, in our data we find too many women who were never married in the older cohorts, and too many married women in the younger cohorts.
interviewers’ results had a significant effect on the probability of answers relating to the probability of having had a previous partnership.
We also tested for interviewer effects in several other ways. We consistently found indications that there was incorrect coding that affected the quality of the data, although each of them alone was too small to account for the full extent of the distortions in the survey. We therefore conclude that the complexity and length of the survey has combined effects on both respondents and interviewers.
As the GGS is an internationally comparable survey based on nearly the same instrument and design in all participating countries, it could be assumed that these distortions and effects would appear in all countries. However, these effects occur only if no control questions are implemented. The original questionnaire featured no control questions, although they could have reduced the risk of incorrect coding immensely. The original questionnaire served as a template for the national questionnaires, while requesting that they should not be altered for the sake of international comparison (Vikat et al. 2005: 17). Regarding fertility, this means that these effects are a particularly German data problem, because most of the other countries implemented control questions. Regarding previous partnerships, no control questions were implemented in any country, so that information on this part is underrepresented in the older cohorts in nearly all countries with comparable official data.
We can also show that the role of interviewers is of major importance for the quality of interviews. For survey planning, this means that interviewer training and motivation – especially the method of payment – is a crucial factor for the entire survey process. Efficient mechanisms of interviewer control during fieldwork should also be considered. Another measure worth instituting might be limiting the maximum number of interviews a single interviewer can conduct, because, as in the case of the GGS, many interviewers reduce the effect of individual wrongdoers. However, interviewers with a large number of interviews are more experienced and normally handle difficult questionnaires better, i.e., there would be less positive learning effects in certain sections of the questionnaire. These pros and cons must be balanced for any future survey, especially the need for detailed information and the respondents’ right to a quick and simple interview.
It is essential for all surveys that deviations in the data are carefully analysed before constructing weights. Problems related to the sampling procedure may bias the data, but can be corrected by weighting. However, incorrect coding − as we found it in parts of the retrospective data of the German GGS − cannot be adjusted by weighting. As the wrong coding cannot be traced back to the individual level, these errors cannot be corrected methodically and weighting will not solve the problem.
8. Acknowledgements
References
Beyreuther, L. and Lück, D. (2012). Oma und Nene als Tagesmutter? – Welchen Beitrag leisten Großelternbetreuung und die kulturelle Wertschätzung von Kindern zur Erklärung der Fertilitätsunterschiede zwischen Deutschen und Türken in Deutschland? Bevölkerungsforschung aktuell 04/2012: 2–10.
Blasius, J. and Thiessen, V. (2012). Assessing the Quality of Survey Data. Los Angeles: Sage.
Bredl, S., Storfinger, N., and Menold, N. (2013). A Literature Review of Methods to Detect Fabricated Survey Data. In: Winker, P., Menold, N., and Porst, R. (eds.). Survey Standardization and Interviewers’ Deviations – Impact, Reasons, Detection and Prevention. Frankfurt am Main: PL Academic Research: 3–24. Brüderl, J., Huyer-May, B., and Schmiedeberg, C. (2013). Interviewer Behaviour and
the Quality of Social Network Data. In: Winker, P., Menold, N., and Porst, R. (eds.). Survey Standardization and Interviewers’ Deviations – Impact, Reasons, Detection and Prevention. Frankfurt am Main: PL Academic Research, 147–160. Crespi, L.P. (1945). The Cheater Problem in Polling. Public Opinion Quarterly 9(4):
431–445. doi:10.1086/265760.
Di Giulio, P., Bühler, C., Ette, A., Fraboni, R., and Ruckdeschel, K. (2012). Social Capital and Fertility Intentions. The Case of Italy, Bulgaria, and West Germany. Wien: Vienna Institute of Demography (VID Working Paper, 02/2012).
Dorbritz, J. (2008). Germany: Family diversity with low actual and desired fertility: Childbearing Trends and Policies in Europe. Demographic Research 19 (Special Collection 7) : 557–598. http://www.demographic-research.org/Volumes/Vol19/ 17/19-17.pdf, date of last visit: 2015-06-01.
Dorbritz, J. (2009). Bilokale Paarbeziehungen - die Bedeutung und Vielfalt einer Lebensform. Zeitschrift für Bevölkerungswissenschaft 34(1–2): 31–56.
doi:10.1007/s12523-010-0032-3.
Duan, N., Alegria, M., Canino, G., McGuire, T.G., and Takeuchi, D. (2007). Survey Conditioning in Self-Reported Mental Health Service Use: Randomized Comparison of Alternative Instrument Formats. Health Services Research 42(2): 890–907. doi:10.1111/j.1475-6773.2006.00618.x.
Esser, H. (1985). Befragtenverhalten als „rationales Handeln“ – zur Erklärung von Antwortverzerrungen in Interviews. Mannheim: Zentrum für Umfragen, Methoden und Analysen (ZUMA-Arbeitsbericht 1985/01).
Ette, A. and Ruckdeschel, K. (2007). Die Oma macht den Unterschied! Der Einfluss institutioneller und informeller Unterstützung für Eltern auf ihre weiteren Kinderwünsche. Zeitschrift für Bevölkerungswissenschaft 32(1–2): 51–72. Festy, P. and Prioux, F. (2002). An evaluation of the Fertility and Family Surveys project.
New York and Geneva: United Nations.
Groves, R.M., Fowler, F.J., Couper, M.P., Lepkowski, J.M., Singer, E., and Tourangeau, R. (2009). Survey Methodology. Second Edition. Hoboken: Wiley.
Groves, R.M., Presser, S., and Dipko, S. (2004). The Role of Topic Interest in Survey Participation Decisions. Public Opinion Quarterly 68(1): 2–31.
doi:10.1093/poq/nfh002.
Grünheid, E. (2011). Wandel des Heiratsverhaltens in Deutschland. Analysen mit Tafelberechnungen. Wiesbaden: Bundesinstitut für Bevölkerungsforschung (BiB Working Paper, 02/2011). http://www.bib-demografie.de/SharedDocs/Publikat ionen/DE/Working_Paper/2011_2_heiratsverhalten_deutschland.html?nn=3072 742, date of last visit: 2015-06-01.
Hart, T.C., Rennison, C.M., and Gibson, C. (2005). Revisiting respondents 'fatigue bias' in the national crime victimization survey. Journal of Quantitative Criminology 21(3): 345–363. doi:10.1007/s10940-005-4275-4.
Hartmann, P.H. and Schimpl-Neimanns, B. (1992). Sind Sozialstrukturanalysen mit Umfragedaten möglich? Analysen zur Repräsentativität einer Sozialforschungsumfrage. Kölner Zeitschrift für Soziologie und Sozialpsychologie 44(2): 315–340.
Höhn, C., Ette, A., and Ruckdeschel, K. (2006). Kinderwünsche in Deutschland - Konsequenzen für eine nachhaltige Familienpolitik. Stuttgart: Robert-Bosch-Stiftung.
Hood, C. and Bushery, J.M. (1997). Getting more Bang from the Reinterviewer Buck: Identifying ‘At Risk’ Interviewers. Proceedings of the American Statistical Association (Survey Research Methods Section), 820-824.
Kennickell, A.B. (2002). Interviewers and Data Quality: Evidence from the 2001 Survey of Consumer Finances. Proceedings of the American Statistical Association (Survey Research Methods Section), 1807–1812.
Köhne-Finster, S. and Güllner, G. (2009). Ergebnisse der Interviewerbefragung im Mikrozensus. Wirtschaft und Statistik 5: 397–405.
Koch, A. (1995). Gefälschte Interviews: Ergebnisse der Interviewerkontrolle beim ALLBUS 1994. ZUMA-Nachrichten 19(36): 89–105.
Koch, A. (1998). Wenn „mehr“ nicht gleichbedeutend mit „besser“ ist: Ausschöpfungsquoten und Stichprobenverzerrungen in allgemeinen Bevölkerungsumfragen. ZUMA-Nachrichten 22(42): 66–93. http://www.gesis. org/fileadmin/upload/forschung/publikationen/zeitschriften/zuma_nachrichten/z n_42.pdf.date of last visit: 2015-06-01.
Kreuter, F., Mc Culloch, S., Presser, S., and Tourangeau, R. (2011). The Effects of Asking Filter Questions in Interleafed Versus Grouped Format. Sociological Methods & Research 40(1): 88–104. doi:10.1177/0049124110392342.
Kreyenfeld, M., Hornung, A., and Kubisch, K. (2013). The German Generations and Gender Survey: Some Critical Reflections on the Validity of Fertility Histories. Comparative Population Studies. Zeitschrift für Bevölkerungswissenschaft 28(1): 3–28.
Kreyenfeld, M., Hornung, A., Kubisch, K., and Jaschinski, I. (2010). Fertility and union histories from German GGS data: some critical reflections. Rostock: Max Planck Institute for Demographic Research. (MPIDR Working Papers, WP-2010–023). Kreyenfeld, M., Konietzka, D., and Hornung, A. (2009). Family diversity in France, the
Russian Federation, and East and West Germany: overview on living arrangements and living conditions. In: UNECE (ed.). How generations and gender shape demographic change: towards policies based on better knowledge. New York and Geneva: United Nations: 33–56.
Kreyenfeld, M., Zeman, K., Burkimsher, M., and Jaschinski, I. (2011). Fertility data for German-speaking countries: What is the potential? Where are the pitfalls? Rostock: Max Planck Institute for Demographic Research. (MPIDR Working Paper WP 2011–003).
Krosnick, J.A. and Presser, S. (2010). Question and Questionnaire Design. In: Marsden, P.V. and Wright, J.D. (eds.). Handbook of Survey Research. 2nd edition. Bingley, UK: Emerald: 263–314.
Loosveldt, G., Carton, A., and Pickery, J. (2008). The Effect of Interviewer and Respondent Characteristics on Refusals in a Panel Survey. In: Koch, A. and Porst, R. (eds.). Nonresponse in Survey Research. Proceedings of the Eighth International Workshop on Household Survey Nonresponse 24-26 Sept. 1997. Mannheim: 249–262.
Marsden, P.V. (2003). Interviewer Effects in Measuring Network Size Using a Single Name Generator. Social Networks 24: 407–422. doi:10.1016/S0378-8733(02) 00016-3.
Matschinger, H., Bernert, S., and Angermeyer, M.C. (2005). An Analysis of Interviewer Effects on Screening Questions in a Computer Assisted Personal Mental Health Interview. Journal of Official Statistics 21(4): 657–674.
Menold, N., Winkler, P., Storfinger, N., and Kemper, C.J. (2013). A Method for Ex-Post Identification of Falsifications in Survey Data. In: Winker, P., Menold, N., and Porst, R. (eds.). Survey Standardization and Interviewers’ Deviations – Impact, Reasons, Detection and Prevention. Frankfurt am Main: PL Academic Research, 25–47.
Micheel, F. and Naderi, R. (2009). Subjektive Einschätzung der ökonomischen Lage älterer Türkinnen und Türken im Zusammenhang mit ihrer sozialen Einbindung. Zeitschrift für Bevölkerungswissenschaft 34(1–2): 165–198.
Murphy, M. (2009). Where have all the children gone? Women's reports of more childlessness at older ages than when they were younger in a large-scale continuous household survey in Britain. Population Studies 63(2): 115–133.
doi:10.1080/00324720902917238.
Ní Bhrolcháin, M., Beaujouan, E., and Murphy, M. (2011). Sources of error in reported childlessness in a continuous British household survey. Population Studies 65(3): 305–318. doi:10.1080/00324728.2011.607901.
Regnier-Loilier, A. (2006). Présentation, questionnaire et documentation de l’« Etude des relations familiales et intergénérationnelles » (ERFI): Version française de l’enquête « Generations and Gender Survey » (GGS). Paris: Institut National D’Études Démographiques (Documents de travail 133).
Reuband, K.-H. (1990). Interviews, die keine sind - "Erfolge" und "Mißerfolge" beim Fälschen von Interviews. Kölner Zeitschrift für Soziologie und Sozialpsychologie (4): 706–733.
Ruckdeschel, K., Ette, A., Hullen, G., and Leven, I. (2009). Generations and Gender Survey: Documentation of the first wave in Germany. Wiesbaden: Bundesinstitut für Bevölkerungswissenschaften (Materialien zur Bevölkerungswissenschaft, Supplement to 121a).
Sauer, L., Ruckdeschel, K., and Naderi, R. (2012). Reliability of retrospective event histories within the German Generations and Gender Survey. Wiesbaden: Bundesinstitut für Bevölkerungsforschung (BiB Working Paper, 01/2012). http://www.bib-demografie.de/SharedDocs/Publikationen/DE/Working_Paper/2 012_1_reliability_ggs.html?nn=3071978, date of last visit: 2015-06-01.
Savage, S.J. and Waldman, D.M. (2008). Learning and fatigue during choice experiments: a comparison of online and mail survey methods. Journal of Applied Econometrics 23(3): 351–371. doi:10.1002/jae.984.
Schaeffer, N.C., Dykema, J., and Maynard, D.W. (2010). Interviews and Interviewing. In: Marsden, P.V. and Wright, J.D. (eds.). Handbook of Survey Research. 2nd edition. Bingley, UK: Emerald: 437–470.
Schmidt, G., Matthiesen, S., Dekker, A., and Starke, K. (2006). Spätmoderne Beziehungswelten. Wiesbaden: VS Verlag.
Schnell, R. (1991). Der Einfluß gefälschter Interviews auf Survey-Ergebnisse. Zeitschrift für Soziologie 20(1): 25–35.
Schnell, R. (1997). Nonresponse in Bevölkerungsumfragen: Ausmaß, Entwicklung und Ursachen. Opladen: Leske+Budrich. doi:10.1007/978-3-322-97380-1.
Schräpler, J.-P. and Wagner, G.G. (2003). Identification, Characteristics and Impact of Faked Interviews in Surveys: An Analysis by means of genuine fakes in raw data of SOEP, Bonn: IZA (IZA Discussion Paper No. 969).
Schreiner, I., Pennie, K., and Newbrough, J. (1988). Interviewer Falsification in Census Bureau Surveys. Proceedings of the American Statistical Association (Survey Research Methods Section): 491–496.
Statistik Austria (2009). Generations and Gender Survey: Familienentwicklung in Österreich Welle 1 - Generationen und Geschlechterrollen. Endbericht. Wien. Stewart, N. and Flowerman, S.H. (1951). An Investigation of Two Different Methods for
Evaluation of Interviewer Job Performance. Personnel Psychology 4(2): 161– 170. doi:10.1111/j.1744-6570.1951.tb01469.x.
Stocké, V. (2004). Entstehungsbedingungen von Antwortverzerrungen durch soziale Erwünschtheit. Ein Vergleich der Prognosen der Rational-Choice Theorie und des Modells der Frame-Selektion. Zeitschrift für Soziologie 33(4): 303–320. Stocké, V. (2007). The Interdependence of Determinants for the Strength and Direction
of Social Desirability Bias in Racial Attitude Surveys. Journal of Official Statistics 23(4): 493–514.
Storfinger, N. and Winker, P. (2013): Assessing the Performance of Clustering Methods. In: Winker, P., Menold, N., and Porst, R. (eds.). Survey Standardization and Interviewers’ Deviations – Impact, Reasons, Detection and Prevention. Frankfurt am Main: PL Academic Research, 49–65.
Tourangeau, R., Rips, L.J., and Rasinski, K. (2000). The Psychology of Survey Response. Cambridge: Cambridge University Press. doi:10.1017/CBO9780511 819322.
van Tilburg, T. (1998). Interviewer effects in the measurement of personal network size. Sociological Methods & Research 26: 300–328. doi:10.1177/00491241980260 03002.
UNECE (2005), http://www.unece.org/pau/pub/ggp_survey_instruments.html.
Vergauwen, J., Wood, J., De Wachter, D., and Neels, K. (2015). Quality of Demographic Data in GGS Wave 1. Demographic Research 32(24): 723–774.
Vikat, A., Spéder, Z., Beets, G., Billari, F.C., Bühler, C., Désesquelles, A., Fokkema, T., Hoem, J.M., MacDonald, A., Neyer, G., Pailhé, A., Pinnelli, A., and Solaz, A. (2007). Generations and Gender Survey (GGS): Towards a better understanding of relationships and processes in the life course. Demographic Research 17(14): 389–440. doi:doi.org/10.4054/DemRes.2007.17.14.
Vikat, A., Beets, G., Billari, F.C., Bühler, C., Désesquelles, A., Fokkema, T., MacDonald, A.L., Neyer, G.R., Pailhé, A., Pinnelli, A., Solaz, A., and Spéder, Z. (2005). Wave 1 Questionnaire Manual. New York and Geneva: UNECE.
http://www.ggp-i.org/images/stories/Survey_Instruments/GGP_QuestW1Manua l.pdf, date of last visit: 2016-01-26.
Windzio, M. and Aybek, C. (2010). Der Auszug junger Erwachsener türkischer und deutscher Herkunft aus dem Elternhaus. Die Rolle von Wertorientierungen und intergenerationalen Beziehungen. In: Ette, A., Ruckdeschel, K., Unger, R. (eds.). Potenziale intergenerationaler Beziehungen. Chancen und Herausforderungen für die Gestaltung des demografischen Wandels. Würzburg: Ergon Verlag: 249– 282.
Windzio, M. and Aybek, C. (2012). Erwachsen werden in der Einwanderungsgesellschaft. Der Auszug aus dem Elternhaus bei jungen Erwachsenen türkischer und deutscher Herkunft. Würzburg: Ergon Verlag. Wolf, C. (2004). Egozentrierte Netzwerke. Erhebungsverfahren und Datenqualität.
Appendix
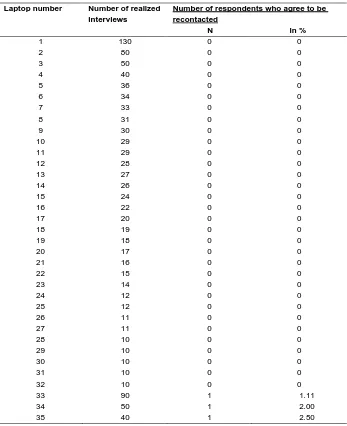
Table A1: Laptop/interviewer number and willingness to be recontacted
Laptop number Number of realized interviews
Number of respondents who agree to be recontacted
N in %
1 130 0 0
2 80 0 0
3 50 0 0
4 40 0 0
5 36 0 0
6 34 0 0
7 33 0 0
8 31 0 0
9 30 0 0
10 29 0 0
11 29 0 0
12 28 0 0
13 27 0 0
14 26 0 0
15 24 0 0
16 22 0 0
17 20 0 0
18 19 0 0
19 18 0 0
20 17 0 0
21 16 0 0
22 15 0 0
23 14 0 0
24 12 0 0
25 12 0 0
26 11 0 0
27 11 0 0
28 10 0 0
29 10 0 0
30 10 0 0
31 10 0 0
32 10 0 0
33 90 1 1.11
34 50 1 2.00
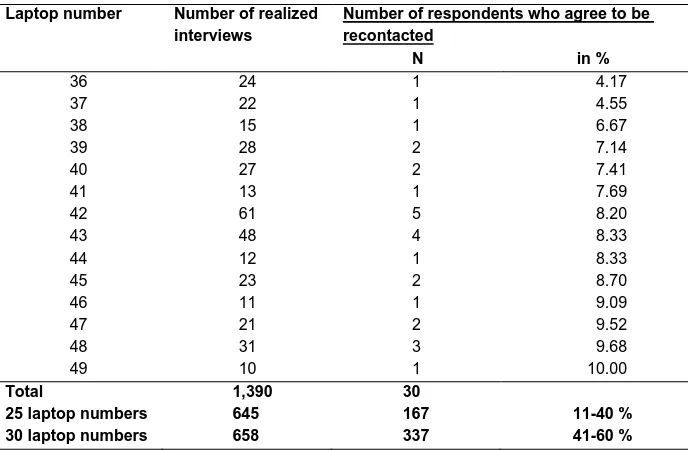
Table A1: (Continued)
Laptop number Number of realized interviews
Number of respondents who agree to be recontacted
N in %
36 24 1 4.17
37 22 1 4.55
38 15 1 6.67
39 28 2 7.14
40 27 2 7.41
41 13 1 7.69
42 61 5 8.20
43 48 4 8.33
44 12 1 8.33
45 23 2 8.70
46 11 1 9.09
47 21 2 9.52
48 31 3 9.68
49 10 1 10.00
Total 1,390 30
25 laptop numbers 645 167 11-40 %
30 laptop numbers 658 337 41-60 %