ISSN 0975-928X
Research Article
Genetic studies in tomato for yield and its components under high
temperature
Reecha T. Das*, Pranab Talukdar and Akashi Sarma
Department of Plant Breeding and Genetics, Assam Agricultural University, Jorhat 785013, India
E-mail: [email protected]
(Received: 21 Nov 2015; Revised: 04 April 2017; Accepted: 21 April 2017)
Abstract
Generation mean analysis was carried out on six generations (P1, P2, F1, F2, B1 and B2) in four tomato crosses viz. Cross-I
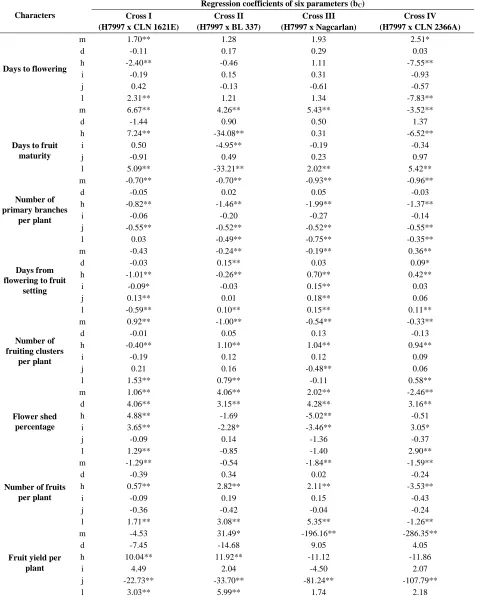
(H7997 x CLN 1621 E), Cross- II (H7997 x BL 337), Cross - III (H7997 x Nagcarlan) and Cross- IV (H997 x CLN 2366A). Observstions were recorded on eight yield attributing characters including yield. The presence of epistasis was recorded in all the four crosses. From six parameter model regression of the components of six parameter model on environmental indices it was evident that it was evident that additive effect played a decisive role in the inheritance of number of primary branches per plant, number of fruiting clusters per plant and fruit yield per plant. Dominance effect was found significant and consistent in one or more crosses for days to flowering, number of fruiting clusters per plant and fruit yield per plant. Duplicate epistasis was more predominant for most of the characters in the crosses.
Key words
Tomato, gene action, heat tolerance, yield
Introduction
Tomato (Lycopersicon esculentum Mill.) belongs to the family solanaceae and it is native of Peru, Equador region (Rick, 1965). In many countries it is known as poor man’s orange (Dhall and Singh, 2013) because of its attractive and nutritive value. High temperatures during the growing season have been reported to be detrimental to growth, reproductive development and yield of several crops (Singh et al., 2007). Development of tomato cultivars with improved fruit set under high temperature would be valuable for tomato crop production in regions where the temperature during part of the growing season reaches ≥ 35°C or higher (Johnson and Hall, 1953).
Progress in developing heat-tolerant cultivars has been hindered by the complexity of the trait and its low heritability values (Villareal and Lai, 1979). To develop heat tolerant varieties the information on the nature of gene action controlling the economic characters is considered important. Knowledge of genetic architecture of the characters under improvement is essential for adopting appropriate breeding procedure. Such knowledge leads the breeder to develop new commercial varieties of the crop. Study of inheritance of the characters would facilitate the adoption of appropriate breeding strategies and improve efficiency of selection procedure.
Material and Methods
The experiment was conducted at three different environments during offseason and one in rabi
with elevation of 9l m above mean sea level.The weekly data obtained from the Department of Agricultural Meteorology, Assam Agricultural University, Jorhat, Assam, Indian on monthly mean maximum and minimum day temperatures during the period of investigation showed that mean maximum ranged from 21.90 – 44.00 O C and mean minimum temperature ranged from 9.50 to 30.00 OC. Four heat tolerant tomato genotypes viz., CLN 1621E, BL 337, Nagcarlan and CLN 2366A, and one heat sensitive genotype H 7997 were utilised to generate four crosses. viz. Cross-I (H7997 x CLN 1621 E), Cross- II (H7997 x BL 337), Cross - III (H7997 x Nagcarlan) and Cross- IV (H997 x CLN 2366A) by attempting crosses during rabi, 2012 and these along with the parental lines H7997, CLN 1621 E, BL 337, Nagcarlan and CLN 2366A comprised the entries for experiment on generation mean analysis. H7997 was used as a recurrent parent in backcross I (B1) and the heat
tolerant genotypes were used as recurrent parent in backcross II (B2).
Two rows of each parent, F1 and backcross
generations and eight rows of each F2 were planted
in randomized block design with two replications. Inter and intra row was kept as 50 cm and 30 cm respectively. Observations were recorded on five randomly selected plants in each of P1, P2, 10
plants of F1 and 40 plants in F2 and 20 plants that
of B1and B2 in each of the replications on days to
5th June (E3) and 15th October (E4). In E3, the
experiment was conducted inside polyhouse. The collected data were subjected to appropriate statistical analyses using Microsoft Excel 2007.
The means and variances were calculated as suggested by Hayman (1958) . The presence of epistasis was detected by using A, B and C scaling test as proposed by Mather (1949) and Hayman and Mather (1955). To test the adequacy of additive dominance model, the individual scaling tests given by Mather (1949) as well as joint scaling tests by Cavalli (1952) were applied. First, simple additive- dominance model consisting of mean (m), additive (d) and dominance (h) gene effects were tried and the adequacy of the model was tested by chi square test. When this model failed to explain variation among generation means, additive x additive (i), additive x dominance (j) and dominance x dominance (l) were included. The type of epistasis was determined only when dominance (h) and dominance x dominance (l) effects were significant. When these effects had the same sign, the type of epistasis was complementary, while different signs included duplicate epistasis. In order to test sensitivity to environmental fluctuation regression coefficients of the components of generation mean on environmental indices were estimated.
Results and Discussion
In the present study, the results of the scaling tests indicated the presence of epistasis for all the characters in all the crosses for individual environments and pooled over environments. Cavalli suggested a procedure known as Joint Scaling test in which the available information from all the generations can be combined to test the adequacy of the additive-dominance model and also to obtain estimates of these components. The estimation of gene effects showed significance for all characters except for number of primary branches per plant in the four crosses in individual environments and pooled over environments.
Failure to obtain good fit for additive-dominance model for all the other characters indicated presence of digenic or higher order interactions or linkage influencing the inheritance of these characters. Jinks and Jones (1958) have developed methods for estimating additive, dominance and epistatic parameters based on components of means of different generations. Yield as well as
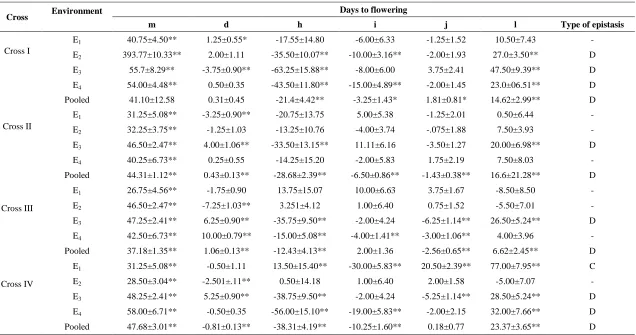
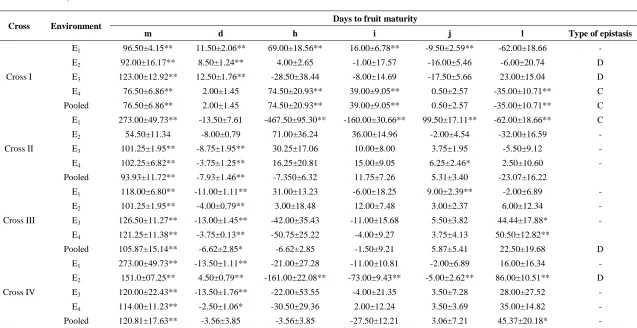
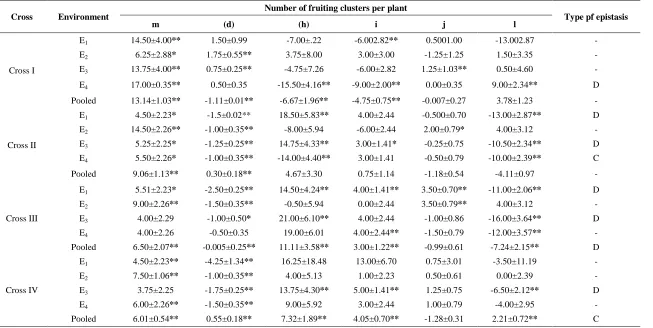
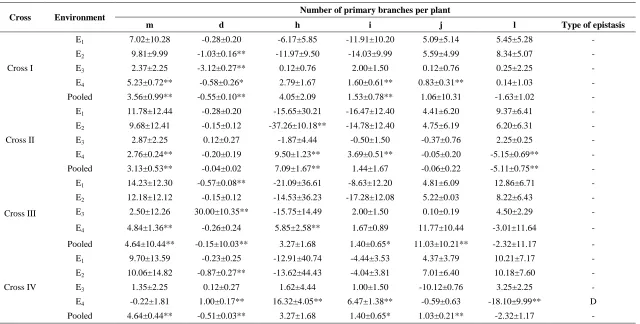
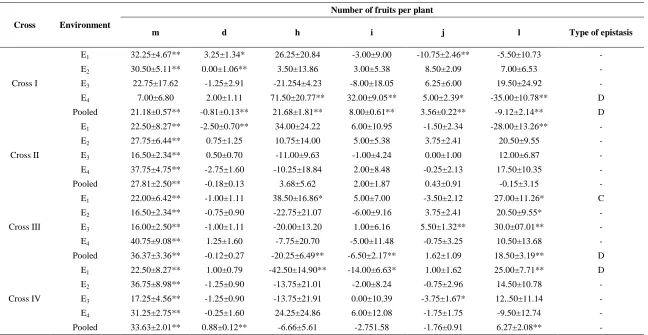
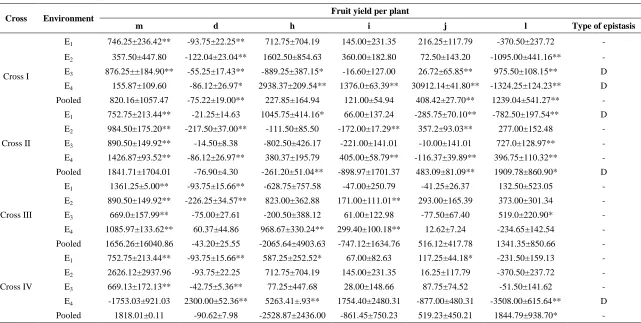
Additive effect played a decisive role in the inheritance of number of primary branches per plant, days from flowering to fruit setting, number of fruiting clusters per plant, number of fruits per plant and fruit yield per plant in almost all the crosses (Table 1 and 2). Thus improvement in yield could be brought through indirect selection of these characters in the early generations. Additive x additive interaction effect was found to play a paramount role in controlling days to flowering and number of fruiting clusters per plant. Dominance effect was found significant in two to three crosses for days to flowering, fruiting clusters per plant and fruit yield per plant in two or more crosses. Besides dominance x dominance type of gene interaction was also found important for days to flowering and number of fruiting clusters per plant suggesting the scope of heterosis breeding in developing superior populations. Recurrent selection and biparental mating could be effective for characters governed by and consistent for both additive and non additive genetic variance like days to flowering, days to fruit maturity, days from flowering to fruit setting, flower shed percentage, number of fruiting clusters per plant, number of fruits per plant and fruit yield per plant in two to more crosses.
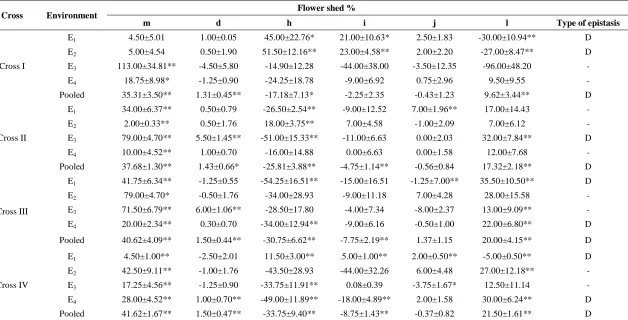
In a study (Chahal et al., 1991) it was observed that (h) and (l) were the only components which can safely be used to determine the type of influence epistasis may have on the observed performance of the generations. The dominance (h) and dominance x dominance (l) interaction effects were in opposite direction, suggesting the presence of duplicate epistasis for most of the characters in most of the crosses under study including fruit yield per plant. The phenomenon of duplicate epistasis is unfavourable from the breeder’s point of view because of its decreasing effect on the analyzed trait (Zdravkovic et al., 2000). Duplicate epistasis in yield inheritance was reported by some workers (Zdravkovic et al., 2011; Dhaliwal and. Nandpuri, 1988). However, for days to fruit maturity, number of fruiting clusters per plant, fruit yield per plant (h) and (l) exhibited same sign thus reinforcing each other signifying complementary epistasis for one to two crosses in individual environments.
ISSN 0975-928X
mating and selection are likely to result faster rate of genetic improvement. To improve upon the characters, where pronounced dominant effects are principally involved, selection of desired plants from segregating generations would help in effectively synthesizing desirable high yielding genotypes.
References
Anonymous Cavalli, L. 1952. An analysis of linkages of quantities inheritance. In E.C.R. Reive, & C.H. Waddington (Eds.). London: HMSO. pp. 135-144.
Chahal, G.S., Singh, T.H. and Virk, D.S. 1991. Measurement and utilization of non-allelic interactions in plant breeding. The Crop Improve. Soc. Of India, pp.5- 63. Johi Printers, Ludhiana.
Dhaliwal, M.S. and. Nandpuri, K.S. 1988. Genetics of yield and its components in tomato. Ann. Biol.,4: 75-80.
Dhall, R.K. and Singh, P. 2013. Effect of ethephon and ethylene gas on ripening and quality of tomato (Solanum lycopersicum L.) during cold storage.
J. Nutrn. Food Sci., 3: 244.
Hayman, B.I. and Mather, K.1955. The description of genetics of interaction of continuous variation.
Biometrics, 51: 69-82.
Hayman, B.I. 1958. The separation of epistatic from additive and dominance variation in generation means. Heredity, 12: 371-390.
Jinks, J.L. and Jones, R.M.1958. Estimation of components of heterosis. Genetics, 43: 223-234. Johnson, S.P. and Hall, W.C. 1953. Vegetative and
fruiting response of tomatoes to high temperature and light intensity. Bet. Gaz.,114: 449-460. Mather, K. 1949. In Biometrical genetics- the study of
continuous variation.pp. 192. Methuen and Co. Ltd., London.
Rick, C.M.1965. Cytogenetics of the tomato. Adv. in Genet., 8:267-382.
Singh, R.P., Vara Prasad P.V., Sunita, K., Giri S.N. and Reddy, K.R. 2007. Influence of high temperature and breeding for heat tolerance in cotton. Adv.
Agron.,93: 313–385.
Villareal, R.L. and Lai, S.H. 1979. Development of heat tolerant varieties in the tropics. In 1st Intl. Symp. Tropical Tomato. W.R. Cowel (ed.). Asian Vegetable Research and Development Centre (AVRDC), Shanhua, Tainan, Taiwan, (R.O.C). pp.290.
Zdravkovic, J., Pavlonic, N., Girek, Z., Zokonovic, M.B., Savic, B., Zdrakovic, M. and Civik, D. 2011.Generation mean analysis of yield and its components in tomato (Lycopersicon esculentum
Mill). Pak. J. Bot.,43(3):1575-1580.
Zdravkovic, J., Pavlonic, N., Girek, Z., Zokonovic, M.B., Savic, B., Zdrakovic, M. and Civik, D. 2000. Epistatic gene effects on yield of the parents of F1, F2, BC1 and BC2 progeny. Acta
Table 1. Estimates of six parameter model for yield and yield attributing characters of four tomato crosses in individual environments and pooled over environments
Cross Environment Days to flowering
m d h i j l Type of epistasis
Cross I
E1 40.75±4.50** 1.25±0.55* -17.55±14.80 -6.00±6.33 -1.25±1.52 10.50±7.43 -
E2 393.77±10.33** 2.00±1.11 -35.50±10.07** -10.00±3.16** -2.00±1.93 27.0±3.50** D
E3 55.7±8.29** -3.75±0.90** -63.25±15.88** -8.00±6.00 3.75±2.41 47.50±9.39** D
E4 54.00±4.48** 0.50±0.35 -43.50±11.80** -15.00±4.89** -2.00±1.45 23.0±06.51** D
Pooled 41.10±12.58 0.31±0.45 -21.4±4.42** -3.25±1.43* 1.81±0.81* 14.62±2.99** D
Cross II
E1 31.25±5.08** -3.25±0.90** -20.75±13.75 5.00±5.38 -1.25±2.01 0.50±6.44 -
E2 32.25±3.75** -1.25±1.03 -13.25±10.76 -4.00±3.74 -.075±1.88 7.50±3.93 -
E3 46.50±2.47** 4.00±1.06** -33.50±13.15** 11.11±6.16 -3.50±1.27 20.00±6.98** D
E4 40.25±6.73** 0.25±0.55 -14.25±15.20 -2.00±5.83 1.75±2.19 7.50±8.03 -
Pooled 44.31±1.12** 0.43±0.13** -28.68±2.39** -6.50±0.86** -1.43±0.38** 16.6±21.28** D
Cross III
E1 26.75±4.56** -1.75±0.90 13.75±15.07 10.00±6.63 3.75±1.67 -8.50±8.50 -
E2 46.50±2.47** -7.25±1.03** 3.251±4.12 1.00±6.40 0.75±1.52 -5.50±7.01 -
E3 47.25±2.41** 6.25±0.90** -35.75±9.50** -2.00±4.24 -6.25±1.14** 26.50±5.24** D
E4 42.50±6.73** 10.00±0.79** -15.00±5.08** -4.00±1.41** -3.00±1.06** 4.00±3.96 -
Pooled 37.18±1.35** 1.06±0.13** -12.43±4.13** 2.00±1.36 -2.56±0.65** 6.62±2.45** D
Cross IV
E1 31.25±5.08** -0.50±1.11 13.50±15.40** -30.00±5.83** 20.50±2.39** 77.00±7.95** C
E2 28.50±3.04** -2.501±.11** 0.50±14.18 1.00±6.40 2.00±1.58 -5.00±7.07 -
E3 48.25±2.41** 5.25±0.90** -38.75±9.50** -2.00±4.24 -5.25±1.14** 28.50±5.24** D
E4 58.00±6.71** -0.50±0.35 -56.00±15.10** -19.00±5.83** -2.00±2.15 32.00±7.66** D
ISSN 0975-928X
Table 1. Contd.,
Cross Environment Days to fruit maturity
m d h i j l Type of epistasis
Cross I
E1 96.50±4.15** 11.50±2.06** 69.00±18.56** 16.00±6.78** -9.50±2.59** -62.00±18.66 -
E2 92.00±16.17** 8.50±1.24** 4.00±2.65 -1.00±17.57 -16.00±5.46 -6.00±20.74 D
E3 123.00±12.92** 12.50±1.76** -28.50±38.44 -8.00±14.69 -17.50±5.66 23.00±15.04 D
E4 76.50±6.86** 2.00±1.45 74.50±20.93** 39.00±9.05** 0.50±2.57 -35.00±10.71** C
Pooled 76.50±6.86** 2.00±1.45 74.50±20.93** 39.00±9.05** 0.50±2.57 -35.00±10.71** C
Cross II
E1 273.00±49.73** -13.50±7.61 -467.50±95.30** -160.00±30.66** 99.50±17.11** -62.00±18.66** C
E2 54.50±11.34 -8.00±0.79 71.00±36.24 36.00±14.96 -2.00±4.54 -32.00±16.59 -
E3 101.25±1.95** -8.75±1.95** 30.25±17.06 10.00±8.00 3.75±1.95 -5.50±9.12 -
E4 102.25±6.82** -3.75±1.25** 16.25±20.81 15.00±9.05 6.25±2.46* 2.50±10.60 -
Pooled 93.93±11.72** -7.93±1.46** -7.350±6.32 11.75±7.26 5.31±3.40 -23.07±16.22
Cross III
E1 118.00±6.80** -11.00±1.11** 31.00±13.23 -6.00±18.25 9.00±2.39** -2.00±6.89 -
E2 101.25±1.95** -4.00±0.79** 3.00±18.48 12.00±7.48 3.00±2.37 6.00±12.34 -
E3 126.50±11.27** -13.00±1.45** -42.00±35.43 -11.00±15.68 5.50±3.82 44.44±17.88* -
E4 121.25±11.38** -3.75±0.13** -50.75±25.22 -4.00±9.27 3.75±4.13 50.50±12.82**
Pooled 105.87±15.14** -6.62±2.85* -6.62±2.85 -1.50±9.21 5.87±5.41 22.50±19.68 D
Cross IV
E1 273.00±49.73** -13.50±1.11** -21.00±27.28 -11.00±10.81 -2.00±6.89 16.00±16.34 -
E2 151.0±07.25** 4.50±0.79** -161.00±22.08** -73.00±9.43** -5.00±2.62** 86.00±10.51** D
E3 120.00±22.43** -13.50±1.76** -22.00±53.55 -4.00±21.35 3.50±7.28 28.00±27.52 -
E4 114.00±11.23** -2.50±1.06* -30.50±29.36 2.00±12.24 3.50±3.69 35.00±14.82 -
Pooled 120.81±17.63** -3.56±3.85 -3.56±3.85 -27.50±12.21 3.06±7.21 45.37±20.18* -
Table 1. Contd.,
Cross Environment Days from flowering to fruit setting
m d h i j l Type of epistasis
Cross I
E1 14.5±2.03** 1.00±0.35* -11.00±5.13* -3.00±2.33 0.50±0.61 10.00±3.08** D
E2 12.25±2.88** 1.25±0.55** -6.75±6.98 1.00±2.23 -0.75±1.25 8.50±3.20** -
E3 15.50±2.26** 1.00±0.35** -14.00±5.94* 1.00±1.50 1.00±0.79 12.00±3.12** D
E4 12.75±4.50** 0.75±0.55 -7.75±8.66 1.00±2.52 -0.75±1.52 4.00±4.38 -
Pooled 12.00±14.87 -1.50±0.50** -33.00±28.60 1.00±0.12 2.50±1.19* 14.00±6.37 -
Cross II
E1 12.75±2.88** -1.25±0.55** -10.75±8.00 -1.00±3.00 1.75±1.25 -1.50±3.35 -
E2 12.25±4.16** 3.75±0.55** -4.25±8.00 -1.00±3.00 0.75±1.25 1.50±4.74 -
E3 6.00±2.37* -0.50±0.79 9.00±10.98 5.00±6.16 1.00±1.06 -4.00±6.83 -
E4 10.25±2.30** 3.45±0.51** 1.75±6.08 11.00±2.44 -2.25±0.90 -2.50±3.24 -
Pooled 8.37±0.83** 0.12±0.45 4.62±2.49 2.75±0.75** 0.75±0.53 -2.75±1.90 -
Cross III
E1 6.00±4.14 -0.50±0.79 9.00±13.90 5.00±6.40 1.00±1.36 -8.00±7.66 -
E2 6.00±2.37** 4.25±0.55** 1.25±2.49 1.00±4.12 -1.75±2.13 -1.50±3.20 -
E3 9.57±2.30** -1.25±0.55* 5.25±9.22 2.00±4.24 1.25±0.90 -5.50±4.74 -
E4 7.75±2.30** 0.25±0.55 10.25±4.58* 4.00±1.41** 3.25±0.90** -7.50±2.54** D
Pooled 20.50±1.31** 0.50±0.39 -27.50±3.15** -8.75±1.03** -6.12±0.89** 1.70±1.73** D Cross IV
E1 12.75±2.88* -0.75±0.25** 2.75±10.47 1.00±4.58 2.25±1.14 -2.50±5.78 -
E2 7.50±2.34** 0.50±0.70 7.00±6.22 4.00±2.44 1.50±1.00 -2.00±3.35 -
E3 12.25±2.25** -0.75±0.25** -1.25±2.90 -1.00±2.44 2.25±0.75* -4.50±3.08 -
E4 7.50±2.34** 2.50±0.70** 7.00±3.22* 4.00±2.44 1.50±1.00 -2.00±3.25 -
Pooled 8.87±1.48** -1.12±0.45* 4.86±3.75 2.50±1.22* 1.87±0.71** -2.23±1.52 -
ISSN 0975-928X
Table 1. Contd.,
Cross Environment
Number of fruiting clusters per plant
Type pf epistasis
m (d) (h) i j l
Cross I
E1 14.50±4.00** 1.50±0.99 -7.00±.22 -6.002.82** 0.5001.00 -13.002.87 -
E2 6.25±2.88* 1.75±0.55** 3.75±8.00 3.00±3.00 -1.25±1.25 1.50±3.35 -
E3 13.75±4.00** 0.75±0.25** -4.75±7.26 -6.00±2.82 1.25±1.03** 0.50±4.60 -
E4 17.00±0.35** 0.50±0.35 -15.50±4.16** -9.00±2.00** 0.00±0.35 9.00±2.34** D
Pooled 13.14±1.03** -1.11±0.01** -6.67±1.96** -4.75±0.75** -0.007±0.27 3.78±1.23 -
Cross II
E1 4.50±2.23* -1.5±0.02** 18.50±5.83** 4.00±2.44 -0.500±0.70 -13.00±2.87** D
E2 14.50±2.26** -1.00±0.35** -8.00±5.94 -6.00±2.44 2.00±0.79* 4.00±3.12 -
E3 5.25±2.25* -1.25±0.25** 14.75±4.33** 3.00±1.41* -0.25±0.75 -10.50±2.34** D
E4 5.50±2.26* -1.00±0.35** -14.00±4.40** 3.00±1.41 -0.50±0.79 -10.00±2.39** C
Pooled 9.06±1.13** 0.30±0.18** 4.67±3.30 0.75±1.14 -1.18±0.54 -4.11±0.97 -
Cross III
E1 5.51±2.23* -2.50±0.25** 14.50±4.24** 4.00±1.41** 3.50±0.70** -11.00±2.06** D
E2 9.00±2.26** -1.50±0.35** -0.50±5.94 0.00±2.44 3.50±0.79** 4.00±3.12 -
E3 4.00±2.29 -1.00±0.50* 21.00±6.10** 4.00±2.44 -1.00±0.86 -16.00±3.64** D
E4 4.00±2.26 -0.50±0.35 19.00±6.01 4.00±2.44** -1.50±0.79 -12.00±3.57** -
Pooled 6.50±2.07** -0.005±0.25** 11.11±3.58** 3.00±1.22** -0.99±0.61 -7.24±2.15** D
Cross IV
E1 4.50±2.23** -4.25±1.34** 16.25±18.48 13.00±6.70 0.75±3.01 -3.50±11.19 -
E2 7.50±1.06** -1.00±0.35** 4.00±5.13 1.00±2.23 0.50±0.61 0.00±2.39 -
E3 3.75±2.25 -1.75±0.25** 13.75±4.30** 5.00±1.41** 1.25±0.75 -6.50±2.12** D
E4 6.00±2.26** -1.50±0.35** 9.00±5.92 3.00±2.44 1.00±0.79 -4.00±2.95 -
Pooled 6.01±0.54** 0.55±0.18** 7.32±1.89** 4.05±0.70** -1.28±0.31 2.21±0.72** C
Table 1. Contd.,
Cross Environment Number of primary branches per plant
m d h i j l Type of epistasis
Cross I
E1 7.02±10.28 -0.28±0.20 -6.17±5.85 -11.91±10.20 5.09±5.14 5.45±5.28 -
E2 9.81±9.99 -1.03±0.16** -11.97±9.50 -14.03±9.99 5.59±4.99 8.34±5.07 -
E3 2.37±2.25 -3.12±0.27** 0.12±0.76 2.00±1.50 0.12±0.76 0.25±2.25 -
E4 5.23±0.72** -0.58±0.26* 2.79±1.67 1.60±0.61** 0.83±0.31** 0.14±1.03 -
Pooled 3.56±0.99** -0.55±0.10** 4.05±2.09 1.53±0.78** 1.06±10.31 -1.63±1.02 -
Cross II
E1 11.78±12.44 -0.28±0.20 -15.65±30.21 -16.47±12.40 4.41±6.20 9.37±6.41 -
E2 9.68±12.41 -0.15±0.12 -37.26±10.18** -14.78±12.40 4.75±6.19 6.20±6.31 -
E3 2.87±2.25 0.12±0.27 -1.87±4.44 -0.50±1.50 -0.37±0.76 2.25±0.25 -
E4 2.76±0.24** -0.20±0.19 9.50±1.23** 3.69±0.51** -0.05±0.20 -5.15±0.69** -
Pooled 3.13±0.53** -0.04±0.02 7.09±1.67** 1.44±1.67 -0.06±0.22 -5.11±0.75** -
Cross III
E1 14.23±12.30 -0.57±0.08** -21.09±36.61 -8.63±12.20 4.81±6.09 12.86±6.71 -
E2 12.18±12.12 -0.15±0.12 -14.53±36.23 -17.28±12.08 5.22±0.03 8.22±6.43 -
E3 2.50±12.26 30.00±10.35** -15.75±14.49 2.00±1.50 0.10±0.19 4.50±2.29 -
E4 4.84±1.36** -0.26±0.24 5.85±2.58** 1.67±0.89 11.77±10.44 -3.01±11.64 -
Pooled 4.64±10.44** -0.15±10.03** 3.27±1.68 1.40±0.65* 11.03±10.21** -2.32±11.17 -
Cross IV
E1 9.70±13.59 -0.23±0.25 -12.91±40.74 -4.44±3.53 4.37±3.79 10.21±7.17 -
E2 10.06±14.82 -0.87±0.27** -13.62±44.43 -4.04±3.81 7.01±6.40 10.18±7.60 -
E3 1.35±2.25 0.12±0.27 1.62±4.44 1.00±1.50 -10.12±0.76 3.25±2.25 -
E4 -0.22±1.81 1.00±0.17** 16.32±4.05** 6.47±1.38** -0.59±0.63 -18.10±9.99** D
Pooled 4.64±0.44** -0.51±0.03** 3.27±1.68 1.40±0.65* 1.03±0.21** -2.32±1.17 -
ISSN 0975-928X
Table 1. Contd.,
Cross Environment Flower shed %
m d h i j l Type of epistasis
Cross I
E1 4.50±5.01 1.00±0.05 45.00±22.76* 21.00±10.63* 2.50±1.83 -30.00±10.94** D
E2 5.00±4.54 0.50±1.90 51.50±12.16** 23.00±4.58** 2.00±2.20 -27.00±8.47** D
E3 113.00±34.81** -4.50±5.80 -14.90±12.28 -44.00±38.00 -3.50±12.35 -96.00±48.20 -
E4 18.75±8.98* -1.25±0.90 -24.25±18.78 -9.00±6.92 0.75±2.96 9.50±9.55 -
Pooled 35.31±3.50** 1.31±0.45** -17.18±7.13* -2.25±2.35 -0.43±1.23 9.62±3.44** D
Cross II
E1 34.00±6.37** 0.50±0.79 -26.50±2.54** -9.00±12.52 7.00±1.96** 17.00±14.43 -
E2 2.00±0.33** 0.50±1.76 18.00±3.75** 7.00±4.58 -1.00±2.09 7.00±6.12 -
E3 79.00±4.70** 5.50±1.45** -51.00±15.33** -11.00±6.63 0.00±2.03 32.00±7.84** D
E4 10.00±4.52** 1.00±0.70 -16.00±14.88 0.00±6.63 0.00±1.58 12.00±7.68 -
Pooled 37.68±1.30** 1.43±0.66* -25.81±3.88** -4.75±1.14** -0.56±0.84 17.32±2.18** D
Cross III
E1 41.75±6.34** -1.25±0.55 -54.25±16.51** -15.00±16.51 -1.25±7.00** 35.50±10.50** D
E2 79.00±4.70* -0.50±1.76 -34.00±28.93 -9.00±11.18 7.00±4.28 28.00±15.58 -
E3 71.50±6.79** 6.00±1.06** -28.50±17.80 -4.00±7.34 -8.00±2.37 13.00±9.09** -
E4 20.00±2.34** 0.30±0.70 -34.00±12.94** -9.00±6.16 -0.50±1.00 22.00±6.80** D
Pooled 40.62±4.09** 1.50±0.44** -30.75±6.62** -7.75±2.19** 1.37±1.15 20.00±4.15** D
Cross IV
E1 4.50±1.00** -2.50±2.01 11.50±3.00** 5.00±1.00** 2.00±0.50** -5.00±0.50** D
E2 42.50±9.11** -1.00±1.76 -43.50±28.93 -44.00±32.26 6.00±4.48 27.00±12.18** -
E3 17.25±4.56** -1.25±0.90 -33.75±11.91** 0.08±0.39 -3.75±1.67* 12.50±11.14 -
E4 28.00±4.52** 1.00±0.70** -49.00±11.89** -18.00±4.89** 2.00±1.58 30.00±6.24** D
Table 1. Contd.,
Cross Environment
Number of fruits per plant
m d h i j l Type of epistasis
Cross I
E1 32.25±4.67** 3.25±1.34* 26.25±20.84 -3.00±9.00 -10.75±2.46** -5.50±10.73 -
E2 30.50±5.11** 0.00±1.06** 3.50±13.86 3.00±5.38 8.50±2.09 7.00±6.53 -
E3 22.75±17.62 -1.25±2.91 -21.254±4.23 -8.00±18.05 6.25±6.00 19.50±24.92 -
E4 7.00±6.80 2.00±1.11 71.50±20.77** 32.00±9.05** 5.00±2.39* -35.00±10.78** D
Pooled 21.18±0.57** -0.81±0.13** 21.68±1.81** 8.00±0.61** 3.56±0.22** -9.12±2.14** D
Cross II
E1 22.50±8.27** -2.50±0.70** 34.00±24.22 6.00±10.95 -1.50±2.34 -28.00±13.26** -
E2 27.75±6.44** 0.75±1.25 10.75±14.00 5.00±5.38 3.75±2.41 20.50±9.55 -
E3 16.50±2.34** 0.50±0.70 -11.00±9.63 -1.00±4.24 0.00±1.00 12.00±6.87 -
E4 37.75±4.75** -2.75±1.60 -10.25±18.84 2.00±8.48 -0.25±2.13 17.50±10.35 -
Pooled 27.81±2.50** -0.18±0.13 3.68±5.62 2.00±1.87 0.43±0.91 -0.15±3.15 -
Cross III
E1 22.00±6.42** -1.00±1.11 38.50±16.86* 5.00±7.00 -3.50±2.12 27.00±11.26* C
E2 16.50±2.34** -0.75±0.90 -22.75±21.07 -6.00±9.16 3.75±2.41 20.50±9.55* -
E3 16.00±2.50** -1.00±1.11 -20.00±13.20 1.00±6.16 5.50±1.32** 30.0±07.01** -
E4 40.75±9.08** 1.25±1.60 -7.75±20.70 -5.00±11.48 -0.75±3.25 10.50±13.68 -
Pooled 36.37±3.36** -0.12±0.27 -20.25±6.49** -6.50±2.17** 1.62±1.09 18.50±3.19** D
Cross IV
E1 22.50±8.27** 1.00±0.79 -42.50±14.90** -14.00±6.63* 1.00±1.62 25.00±7.71** D
E2 36.75±8.98** -1.25±0.90 -13.75±21.01 -2.00±8.24 -0.75±2.96 14.50±10.78 -
E3 17.25±4.56** -1.25±0.90 -13.75±21.91 0.00±10.39 -3.75±1.67* 12..50±11.14 -
E4 31.25±2.75** -0.25±1.60 24.25±24.86 6.00±12.08 -1.75±1.75 -9.50±12.74 -
Pooled 33.63±2.01** 0.88±0.12** -6.66±5.61 -2.751.58 -1.76±0.91 6.27±2.08** -
ISSN 0975-928X
Table 1. Contd.,
Cross Environment Fruit yield per plant
m d h i j l Type of epistasis
Cross I
E1 746.25±236.42** -93.75±22.25** 712.75±704.19 145.00±231.35 216.25±117.79 -370.50±237.72 -
E2 357.50±447.80 -122.04±23.04** 1602.50±854.63 360.00±182.80 72.50±143.20 -1095.00±441.16** -
E3 876.25±±184.90** -55.25±17.43** -889.25±387.15* -16.60±127.00 26.72±65.85** 975.50±108.15** D
E4 155.87±109.60 -86.12±26.97* 2938.37±209.54** 1376.0±63.39** 30912.14±41.80** -1324.25±124.23** D
Pooled 820.16±1057.47 -75.22±19.00** 227.85±164.94 121.00±54.94 408.42±27.70** 1239.04±541.27** -
Cross II
E1 752.75±213.44** -21.25±14.63 1045.75±414.16* 66.00±137.24 -285.75±70.10** -782.50±197.54** D
E2 984.50±175.20** -217.50±37.00** -111.50±85.50 -172.00±17.29** 357.2±93.03** 277.00±152.48 -
E3 890.50±149.92** -14.50±8.38 -802.50±426.17 -221.00±141.01 -10.00±141.01 727.0±128.97** -
E4 1426.87±93.52** -86.12±26.97** 380.37±195.79 405.00±58.79** -116.37±39.89** 396.75±110.32** -
Pooled 1841.71±1704.01 -76.90±4.30 -261.20±51.04** -898.97±1701.37 483.09±81.09** 1909.78±860.90* D
Cross III
E1 1361.25±5.00** -93.75±15.66** -628.75±757.58 -47.00±250.79 -41.25±26.37 132.50±523.05 -
E2 890.50±149.92** -226.25±34.57** 823.00±362.88 171.00±111.01** 293.00±165.39 373.00±301.34 -
E3 669.0±157.99** -75.00±27.61 -200.50±388.12 61.00±122.98 -77.50±67.40 519.0±220.90* -
E4 1085.97±133.62** 60.37±44.86 968.67±330.24** 299.40±100.18** 12.62±7.24 -234.65±142.54 -
Pooled 1656.26±16040.86 -43.20±25.55 -2065.64±4903.63 -747.12±1634.76 516.12±417.78 1341.35±850.66 -
Cross IV
E1 752.75±213.44** -93.75±15.66** 587.25±252.52* 67.00±82.63 117.25±44.18* -231.50±159.13 -
E2 2626.12±2937.96 -93.75±22.25 712.75±704.19 145.00±231.35 16.25±117.79 -370.50±237.72 -
E3 669.13±172.13** -42.75±5.36** 77.25±447.68 28.00±148.66 87.75±74.52 -51.50±141.62 -
E4 -1753.03±921.03 2300.00±52.36** 5263.41±.93** 1754.40±2480.31 -877.00±480.31 -3508.00±615.64** D
Table 2. Regression coefficients of components of generation mean on environmental indices for yield and yield attributing characters
Characters
Regression coefficients of six parameters (bC)
Cross I (H7997 x CLN 1621E)
Cross II (H7997 x BL 337)
Cross III (H7997 x Nagcarlan)
Cross IV (H7997 x CLN 2366A)
Days to flowering
m 1.70** 1.28 1.93 2.51*
d -0.11 0.17 0.29 0.03
h -2.40** -0.46 1.11 -7.55**
i -0.19 0.15 0.31 -0.93
j 0.42 -0.13 -0.61 -0.57
l 2.31** 1.21 1.34 -7.83**
Days to fruit maturity
m 6.67** 4.26** 5.43** -3.52**
d -1.44 0.90 0.50 1.37
h 7.24** -34.08** 0.31 -6.52**
i 0.50 -4.95** -0.19 -0.34
j -0.91 0.49 0.23 0.97
l 5.09** -33.21** 2.02** 5.42**
Number of primary branches
per plant
m -0.70** -0.70** -0.93** -0.96**
d -0.05 0.02 0.05 -0.03
h -0.82** -1.46** -1.99** -1.37**
i -0.06 -0.20 -0.27 -0.14
j -0.55** -0.52** -0.52** -0.55**
l 0.03 -0.49** -0.75** -0.35**
Days from flowering to fruit
setting
m -0.43 -0.24** -0.19** 0.36**
d -0.03 0.15** 0.03 0.09*
h -1.01** -0.26** 0.70** 0.42**
i -0.09* -0.03 0.15** 0.03
j 0.13** 0.01 0.18** 0.06
l -0.59** 0.10** 0.15** 0.11**
Number of fruiting clusters
per plant
m 0.92** -1.00** -0.54** -0.33**
d -0.01 0.05 0.13 -0.13
h -0.40** 1.10** 1.04** 0.94**
i -0.19 0.12 0.12 0.09
j 0.21 0.16 -0.48** 0.06
l 1.53** 0.79** -0.11 0.58**
Flower shed percentage
m 1.06** 4.06** 2.02** -2.46**
d 4.06** 3.15** 4.28** 3.16**
h 4.88** -1.69 -5.02** -0.51
i 3.65** -2.28* -3.46** 3.05*
j -0.09 0.14 -1.36 -0.37
l 1.29** -0.85 -1.40 2.90**
Number of fruits per plant
m -1.29** -0.54 -1.84** -1.59**
d -0.39 0.34 0.02 -0.24
h 0.57** 2.82** 2.11** -3.53**
i -0.09 0.19 0.15 -0.43
j -0.36 -0.42 -0.04 -0.24
l 1.71** 3.08** 5.35** -1.26**