~ 91 ~ WWJMRD 2018; 4(12): 91-95
www.wwjmrd.com International Journal Peer Reviewed Journal Refereed Journal Indexed Journal
Impact Factor MJIF: 4.25 E-ISSN: 2454-6615
H.Santhi
School of Computer Science and Engineering, Vellore Institute of Technology, Vellore, Tamil Nadu, India
Gopichand G
School of Computer Science and Engineering, Vellore Institute of Technology, Vellore, Tamil Nadu, India
P. Gayathri
School of Computer Science and Engineering, Vellore Institute of Technology, Vellore, Tamil Nadu, India
B Rupa Devi
Department of Computer Science and Engineering, Annamacharya, Institute of Technology and Sciences, Tirupati, India
Geraldine Bessie Amali D School of Computer Science and Engineering, Vellore Institute of Technology, Vellore, Tamil Nadu, India
Correspondence: H.Santhi
School of Computer Science and Engineering, Vellore Institute of Technology, Vellore, Tamil Nadu, India
A Review on Supervised Image Classification
H.Santhi, Gopichand G, P. Gayathri, B Rupa Devi, Geraldine Bessie
Amali D
Abstract
Image Classificationis a part of machine learning and also major topic in image classification task and it helps to classify images with the help of data we extracted from other images. The fundamental aim of arrangement process is to sort all pixels in a computerized picture into a few classes. The main objective is to identify the image and to portray, and to get the data i.e. Grey (or color) values and extraction of feature for future classification of images by creating more classes, which can be used to create a signature file. Using “Supervised Image Classification” (One of the types of Image
Classification) and a set of images, we will take some of the random pixels from images into training set and will train the machine using any one of the classifier (Ex: C-Classifier) and will take remaining pixels into the test set and test the classification done by the machine to check whether it can classify images by the given data or not.
Keywords: classification, SVM, segmentation, processing, supervised, classifier
Introduction
Our project is mainly concentrated on the area of “Image classification” in “Image processing”. This whole thing is the part of machine learning, in which we will train the computer to do the works given.
Image classification
By training the computer, then making the computer to classify the given image into the specified classes by certain properties of the image given and the training set we used to train.
Types of Image classification based on the no of classes will get in output:
Binary classification
If the image classification is done to get only two classes like earth and water in satellite images, then that classification is called “Binary classification”.
Multi classification
If the output image gives you the classified image with more than two classes, then it is called “Multi classification”.
Types of Image classification based on the method:
A. Supervised image classification
This is the mostly used classification type, in which we will give the training set to the computer (i.e. some test images) to create a classifier.
B. Unsupervised classification
This method will give the output, without giving any samples cases or images and it will give the classified image as the output by following the spectral based classification, in which makes sure to be different classes will have well separated pixels
C. Semi supervised classification
His is the classification type, in which the given image will be classified by training we have given based on the unlabeled and labeled data (which includes maximum percentage of unlabeled data).
By knowing the advantages of using the “Supervised image classification”, we are using this method for the classification done on the project. We have chosen “SVM (support vector machine)” technique to classify the images in the processing because, in “SVM” technique we have multi classifying and the advantages like using hyper planes, mapping by graph portion technique, too.
Literature Survey
The technique called BPNN (Back Propagation Neural Networks) And Maximum Likelihood has an advantages like easy for implementing, scales very well to large dataset and will show more efficiency than other models when the conditions are right and the disadvantages like require time consuming and costly training and for network architecture sometimes hard to find the best network [8]. For the technique called Compression of binary tree multi-class classification and Mapping by graph portion technique had an advantages like It has improved decision algorithm, which makes the decision faster, more accurate and evaluation is simpler and disadvantages like the order of the list is not specified and every different order can produce different results [9].
Hyper planes on Hyperspace, Multi-class classifying technique has advantages like it has a regularization parameter and avoid over-fitting, no local minima and approximation to a bound-on test error rate and the disadvantages like its hard to choose appropriate kernel function and it’s very painful and inefficient for training [10]. Fuzzy Decision Tree (FDT) and stochastic approach has an advantages like it will display the range of possible outcomes and subsequent decisions made after initial decision and disadvantages like it does not require training, so prior knowledge about the desired area required [11]. This Content based image retrieval approach, Semi BMMA forming approach has an advantages like it will remove the over fitting problem of the labeled samples, form RF by combining unlabeled samples has the disadvantages like its
main disadvantage is it suffers with the global maximum [12].
Picture as gathering of unordered appearance descriptors removed from nearby fixes, quantized into discrete "visual words" to compute a minimized histogram. Likewise, called as Bag of Features (BOF) show has the advantages like it disposes of the spatial request of nearby descriptors, which extremely restricts the unmistakable energy of the picture portrayal the disadvantages like The customary approach in view of Bag of Features (BOF) requires
nonlinear classifiers to accomplish great picture
characterization execution which can't be trusted [13].
Deep Learning uses computational models, with
hierarchical architectures composed by multiple processing layers, to learn representations of images has advantages like the increased chip processing abilities, the decrease of cost of computing hardware and the advances in the machine learning algorithms make this a much feasible option has disadvantages like as it requires the machine to be trained to detect and classify the image, it is too complex and too time consuming [14].
Characterization needs information to be prepared and to distinguish later on. The cross-approval is a method for assessing the aftereffects of a measurable examination creating an autonomous dataset has an advantages like in K-fold cross validation the sample is partitioned to k subsets where one is used for validation and the rest are used for training, so as the machine better understands and classifies the image has the disadvantages like Here as e split the image into its subsets, we need enormous storage to store all the data accumulated for a single image (i.e., almost k time the original size) and also as K-1 subsets are needed, they take a large time for identification [15]. Utilizing groups of randomized progressive deteriorations of the first issue can both enhance the exactness and diminish the computational multifaceted nature at test time for ID and arrangement has advantages like with this approach, computational many-sided quality at test time is direct in the quantity of classes, which might be a bottleneck with substantial numbers has disadvantages like in any case, these techniques as a rule come at the cost of a more unpredictable preparing methodology or a misfortune in exactness [16]. This another technique comprises of 3 sections: Partitioning the hubs, locate the terminal hubs and designation of class mark to terminal hubs has the advantages like its various leveled classifier allows the approvals and dismissal of class names at every middle person organize has the disadvantages like as this technique utilizes 'Rehashed Partitioning' it expends a great deal of time and storage room because of recursive calls [17].
Methodology
~ 93 ~
The steps of methodology
Pre-image processing
Image pre-processing is the process is producing a smooth pre analyzed approximation data, which can be used for the subsequent classification and also performance the discontinuity of the data. In this feature extraction, also the main part, which will be having numerical based data (i.e. RGB values per pixel or Grey Level?)
Image segmentation
This is a process in which will be used as the pre-processing for the classification, as this will increase and speed of classification and also reduces the noise. This will identify the segments based on the present data (currently) on a region growing and merging algorithm. This result may be used in their own.
Image processing
This will create a signature file for the image using a cluster algorithm (for Unsupervised Classification) and also create a signature file from the data we get from the image pre-processing image features extracted (i.e. will be divided into the classes).
Image classification
This will be selecting the type of classification depending on the process, which we went through in the last steps and processing through that classification (typically supervised or unsupervised image classification).
Fig.2: The steps involved in supervised image classification
SVM technique of classification:
Take some images into the data set.
Get the pixels from the images into a data frame.
Convert the given pixels into RGB values
By using some random pixels create a training set data
frame
Using that training set data frame and the variable make SVM classifier, using the Histograms of the given images.
Using that remaining pixels make a data frame and
test the classifier
Steps involved in the procedure for the project:
Copy the required images of Google earth satellite images into the “data\myImages” folder, which will work as the positive training examples.
We have to run the classification_code file.
This time we have to take some random pixels from the training set to give input to the classifier...
It will calculate the classification model for the image after a while of computing.
The test data contains remaining random pixels from
the images; our goal is to get the pipelines in the taken set of images with the maximum possible accuracy.
Implementation
We have to take some Google earth satellite images into the data set and convert the taken images into the data frame of two type’s pipeline and non-pipeline data frames.
We have to train the system with the taken earth satellite images and we have to cretate the SVM classifier model of the taken images, in which the properties of images and its relationship with the parts of image (which means the meaning of the image parts) will be stored.
We have to apply the model on the random pixels taken from the set of images we have as data frames.
We will get the classified image as an output if we applied the same SVM model on any of the images, which fit for the model.
Precision for output images can be find by:
Fig.3: Formula to find the precision of the output image
The block diagram of the space and set of the output:
Implementation Code is written using the ‘R’ language in ‘rStudio’ using packages like ‘e1071’ etc.
Results and Conclusion
When we proceed with the above given procedure we will
get the output of one figure in rStudio. Figure 4 has the details of the Google earth satellite image taken for classification.
Fig.4: rStudio Example Figure 5: Google Earth Satellite Training Pixels
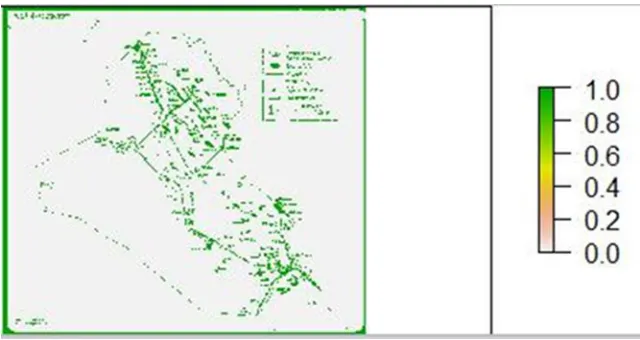
Figure 5 has the details of the Google earth satellite training pixels taken for classification.In the image show in the output will contain the fully classified image after applying the SVM classifier model created. So, you can measure
your accuracy of classification by applying the formula on the created SVM model created. By training with some positive images you will get the output in the rStudio showing the details as below:
Fig.6: The output obtained on running the given SVM code
If you retrain the images for more than two times and with increment of no of images added to the training for every time, you will get the more percentage of accuracy in the classification.
References
1. http://www.geol-amu.org/notes/m14a-4-9.htm
2. https://grasswiki.osgeo.org/wiki/Image_classification#
Supervised_classification
3. http://desktop.arcgis.com/en/arcmap/latest/extensions/s patial-analyst/image-classification/what-is-image-classification-.htm
4. http://www.sc.chula.ac.th/courseware/2309507/Lecture
/remote18.htm
5. http://mysong.desi/recent/Google-earth-map-india.html
6. https://philipphunziker.wordpress.com/2013/03/10/sup
ervised-image-classification-in-r-using-support-vector-machines/
7. http://www.di.ens.fr/willow/events/cvml2011/materials
/practical-classification/
8. Sánchez, D., Melin, P., Carpio, J., & Puga, H. (2017). Comparison of Optimization Techniques for Modular Neural Networks Applied to Human Recognition. In Nature-Inspired Design of Hybrid Intelligent Systems (pp. 225-241). Springer, Cham.
9. Chen, P., & Liu, S. (2009, August). An improved dag-svm for multi-class classification. In Natural Computation, 2009. ICNC'09. Fifth International Conference on (Vol. 1, pp. 460-462). IEEE.
10. Li, Z., Yuan, R., & Guan, X. (2007, June). Accurate classification of the internet traffic based on the svm method. In Communications, 2007. ICC'07. IEEE International Conference on (pp. 1373-1378). IEEE. 11. Bajla, I., Holländer, I., Czedik-Heiss, D., & Granec, R.
~ 95 ~
12. Zhang, L., Wang, L., & Lin, W. (2012).
Semisupervised biased maximum margin analysis for interactive image retrieval. IEEE Transactions on Image Processing, 21(4), 2294-2308.
13. [Ibrahim, M., Fakhr, M. W., & Aziem, M. A. (2013). LARGE SCALE LINEAR CODING FOR IMAGE
CLASSIFICATION. Ubiquitous Computing and
Communication Journal, 8(3), 1387.
14. Gallego-Posada, J. D., Montoya-Zapata, D. A.,
Sierra-Sosa, D. E., & Quintero-Montoya, O. L. Application of Deep Learning Algorithms to Image Classification.
15. Mohedano, E., Healy, G., McGuinness, K.,
Giró-i-Nieto, X., O'Connor, N. E., & Smeaton, A. F. (2014, November). Object segmentation in images using eeg signals. In Proceedings of the 22nd ACM international conference on Multimedia (pp. 417-426). ACM. 16. Ramisa Ayats, A., & Torras, C. (2013). Large-scale
image classification using ensembles of nested dichotomies. In Artificial intelligence research and development: proceedings of the 16th International Conference of the Catalan Association for Artificial Intelligence (pp. 87-90). IOS Press.
17. Kamavisdar, P., Saluja, S., & Agrawal, S. (2013). A survey on image classification approaches and
techniques. International Journal of Advanced
Research in Computer and Communication