© 2017 IJSRST | Volume 3 | Issue 8 | Print ISSN: 2395-6011 | Online ISSN: 2395-602X Themed Section: Science and Technology
An Application of PCA in ECG Classification with Cross - Validation
Nikhil G Kurup
Lecturer, NSS Polytechnic College, Pandalam, Kerala, India
ABSTRACT
Electrocardiogram (ECG)is a non-invasive technique used mainly as a primary diagnostic tool for cardiovascular diseases. A pure ECG signal provides valuable information about the electrophysiology of heart diseases and the occurrence of ischemic changes. It provides necessary information about the functional aspects of the heart and cardiovascular system. The objective of this report is to automatically detect the cardiac problems in ECG signal. Recently developed digital signal processing and pattern recognition technique is used in this report for the detection of cardiac problems. The detection of cardiac abnormalities in ECG signal consists of following steps :detection of QRS complex in ECG signal: feature extraction from detected QRS complexes : classification of beats using extracted feature set from QRS complexes. Automatic classification of heart beats in turn represents the automatic detection of cardiac problems in ECG signal. Hence this report develops an automatic algorithm for classification of heartbeats to detect cardiac abnormalities in ECG signals. SVM is used as a classifier and PCA is used for feature reduction. Also compared the result with out using PCA . Leave one out cross validation is also done.
Keywords: QRS detection; SVM; PCA ; Cross validation
I.
INTRODUCTION
Electrocardiogram (ECG) is a diagnosis tool that reported the electrical activity of heart recorded by skin electrode. The morphology and heart rate reflects the cardiac health of human heart beat. It is a non-invasive technique that means this signal is measured on the surface of human body, which is used in identification of the heart diseases . Any disorder of heart rate or rhythm, or change in the morphological pattern, is an indication of cardiac arrhythmia, which could be detected by analysis of the recorded ECG waveform. The amplitude and duration of the P-QRS-T wave contains useful information about the nature of disease afflicting the heart. The electrical wave is due to depolarization and re polarization of Na+ and k- ions in the blood.
ECG waves and interval are shown in Fig 1.
Figure 1. ECG signal
Heart disease persons can be broadly classified as either myopathics or ischemic. Myopathic usually experience as a slow degeneration of the heart over years or months, manifesting as inflammation of the cardiac muscle. In contrast, myocardial ischemic (a lack of oxygen to cardiac muscle) is often caused by a rapid build up (over hours) of plaque or other blood flow impeding particles and leads to muscle damage. The latter will usually manifest itself as a morphological change on particular section of the ECG. In both cases, the onset of potentially fatal arrhythmias often resulting in MI can be preceded by two main changes: a higher than normal incidence of ectopic beats, and a reduction in the short term variation of the abstemious heart rate .Most human being exhibit a normal cardiac (sinus) rhythm composed of very similar beats occurring at regular (but slightly varying) intervals. Beats which occur prematurely in the cycle, often with the different morphology, are known as ectopic (out of place) beats.
become widely used tool in the assessment of the regular heart rate behaviour . Several techniques have been proposed for the investigation of HRV time series. Among them [2] used spectral methods based on Fast Fourier Transform (FFT ) or standard autoregressive modelling,[3] used nonlinear approaches, including Markov modelling ,[4] compared different entropy-based estimators .Mutual information assess of autonomic information flow of heart rate dynamics at different time scales is studied in [5] and probabilistic modelling method was used by [6]. The application of the Karhunen Loeve Transformation is studied in [7] and modulation analysis studied in [8].
Neural network based classification methods are mainly used for the classification of heartbeat from ECG. Artificial intelligence and machine learning methods constitute a powerful tool in HRV analysis. Radial basis function networks were applied for learning and predicting the HRV dynamics in [9]. In [10] neural networks were used as a prediction and approximation tool for HRV analysis and the mean prediction error was used as a HRV index in [11] coronary disease risk was predicted based on short-term RR interval measurements.
II.
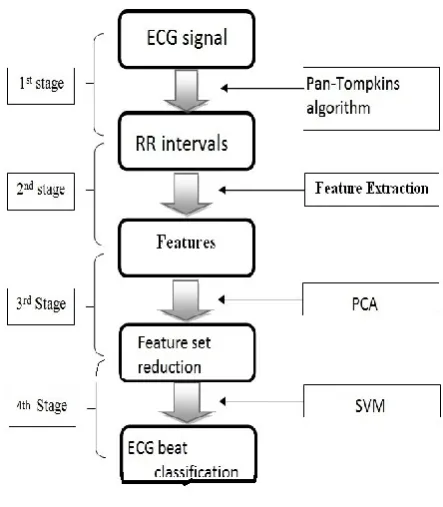
METHODOLOGY
Here from the input ECG signal R-R intervals are found out using Pan-Tompkins algorithm [19] .From R-R intervals the features [1] need for classification are derived. The feature set size is reduced using PCA [21],[22].after feature reduction they are classified using SVM classifier .
Figure 2. Flow chart
A. Support Vector Machine (SVM)
Support Vector Machine (SVM) [15]-[18] is mostly used for data classification. Support vector learning strategy is a principled and very powerful method that has outperformed most other systems in a wide variety of applications .The learning machine is given a training set of examples (or inputs), belonging to two classes, with associated labels (or output values).
Figure 3 .SVM
B. Principal Component Analysis (PCA)
Principal component analysis is appropriate when you have obtained measures on a number of observed variables and wish to develop a smaller number of artificial variables (called principal components) that will account for most of the variance in the observed variables. The principal components may then be used as predictor or criterion variables in subsequent analyses. Principal component analysis is appropriate when you have obtained measures on a number of observed variables and wish to develop a smaller number of artificial variables (called principal components) that will account for most of the variance in the observed variables. The principal components may then be used as predictor or criterion variables in subsequent analyses. The goal of feature selection is therefore to select features that allow for an accurate description of the defect condition, and subsequently, reliable defect classification, diagnosis, and prognosis.
III.
EATURE DETECTION
For R-R interval detection Pan-Tompkins algorithm [19] is used .From R-R interval several features are computed .From a series of instantaneous heart rates or cycle intervals, particularly those recorded over longer periods, traditionally 24 h, and more complex statistical time-domain measures can be calculated.
RR-interval is defined as the interval between successive heartbeat fiducially points. Features are extracted from the RR sequence.The statistical methods considered in this study are:[1]
the standard deviation, the standard deviation of mean
successive differences (rmssd), the mean standard deviation of intervals (sdnni), pNNx : the percentage of differences greater than x (pNNx) calculates how much percent of the differences between successive samples are greater than a given value x, the standard deviation of differences(sdsd), autocorrelation, the Shannon entropy.
IV.
RESULTS AND DISCUSSION
The database which is publically available from the site
www.physionet.org
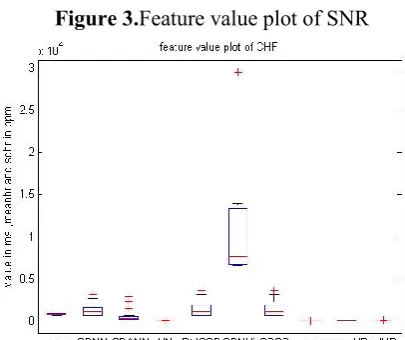
[13], [14]. Is used for the training and testing purpose .Two datasets where taken one nsr2db [13] which is a dataset contain ECG values of subjects having normal sinus rhythm. It is taken as a normal case. The second database taken is chf2db [14] which contain subjects having congestive heart failurecases. it is taken as a the abnormal case. The R-R interval values are taken and several time domain analyses is done to it. The result is shown in Fig 3 and
Fig4.
The output of the classification using SVM is shown below in Table 1 .The classified output and the accuracy, precision and recall. The output using the leave one out cross validation method is also shown below. The cross validation method shows a 100 percent accuracy rate.
The output of the classification using PCA-SVM is shown below in the three figures .The classified output and the accuracy, precision and recall. The output using the leave one out cross validation method is also shown below. The cross validation method shows a 100 percent accuracy rate which is same as the SVM method. So we can say that feature set reduction using PCA does not reduce the classification rate badly.
Method Features Accuracy Precision recall
SVM 12 75 69.23 90
SVM loo cross validation
12 100 100 100
SVM-PCA
8 80 87.50 70
SVM-PCA -loo
8 100 100 100
Table 1. Output of classifier
V.
FUTURE WORK
In the future work it is desirable to include more features by frequency domain analysis and time frequency analysis like Weigner Willey transforms and Ramanujan Fourier transforms can be applied to get a more general classification results. Also for feature selection fuzzy methods can also be applied. Also different classifier can also be tried.
VI.
REFERENCES
[1]. Argyro Kampouraki, George Manis, and Christophoros Nikou, Member, IEEE,"Heart beat time series classification using svm “IEEE
TRANSACTIONS ON INFORMATION
TECHNOLOGY IN BIOMEDICINE, VOL. 13, NO. 4, JULY 2009
[2]. F. Mormann, R. G. Andrzejak, C. E. Elger, and K. Lenhnertz, "Seizure prediction: the long and winding road," Brain, vol. 130, no. 2, pp. 313-333, 2006.
[3]. R. Silipo, G. Deco, R. Vergassola, and C. Gremigni, "A characterization of HRV’s nonlinear
hidden dynamics bymeans
ofMarkovmodels,"IEEE Trans. Biomed. Eng., vol. 46, no. 8, pp. 978-986, Aug. 1999.
[4]. M. Ferrario, M. Signorini, G. Magenes, and S. Cerutti, "Comparison of entropy-based regularity estimators: Application to the fetal heart rate signal for the identification of fetal distress," IEEE Trans. Biomed. Eng.,vol. 53, no. 1, pp. 119-125, Jan. 2006
[5]. D. Hoyer, B. Pompe, K. Chon, H. Hardhalt, C. Wicher, and U. Zwiener,"Mutual information function assesses autonomic information flow of heart rate dynamics at different time scales," IEEE Trans. Biomed. Eng.,vol. 52, no. 4, pp. 584-592, Apr. 2005
[6]. R. Barbieri and E. Brown, "Analysis of heartbeat dynamics by point process adaptive filtering,"IEEE Trans. Biomed. Eng., vol. 53, no. 1, pp. 4-12, Jan. 2006.
[7]. B. Aysin, L. Chaparro, I. Grave, and V. Shusterman, "Orthonormal basis partitioning and time frequency representation of cardiac rhythm dynamics,"IEEE Trans. Biomed. Eng., vol. 52, no. 5, pp. 878-889, May 2005
[8]. J. Mateo and P. Laguna, "Improved heart rate variability signal analysis from the beat occurence times according to the IPFM model," IEEE Trans. Biomed. Eng., vol. 47, no. 8, pp. 997-1009, Aug. 2000.
[9]. A. Bezerianos, S. Papadimitriou, and D. Alexopoulos, "Radial basis function neural networks for the characterization of heart rate variability dynamics," Artif. Intell. Med., vol. 15, no. 3, pp. 215-234, 1999.
[11].C. Cortes and V. N. Vapnik, "Support vector networks," Mach. Learn.,vol. 20, pp. 1-25, 1995. [12].http://www.physionet.org/physiobank/database/Fa
ntasia.
[13].http://www.physionet.org/physiobank/database/ns r2db.
[14].http://www.physionet.org/physiobank/database/ch 2db.
[15].H. Byun and S. W. Lee, "A survey of pattern recognition applications of support vector machines," Int. J. Pattern Recognit. Artif. Intell., vol. 17,no. 3, pp. 459-486, 2003.
[16].I. El-Naqa, Y. Yang, M. Wernick, N. Galatsanos, and R. Nishikawa, "A support vector machine
approach for detection of
microcalcifications,"IEEE Trans. Med. Imag., vol. 21, no. 12, pp. 1552-1563, Dec. 2002
[17].S.Osowski,L.T.Hoai, andT.Markiewicz, "Support vector machine based expert system for reliable heartbeat recognition," IEEE Trans. Biomed.Eng., vol. 51, no. 4, pp. 584-589, Apr. 2004
[18].A. Kampouraki, C. Nikou, and G. Manis, "Classification of heart rate signals using support vector machines," in Proc. BioSignal Conf., Brno,Czech Republic, Jun. 2006, pp. 9-11.
[19].J. Pan andW. J. Tompkins, "A real-time QRS detection algorithm," IEEE Trans. Biomed. Eng., vol. 32, no. 3, pp. 230-236, Mar. 1985
[20].http://en.wikipedia.org/wiki/Electrocardiography. [21].Arnaz Malhi, Robert X. Gao, "PCA-Based Feature
Selection Scheme for Machine Defect Classification" IEEE TRANSACTIONS ON INSTRUMENTATION AND MEASUREMENT, VOL. 53, NO. 6, DECEMBER 2004