University of Pennsylvania
ScholarlyCommons
Publicly Accessible Penn Dissertations
1-1-2015
Stapling and Unstapling Peptides and Proteins
With S-Tetrazine
Stephen P. Brown
University of Pennsylvania, [email protected]
Follow this and additional works at:http://repository.upenn.edu/edissertations Part of theChemistry Commons
This paper is posted at ScholarlyCommons.http://repository.upenn.edu/edissertations/1624
For more information, please [email protected]. Recommended Citation
Brown, Stephen P., "Stapling and Unstapling Peptides and Proteins With S-Tetrazine" (2015).Publicly Accessible Penn Dissertations. 1624.
Stapling and Unstapling Peptides and Proteins With S-Tetrazine
Abstract
This thesis will focus on the design, synthesis, and validation of synthetic techniques to introduce s-tetrazine into peptides and proteins. The s-tetrazine molecule is effective for restricting peptides/proteins to
macrocyclic conformations (i.e. stapling). Importantly, the incorporated s-tetrazine chromophore will undergo photodisassociation upon absorp-tion of a photon permitting the release of the restricted conformations (i.e. unstapling).
In chapter one, we aimed to study a fundamental folding process known as the helix-coil transition by phototriggering coupled with transient two-dimensional infrared spec-troscopy (2D IR). The s-tetrazine molecule possesses the photochemical properties of an ideal phototrigger, as such, s-tetrazine was employed towards the development of tech-niques capable of capturing the fastest structural transitions of biomolecules with both high spatial and high temporal resolution. Tripeptide linchpins, containing the s-tetrazine
phototrigger, were prepared by solid-phase peptide synthesis. The latter were then em-ployed toward the construction kinked helices near equilibrium via a fragment coupling procedure. The relaxation of the kinked helical structures were observed by pump/probe transient 2D IR spectroscopy.
In chapter two, new synthetic protocols have been developed and validated for the in-troduction of s-tetrazine into peptides and proteins to staple and unstaple the confor-mations. Conditions for the introduction of s-tetrazine into cysteine sulfhydryl groups of unprotected peptides conducted with aqueous biphasic
conditions, permitting the con-struction of macrocyclic peptides with a wide range of functionally and ring topology, bridging from one to 27 amino acid residues adjoining the cysteines. Importantly, the sta-pled conformations were released photochemically to their thiocyanate counterparts, and in turn the resulting thiocyanates removed to regenerate the native peptide. To the best of our knowledge s-tetrazine comprises the first example of a readily removable peptide sta-ple. Finally, the stapling and unstapling protocol has been extended to include thioredox-in as an example of a protein with an incorporated s-tetrazine construct that can also serve a useful role in conjugation strategies.
Degree Type
Dissertation
Degree Name
Doctor of Philosophy (PhD)
Graduate Group
Chemistry
First Advisor
Amos B. Smith
Keywords
peptide, phototriggering, stapling, tetrazine, unstapling
Subject Categories
Chemistry
i
STAPLING AND UNSTAPLING PEPTIDES AND PROTEINS
WITH s-TETRAZINE
Stephen P. Brown
A DISSERTATION
in
Chemistry
Presented to the Faculties of the University of Pennsylvania
In Partial Fulfillment of the Requirements for the
Degree of Doctor of Philosophy
2015
Supervisor of Dissertation
_____________________
Amos B. Smith, III
Rhodes-Thompson Professor of Chemistry
Graduate Group Chairperson
______________________
Gary A. Molander
Hirschmann-Makineni Professor of Chemistry
Dissertation Committee:
ii
Dedication
iii
ACKNOWLEDGMENTS
First of all, I would like to thank my advisor, Professor Amos B. Smith, III. I am grateful for being
given the chance to work in his group on such an interesting and challenging project. I really admire
Professor Smith’s work ethic, which I have tried to emulate in pushing myself forward. Many thanks
for the guidance, encouragement and support that has been given to me during all of those challenging
times.
Special thanks to my dissertation committee: Professor David Chenoweth, Professor E. James
Pe-tersson and Professor Virgil Percec for helpful and insightful discussions during our meetings.
Our collaborator, Professor Robin M. Hochstrasser, whom sadly passed away in February of 2013,
provided invaluable advice as well as 2D IR experiments to evaluate the ultrafast refolding process of
the kinked helix. Additionally, Drs. Matthew Tucker and Jianxin Chen for acquiring the photophysical
and 2D IR data. Also, thanks to Professor Feng Gai for continuing our collaboration in the
phototrig-gering area.
Dr. George Furst for assisting in the collection of high resolution NMR spectra for most of the
pep-tides in this thesis with only 1-2 milligram samples.
Dr. Joel Courter conducted the synthesis of a model S,S-tetrazine for photophysical studies and Dr.
Mohannad Abdo for the development of the fragment coupling procedure and synthesis of the helices
kinked with the s-tetrazine. Also, Matthew Bunner for continuing the work with Cl,S- and S,N-tetrazine
peptides
All of the Smith group members deserve great credit for providing such a supportive environment,
in particular Bruno Melillo, Mark Farrell, Joel Courter, Mohannad Abdo, Dave Jones and Jason Melvin.
I would like to express my deepest gratitude to my Mom, Dad, sister Laurie and especially my wife
Choja for their patience and support along the way. Anything that I could write here would simply not
iv
ABSTRACT
STAPLING AND UNSTAPLING PEPTIDES AND PROTEINS
WITH s-TETRAZINE
Stephen P. Brown
Professor Amos B. Smith, III
This thesis will focus on the design, synthesis, and validation of synthetic techniques to
introduce s-tetrazine into peptides and proteins. The s-tetrazine molecule is effective for
restricting peptides/proteins to macrocyclic conformations (i.e. stapling). Importantly, the
incorporated s-tetrazine chromophore will undergo photodisassociation upon absorption of
a photon permitting the release of the restricted conformations (i.e. unstapling).
In chapter one, we aimed to study a fundamental folding process known as the
helix-coil transition by phototriggering coupled with transient two-dimensional infrared
spec-troscopy (2D IR). The s-tetrazine molecule possesses the photochemical properties of an
ideal phototrigger, as such, s-tetrazine was employed towards the development of
tech-niques capable of capturing the fastest structural transitions of biomolecules with both high
spatial and high temporal resolution. Tripeptide linchpins, containing the s-tetrazine
pho-totrigger, were prepared by solid-phase peptide synthesis. The latter were then employed
toward the construction kinked helices near equilibrium via a fragment coupling procedure.
The relaxation of the kinked helical structures were observed by pump/probe transient 2D
v
In chapter two, new synthetic protocols have been developed and validated for the
in-troduction of s-tetrazine into peptides and proteins to staple and unstaple the
confor-mations. Conditions for the introduction of s-tetrazine intocysteine sulfhydryl groups of
unprotected peptides conducted with aqueous biphasic conditions, permitting the
construc-tion of macrocyclic peptides with a wide range of funcconstruc-tionally and ring topology, bridging
from one to 27 amino acid residues adjoining the cysteines. Importantly, the stapled
con-formations were released photochemically to their thiocyanate counterparts, and in turn the
resulting thiocyanates removed to regenerate the native peptide. To the best of our
knowledge s-tetrazine comprises the first example of a readily removable peptide staple.
Finally, the stapling and unstapling protocol has been extended to include thioredoxin as
an example of a protein with an incorporated s-tetrazine construct that can also serve a
vi
TABLE OF CONTENTS
DEDICATION... II
ACKNOWLEDGMENTS ... III
ABSTRACT ... IV
TABLE OF FIGURES ... VIII
TABLE OF SCHEMES ... XIII
CHAPTER 1. DEVELOPMENT OF A PHOTOTRIGGERING STRATEGY TO MEASURE THE ULTRAFAST NON-EQUILIBRIUM DYNAMICS OF
PEPTIDES ... 1
Introduction ... 1
Exploration of the Helix-Coil Transition ... 2
Two-Dimensional Infrared Spectroscopy ... 2
Phototriggering: A Technique to Explore Peptide/Protein Conformational Change ... 3
Early Work on s-Tetrazine Photofragmentation ... 4
Synthesis of Dichlorotetrazine ... 5
Preparation of Bis-Cysteine-S,S-Tetrazine and Photophysical Evaluation ... 7
Preparation of a S,S-Tetrazine Kinked Helix Near Equilibrium ... 8
Synthesis of Tripeptide Linchpins Containing s-Tetrazine ... 9
A Solution-Phase Fragment Coupling Strategy to Access a Kinked Helix (10) ... 12
2D IR Observation of Non-Equilibrium Folding Dynamics of a Kinked Helix ... 16
References for Chapter 1 ... 19
vii
CHAPTER 2. STAPLING AND UNSTAPLING PEPTIDES/PROTEINS WITH S
-TETRAZINE ... 48
Introduction ... 48
Disulfide Bonds: Covalent Conformational Restraints Used in Nature ... 49
Peptide Stapling: Synthetic Macrocyclization Constraints ... 49
All Hydrocarbon Peptide Stapling ... 51
Alternative Tactics of Peptide Stapling ... 52
Nature’s Example of Peptide Unstapling ... 53
Unstapling: Development of the s-Tetrazine Stapling and Unstapling Protocol ... 54
A Model System for the Development of s-Tetrazine Stapling and Unstapling ... 55
s-Tetrazine Stapling Compatibility with Various Peptide Substrates ... 57
Photochemical Unstapling of s-Tetrazine Stapled Peptides ... 59
Stapling Peptides with Proximal Lysine Residues... 62
Unstapling the S,N-Tetrazine Peptide 51 ... 64
Bioconjugate Reaction Exploiting the s-Tetrazine Staple ... 66
Stapling and Unstapling the Protein Thioredoxin with s-Tetrazine... 67
New Photochemical Conditions for Unstapling s-Tetrazine Thioredoxin ... 70
References for Chapter 2 ... 73
Experimental for Chapter 2 ... 75
APPENDIX ... 123
viii
Table of Figures
Figure 1.1. Two-Dimensional Infrared Spectroscopy Technique ... 2
Figure 1.2. Disulfide Bond Photolysis to Initiate Conformational Dynamics ... 4
Figure 1.3. Photofragmentation of s-Tetrazine ... 5
Figure 1.3. Photochemical Evaluation of the S,S-Tetrazine Phototrigger ... 8
Figure 1.4. Design of a Helical System Perturbed by the s-Tetrazine Chromophore ... 8
Figure 1.5. Infrared Shift of Isotopically Labeled Amides ... 11
Figure 1.6. Retrosynthesis of a Kinked Helix 10 Arising From a Three-Fragment Union ... 12
Figure 1.7. Isotopically Enriched Amides Within the Constrained Helices ... 15
Figure 1.8. Non-Equilibrium Folding Dynamics Observed ... 16
Figure 2.1. Design of Peptides to Mimic Bioactive Structures ... 48
Figure 2.2. Early Peptide Stapling Tactics ... 50
Figure 2.3. First Examples of Helix-Stabilization by Macrocyclization ... 51
Figure 2.4. Tactics Developed for Peptide Stapling ... 53
Figure 2.5. β-Defensin Employs Unstapling to Release Active Pharmacophore ... 54
Figure 2.6. Proposed Mechanism of Nitrile Removal from the Thiocyanates ... 57
Figure 2.7. (A) Apparatus employed to Conduct Temperature Controlled Photolysis (B) UV-vis of Different Cooling Solutions ... 60
Figure 2.8. Bioactivity Measurement for Regenerated Thioredoxin Resulting from UV-B Photolysis ... 69
Figure 2.9. Bioactivity Measurement for Regenerated Thioredoxin Resulting from Laser-Induced Photolysis ... 71
Figure A.1. 125 MHz 13C-NMR Spectrum ofCompound 1 in D2O ... 124
Figure A.2. 500 MHz 1H-NMR Spectrum of Compound 2 in CDCl3 ... 125
Figure A.3. 125 MHz 13C-NMR Spectrum of Compound 2 in CDCl3 ... 126
Figure A.4. 500 MHz 1H-NMR Spectrum of Compound 3 in CDCl3 ... 127
Figure A.5. 125 MHz 13C-NMR Spectrum of Compound 3 in CDCl 3 ... 128
Figure A.6. 125 MHz 13C-NMR Spectrum of Compound 5 in CDCl3 ... 129
Figure A.7. 500 MHz 1H-NMR Spectrum of Compound 7 in CD3OD ... 130
Figure A.8. 125 MHz 13C-NMR Spectrum of Compound 7 in CD3OD ... 131
Figure A.9. 500 MHz 1H-NMR Spectrum of Compound SI-2 in CDCl 3 ... 132
Figure A.10. 125 MHz 13C-NMR Spectrum of Compound SI-2 in CDCl 3 ... 133
Figure A.11. 500 MHz 1H-NMR Spectrum of Compound SI-3 in CDCl3 ... 134
Figure A.12. 125 MHz 13C-NMR Spectrum of Compound SI-3 in CDCl3 ... 135
Figure A.13. LC-MS Spectrum of Compound 10 Gradient 5-60 for 7 Minutes... 136
Figure A.14. 500 MHz 1H-NMR Spectrum of Compound 11 in d6-DMSO ... 137
ix
Figure A.16. LC-MS Spectrum of Compound 11 Gradient 5-60 for 7 Minutes... 139
Figure A.17. 500 MHz 1H-NMR Spectrum of Compound 12 in d6-DMSO ... 140
Figure A.18. 125 MHz 13C-NMR Spectrum of Compound 12 in d6-DMSO ... 141
Figure A.19. LC-MS Spectrum of Compound 12 Gradient 5-60 for 7 Minutes... 142
Figure A.20. 500 MHz 1H-NMR Spectrum of Compound 14 in D 2O ... 143
Figure A.21. 125 MHz 13C-NMR Spectrum of Compound 14 in D2O ... 144
Figure A.22. LC-MS Spectrum of Compound 14 Gradient 5-60 for 7 Minutes... 145
Figure A.23. 500 MHz 1H-NMR Spectrum of Compound 15 in D2O ... 146
Figure A.24. 125 MHz 13C-NMR Spectrum of Compound 15 in D2O ... 147
Figure A.25. LC-MS Spectrum of Compound 15 Gradient 5-60 for 7 Minutes... 148
Figure A.26. 500 MHz 1H-NMR Spectrum of Compound 16 in D2O ... 149
Figure A.27. 125 MHz 13C-NMR Spectrum of Compound 16 in D2O ... 150
Figure A.28. LC-MS Spectrum of Compound 16 Gradient 5-60 for 7 Minutes... 151
Figure A.29. 500 MHz 1H-NMR Spectrum of Compound 17 in D2O ... 152
Figure A.30. 125 MHz 13C-NMR Spectrum of Compound 17 in D 2O ... 153
Figure A.31. LC-MS Spectrum of Compound 17 Gradient 5-60 for 7 Minutes... 154
Figure A.32. 500 MHz 1H-NMR Spectrum of Compound 18 in D2O ... 155
Figure A.33. 125 MHz 13C-NMR Spectrum of Compound 18 in D2O ... 156
Figure A.34. LC-MS Spectrum of Compound 18 Gradient 5-60 for 7 Minutes... 157
Figure A.35. 500 MHz 1H-NMR Spectrum of Compound 19 in CD3OD ... 158
Figure A.36. LC-MS Spectrum of Compound 19 Gradient 5-60 for 7 Minutes... 159
Figure A.37. 500 MHz 1H-NMR Spectrum of Compound 20 in D2O ... 160
Figure A.38. 125 MHz 13C-NMR Spectrum of Compound 20 in D2O ... 161
Figure A.39. LC-MS Spectrum of Compound 20 Gradient 5-60 for 7 Minutes... 162
Figure A.40. 500 MHz 1H-NMR Spectrum of Compound 21 in d6-DMSO ... 163
Figure A.41. 125 MHz 13C-NMR Spectrum of Compound 21 in D2O ... 164
Figure A.42. LC-MS Spectrum of Compound 21 Gradient 5-60 for 7 Minutes... 165
Figure A.43. 500 MHz 1H-NMR Spectrum of Compound 24 in d6-DMSO ... 166
Figure A.44. 125 MHz 13C-NMR Spectrum of Compound 24 in d6-DMSO ... 167
Figure A.45. LC-MS Spectrum of Compound 24 Gradient 5-60 for 7 Minutes... 168
Figure A.46. 500 MHz 1H-NMR Spectrum of Compound 25 in d6-DMSO ... 169
Figure A.47. 125 MHz 13C-NMR Spectrum of Compound 25 in d6-DMSO ... 170
Figure A.48. 500 MHz 1H-NMR Spectrum of Compound 26 in d6-DMSO ... 171
Figure A.49. LC-MS Spectrum of Compound 27 Gradient 5-60 for 7 Minutes... 172
Figure A.50. LC-MS Chromatogram of Compound 28 Gradient 5-60 for 7 Minutes ... 173
Figure A.51. 500 MHz 1H-NMR Spectrum of Compound 32 in D2O ... 174
Figure A.52. 125 MHz 13C-NMR Spectrum of Compound 32 in D2O ... 175
Figure A.53. LC-MS Spectrum of Compound 32 Gradient 5-60 for 7 Minutes... 176
x
Figure A.55. 125 MHz 13C-NMR Spectrum of Compound SI-4 in d6-DMSO ... 178
Figure A.56. LC-MS Spectrum of Compound SI-4 Gradient 5-60 for 7 Minutes ... 179
Figure A.57. 500 MHz 1H-NMR Spectrum of Compound SI-5 in d6-DMSO... 180
Figure A.58. 125 MHz 13C-NMR Spectrum of Compound SI-5 in d6-DMSO ... 181
Figure A.59. LC-MS Spectrum of Compound SI-5 Gradient 5-60 for 7 Minutes ... 182
Figure A.60. 500 MHz 1H-NMR Spectrum of Compound SI-6 in d6-DMSO... 183
Figure A.61. 125 MHz 13C-NMR Spectrum of Compound SI-6 in d6-DMSO ... 184
Figure A.62. LC-MS Spectrum of Compound SI-6 Gradient 5-60 for 7 Minutes ... 185
Figure A.63. 500 MHz 1H-NMR Spectrum of Compound SI-7 in d6-DMSO... 186
Figure A.64. 125 MHz 13C-NMR Spectrum of Compound SI-7 in d 6-DMSO ... 187
Figure A.65. LC-MS Spectrum of Compound SI-7 Gradient 5-60 for 15 Minutes ... 188
Figure A.66. 500 MHz 1H-NMR Spectrum of Compound SI-8 in d6-DMSO... 189
Figure A.67. 125 MHz 13C-NMR Spectrum of Compound SI-8 in d6-DMSO ... 190
Figure A.68. LC-MS Spectrum of Compound SI-8 Gradient 5-60 for 10 Minutes ... 191
Figure A.69. 500 MHz 1H-NMR Spectrum of Compound SI-9 in d 6-DMSO... 192
Figure A.70. 125 MHz 13C-NMR Spectrum of Compound SI-9 in d6-DMSO ... 193
Figure A.71. LC-MS Spectrum of Compound SI-9 Gradient 5-60 for 15 Minutes ... 194
Figure A.72. 500 MHz 1H-NMR Spectrum of Compound SI-10 in d6-DMSO... 195
Figure A.73. 125 MHz 13C-NMR Spectrum of Compound SI-10 in d6-DMSO ... 196
Figure A.74. LC-MS Spectrum of Compound SI-10 Gradient 5-60 for 10 Minutes .... 197
Figure A.75. LC-MS Spectrum of Compound SI-11 Gradient 5-60 for 15 Minutes .... 198
Figure A.76. MALDI-TOF-MS Spectrum of Compound SI-11 ... 199
Figure A.77. 500 MHz 1H-NMR Spectrum of Compound 33 in D2O ... 200
Figure A.78. 125 MHz 13C-NMR Spectrum of Compound 33 in D2O ... 201
Figure A.79. 125 MHz 13C-NMR DEPT 135 Spectrum of Compound 33 in D2O ... 202
Figure A.80. LC-MS Spectrum of Compound 33 Gradient 5-60 for 7 Minutes... 203
Figure A.81. 500 MHz 1H-NMR Spectrum of Compound 34 in D2O ... 204
Figure A.82. 125 MHz 13C-NMR Spectrum of Compound 34 in D2O ... 205
Figure A.83. LC-MS Spectrum of Compound 34 Gradient 5-60 for 7 Minutes... 206
Figure A.84. 500 MHz 1H-NMR Spectrum of Compound 35 in D 2O ... 207
Figure A.85. 125 MHz 13C-NMR Spectrum of Compound 35 in D2O ... 208
Figure A.86. 500 MHz 1H-NMR Spectrum of Compound 36 in d6-DMSO ... 209
Figure A.87. 125 MHz 13C-NMR Spectrum of Compound 36 in d6-DMSO ... 210
Figure A.88. LC-MS Spectrum of Compound 36 Gradient 5-60 for 7 Minutes... 211
Figure A.89. 500 MHz 1H-NMR Spectrum of Compound 37 in d6-DMSO ... 212
Figure A.90. 125 MHz 13C-NMR Spectrum of Compound 37 in d6-DMSO ... 213
Figure A.91. LC-MS Spectrum of Compound 37 Gradient 5-60 for 7 Minutes... 214
Figure A.92. 500 MHz 1H-NMR Spectrum of Compound 38 in d6-DMSO ... 215
xi
Figure A.94. LC-MS Spectrum of Compound 38 Gradient 5-60 for 7 Minutes... 217
Figure A.95. 500 MHz 1H-NMR Spectrum of Compound 39 in d6-DMSO ... 218
Figure A.96. 125 MHz 13C-NMR Spectrum of Compound 39 in d6-DMSO ... 219
Figure A.97. LC-MS Spectrum of Compound 39 Gradient 5-60 for 10 Minutes... 220
Figure A.98. 500 MHz 1H-NMR Spectrum of Compound 40 in d 6-DMSO ... 221
Figure A.99. 125 MHz 13C-NMR Spectrum of Compound 40 in d6-DMSO ... 222
Figure A.100. LC-MS Spectrum of Compound 40 Gradient 5-60 for 15 Minutes... 223
Figure A.101. 500 MHz 1H-NMR Spectrum of Compound 41 in d6-DMSO ... 224
Figure A.102. 125 MHz 13C-NMR Spectrum of Compound 41 in d6-DMSO... 225
Figure A.103. LC-MS Spectrum of Compound 41 Gradient 5-60 for 10 Minutes... 226
Figure A.104. 500 MHz 1H-NMR Spectrum of Compound 42 in d6-DMSO ... 227
Figure A.105. 125 MHz 13C-NMR Spectrum of Compound 42 in d6-DMSO... 228
Figure A.106. LC-MS Spectrum of Compound 42 Gradient 5-60 for 15 Minutes... 229
Figure A.107. LC-MS Spectrum of Compound 43 Gradient 5-60 for 15 Minutes... 230
Figure A.108. MALDI-TOF-MS Spectrum of Compound 43 ... 231
Figure A.109. 500 MHz 1H-NMR Spectrum of Compound 44 in d6-DMSO ... 232
Figure A.110. 125 MHz 13C-NMR Spectrum of Compound 44 in d6-DMSO... 233
Figure A.111. LC-MS Spectrum of Compound 44 Gradient 5-60 for 7 Minutes... 234
Figure A.112. 500 MHz 1H-NMR Spectrum of Compound 45 in d6-DMSO ... 235
Figure A.113. 125 MHz 13C-NMR Spectrum of Compound 45 in d6-DMSO... 236
Figure A.114. LC-MS Spectrum of Compound 45 Gradient 5-60 for 7 Minutes... 237
Figure A.115. 500 MHz 1H-NMR Spectrum of Compound 46 in d6-DMSO ... 238
Figure A.116. 125 MHz 13C-NMR Spectrum of Compound 46 in d6-DMSO... 239
Figure A.117. LC-MS Spectrum of Compound 46 Gradient 5-60 for 7 Minutes... 240
Figure A.118. 500 MHz 1H-NMR Spectrum of Compound 47 in d6-DMSO ... 241
Figure A.119. 125 MHz 13C-NMR Spectrum of Compound 47 in d6-DMSO... 242
Figure A.120. LC-MS Spectrum of Compound 47 Gradient 5-60 for 10 Minutes... 243
Figure A.121. 500 MHz 1H-NMR Spectrum of Compound 48 in d6-DMSO ... 244
Figure A.122. 125 MHz 13C-NMR Spectrum of Compound 48 in d6-DMSO... 245
Figure A.123. LC-MS Spectrum of Compound 48 Gradient 5-60 for 10 Minutes... 246
Figure A.124. 500 MHz 1H-NMR Spectrum of Regenerated 32 in D2O ... 247
Figure A.125. 500 MHz 1H-NMR Spectrum of Regenerated SI-4 in d6-DMSO ... 248
Figure A.126. 500 MHz 1H-NMR Spectrum of Regenerated SI-5 in d6-DMSO ... 249
Figure A.127. 500 MHz 1H-NMR Spectrum of Regenerated SI-6 in d6-DMSO ... 250
Figure A.128. 500 MHz 1H-NMR Spectrum of Regenerated SI-8 in d6-DMSO ... 251
Figure A.129. 500 MHz 1H-NMR Spectrum of Regenerated SI-10 in d6-DMSO ... 252
Figure A.130. LC-MS Spectrum of Compound 49 Gradient 5-60 for 7 Minutes... 253
Figure A.131. 500 MHz 1H-NMR Spectrum of Compound 36 in d6-DMSO ... 254
xii
Figure A.133. LC-MS Spectrum of Compound 50 Gradient 5-60 for 7 Minutes... 256
Figure A.134. 500 MHz 1H-NMR Spectrum of Compound 51 in d6-DMSO ... 257
Figure A.135. 125 MHz 13C-NMR Spectrum of Compound 51 in d6-DMSO... 258
Figure A.136. LC-MS Spectrum of Compound 51 Gradient 5-60 for 7 Minutes... 259
Figure A.137. LC-MS Spectrum of Native Thioredoxin C4-Column Gradient 20-70 for 27 Minutes ... 260
Figure A.138. MALDI-TOF-MS Spectrum of Native Thioredoxin ... 261
Figure A. 139. LC-MS Spectrum of Protein 56 C4-Column Gradient 20-70 for 27 Minutes ... 262
Figure A.140. MALDI-TOF-MS Spectrum of Protein 56 ... 263
Figure A.141. MALDI-TOF-MS Spectrum of Dithiocyanate Thioredoxin-Flashlamp Conditions ... 264
xiii
Table of Schemes
Scheme 1.1. The Synthesis of Dichlorotetrazine... 6
Scheme 1.2. Synthesis and Photolysis of Bis-Cysteine-S,S-Tetrazine ... 7
Scheme 1.3. Solid-Phase Synthesis of S,S-Tetrazine Containing Tripeptide Linchpins . 10 Scheme 1.4. Tetrazine Tripeptide Linchpins Prepared by Solid-Phase Synthesis ... 11
Scheme 1.5. Reduction of the s-Tetrazine Chromophore... 13
Scheme 1.6. Benzyl Carbamate Removal with Concentrated Trifluoroacetic Acid ... 14
Scheme 1.7. Solution-Phase Fragment Coupling of the s-Tetrazine Kinked Helix 10 .... 14
Scheme 2.1. Stapling, Unstapling and Regeneration of the Native Peptide ... 55
Scheme 2.2.s-Tetrazine Stapled Peptides Prepared by Phase-Transfer Conditions ... 58
Scheme 2.3. Photochemical Unstapling Under Initial Conditions ... 59
Scheme 2.4. Temperature Controlled Photolysis ... 61
Scheme 2.5. Oxygenated Photolysis and Effective Unstapling of s-Tetrazine ... 62
Scheme 2.6. Synthesis of Cl,S-Tetrazine Peptide 50 and S,N-Tetrazine Peptide 51 ... 64
Scheme 2.7. Photochemical Unstapling of S,N-Tetrazine Peptide 51 ... 65
Scheme 2.8.s-Tetrazine Stapled Peptides Provide Effective Bioconjugate Handle ... 66
Scheme 2.9. Stapling the Protein Thioredoxin with s-Tetrazine ... 67
Scheme 2.10. Unstapling the Protein Thioredoxin Containing s-Tetrazine with UV-B Lamps ... 68
Scheme 2.11. Control Reaction for the Photolysis of Thioredoxin with UV-B Lamps ... 70
1
CHAPTER 1. Development of a Phototriggering Strategy to Measure
the Ultrafast Non-Equilibrium Dynamics of Peptides
Introduction
Proteins and peptides, dynamic entities comprised of amino acids linked together into a
linear chain, are responsible for a wide array of functions in biochemistry.1-4 These chains
of amino acids ultimately fold into three-dimensional structures, exploiting conformational
changes and transient molecular interactions, which in turn, determines the underlying
mechanism of a protein’s biological function. The early kinetic events that govern
confor-mational dynamics in peptides and proteins are critical for the development and refinement
of model systems that relate dynamic structure to the observed biological function.5-7
X-ray crystallography8-9 and nuclear magnetic resonance measurements10 can achieve atomic
resolution static structures, however these techniques do not provide information of the
transient, non-equilibrium structures. Techniques such as infrared (IR) spectroscopy,
Ra-men spectroscopy and fluorescence resonance energy transfer (FRET) have also been
de-veloped to capture the structural transitions of biomolecules. However, none of the existing
methods are capable of following the ultrafast folding dynamics with both high spatial and
temporal resolution.11 The development of methods to achieve atomic resolution transient
structures within the ultrafast time regime holds the promise towards understanding the
process that peptides and proteins undergo to self-assemble into well-ordered
2
Exploration of the Helix-Coil Transition
With the goal of developing a technique capable of capturing the fastest structural
tran-sitions of biomolecules with both high spatial and high temporal resolution, we began with
a basic folding process. The helix-coil transition is a fundamental folding transition
com-monly used by peptides and proteins. The rates for the helix-coil folding processes had not
previously been measured, but had been estimated to be on the order of pico- to
nanosec-onds with computer simulated values conflicting by more than two-orders of magnitude.
12-14 To achieve our goals, a successful method would require both structurally defined
start-ing and end points in the foldstart-ing process for spatial control, coupled with a technique
ca-pable of observing the backbone folding process on an ultrafast timescale.
Two-Dimensional Infrared Spectroscopy
Two-dimensional infrared spectroscopy (2D IR) has been developed and refined by
Hochstrasser to monitor the ultrafast conformational changes in peptides.15 In the broadest
sense 2D IR permits a fourier transform infrared (FTIR) spectrum to be transposed onto
two axes (Figure 1.1).16 This technique uses a series of pulses which are separated by
3
controllable time delays to generate an IR spectrum containing additional cross-peaks. The
cross-peaks found within the spectrum are related to the vibrational coupling between two
similar harmonic oscillators. The intensity of the signals arising from the vibrational
cou-pling are sensitive to both distance and orientation and in the cases of amide coucou-pling
within a peptide, the signals can be translated into phi/psi angles.17-18 The two-dimensional
IR technique is capable of operating on a picosecond timescale; as such, multiple snapshots
can be collected and translated into dynamic information as to how the peptide folding
process is progressing in solution at specific time points.
Phototriggering: A Technique to Explore Peptide/Protein Conformational Change
Phototriggering comprises a method that builds a macrocyclic constraint into the peptide
structure such that the constrained peptide takes on a new ground state and confines the
peptide into a narrow distribution of conformations. Additionally, the macrocyclic
con-straint must be photolabile such that laser-induced photolysis will break the concon-straint on
an ultrafast timescale permitting the peptide to refold to new ground state configurations.
One of the earliest examples of phototriggering was conducted by Hochstrasser and
DeGrado.19-20 These efforts employed bis-aryl disulfides to initiate the conformational
change in the dynamics of peptides. The bis-aryl disulfide phototrigger underwent
photol-ysis at 270 nm to sever the disulfide bond and expose two sulfur-centered radicals,
permit-ting the peptide to refold into a new configuration (Figure 1.2).19 A number of challenges
were presented in this experiment. First the hydrophobic nature of the aryl groups could
4
Figure 1.2. Disulfide Bond Photolysis to Initiate Conformational Dynamics
peptide and/or undergo geminate recombination. Lastly, the 270 nm wavelength used to
sever the disulfide bond is not compatible with tryptophan and tyrosine residues in the
peptide. The information gained from these experiments were used by Hochstrasser and
Smith to design an improved phototrigger. The design of an optimal phototrigger for the
study of ultrafast folding processes would possess the following properties: 1) fragment
rapidly on the femto- to picosecond time scale; 2) undergo fragmentation with a high
pho-toproduct yield upon flash photolysis; 3) constrain the peptide within a narrow,
well-de-fined distribution of conformations; 4) produce photofragmentation products that are
non-reactive and do not interfere with the conformational changes or the monitoring techniques;
and 5) undergo fragmentation with visible wavelengths to ensure maximum
biocompati-bility.21
Early Work on s-Tetrazine Photofragmentation
The s-tetrazine molecule possesses the photochemical properties of an ideal
phototrig-ger. The photofragmentation of s-tetrazine was initially described by Smith and
Hochstrasser.22 Molecules of s-tetrazine were shown to undergo absorption of an
ultravio-let (UV) photon at 327 nm to generate an excited state that collapses rapidly to form two
5
nitriles and nitrogen gas (Figure 1.3). Further experiments at low temperature revealed,
that it was possible to use crystals of s-tetrazine in natural isotope abundance and tune a
laser to selectively photolyze all of the lighter isotope material, leaving an enriched
Figure 1.3. Photofragmentation of s-Tetrazine
sample with the heavier isotopes.23-25 This experiment demonstrated that the s-tetrazine
photolysis reaction mechanism did not contain radical intermediates. Now, given the
fa-vorable photochemical properties of s-tetrazine, the question arises; how to introduce
te-trazine into peptides? The effect of carbon substituents at the 3,6-positions were shown to
increase the number of vibrational modes for relaxation of the tetrazine excited state, and
as a result, increased the fluorescent lifetimes leading to poor photoproduct yields. The
effect of a heavy atom, such as sulfur, however had not been examined and as such might
help retain the vibrational energy within the excited state of s-tetrazine to promote a better
photoproduct yield.
Synthesis of Dichlorotetrazine
To address the question, could sulfur substitution on s-tetrazine improve the
photochem-ical outcome, we turned to dichlorotetrazine (5, Scheme 1.1). The synthesis of
dichloro-tetrazine had previously been described,26-27 beginning from guanidine hydrochloride and
6
white amorphous solid (mp 233-237 ºC). The solid 1 was then reacted with two equivalents
of acetylacetone which spontaneously formed a bis-pyrazole hydrazine intermediate.
Heat-ing the latter leads to an intermediate which forms a dimer and precipitated as a light yellow
amorphous solid of dihydrotetrazine 2 (mp 147-149 ºC). After the oxidation of 2 with NO2
gas, the red the tetrazine core 3 (mp 224-226 ºC) is obtainedas a solid following
evapora-tion of the solvent. The pyrazoles of 3 are then displaced with hydrazine resulting in the
Scheme 1.1. The Synthesis of Dichlorotetrazine
precipitation of dihydrazinyl-s-tetrazine (4) as a fine, amorphous powder. Notably, 4 was
tested by differential scanning calorimetry and thermogravimetric analysis (DSC-TGA)
and shown to undergo an exothermic decomposition above 120 ºC in the presence of air;
CAUTION: must be used when forming and isolating this compound. Finally, 4 was
ox-idized with trichloroisocyanuric acid to furnish dichlorotetrazine (5) as a red, solid (m.p.
7
Preparation of Bis-Cysteine-S,S-Tetrazine and Photophysical Evaluation
To prepare a 3,6-sulfur substituted s-tetrazine, a graduate student Joel Courter initially
treated dichlorotetrazine (5) with two equivalents of cysteine 6, protected as the methyl
ester and acetyl amide, in pyridine and methylene chloride to furnish the model S,S
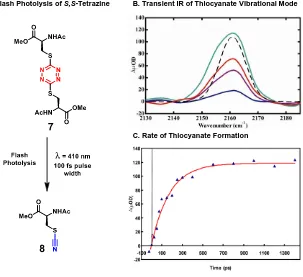
-te-trazine compound 7 (Scheme 1.2).28 Photochemical evaluation of 7 was then conducted
Scheme 1.2. Synthesis and Photolysis of Bis-Cysteine-S,S-Tetrazine
via flash photolysis coupled with transient IR spectroscopy. The experiment consisted of a
single flash pulse at 410 nm to release the s-tetrazine constraint and the evolution of the
thiocyanate absorbance was observed at 2163 cm-1 by transient IR on the picosecond
time-scale (Figure 1.3).29 The thiocyanate transient absorbance growth of 8 wasplotted at
spe-cific time points to determine the formation of thiocyanate time constant of 177 ps with an
11% yield of 8. Experiments conducted at 355 nm flash pulse doubled the yield to 22%,
thus the dicysteine S,S-tetrazine 7 represented a new class of compounds that held
8
Figure 1.3. Photochemical Evaluation of the S,S-Tetrazine Phototrigger
Preparation of a S,S-Tetrazine Kinked Helix Near Equilibrium
To achieve the goal of inserting the s-tetrazine phototrigger within larger peptides to
explore the helix-coil transition, studies were initiated to construct peptides containing the
s-tetrazine constraint within the alanine-rich peptide 9 (Figure 1.4), a system which adopts
Figure 1.4. Design of a Helical System Perturbed by the s-Tetrazine Chromophore
B. Transient IR of Thiocyanate Vibrational Mode
9
an -helical structure in the ground state. Reasoning that the introduction of the s-tetrazine
moiety within the middle of a 24-residue peptide via insertion between two cysteine
resi-dues would permit both the N- and C-terminal segments of the peptide to adopt an -helical
conformation, while the amino acids near the cysteine residues would form a kinked
con-formation due to the geometric constraint enforced by the incorporated s-tetrazine
photo-trigger. Photolysis would then release the constraint imposed s-tetrazine phototrigger,
per-mitting the peptide to undergo refolding, the exact nature of which had not previously been
explored. To this end, the two alanine residues at the tenth and twelfth positions were
se-lected to be replaced with the cysteine residues required to incorporate the s-tetrazine,
giv-ing rise to 10 (Figure 1.4)as the synthetic target.
Synthesis of Tripeptide Linchpins Containing s-Tetrazine
The first attempt to construct 10, conducted by postdoctoral fellow Mohannad Abdo,
entailed the solid-phase synthesis of the full-length peptide, followed by selective removal
of the cysteine protection groups and addition of dichlorotetrazine. After cleavage from the
resin support, a complex mixture was observed and no product was obtained from the
re-action. Undeterred, we identified that dichlorotetrazine could be introduced into shorter
tripeptides employing solid-phase peptide synthesis.30 To this end, tripeptides were
pre-pared by solid-phase peptide synthesis containing the two requisite cysteine residues
(CAC) with the sulfhydryls protected with mono-methoxytrityl (Mmt) groups (Scheme
1.3). Suitable conditions for the selective deprotection of the Mmt, specifically 2%
tri-fluoroacetic acid provided the free sulfhydryls without cleaving the peptide from the
10
Scheme 1.3. Solid-Phase Synthesis of S,S-Tetrazine Containing Tripeptide Linchpins
The sulfhydryls were next reacted with dichlorotetrazine, and following cleavage from
resin, the macrocycles (11 and 12) were obtained. To test the photochemical ring opening
of the incorporated s-tetrazine constraint, peptide 12 was irradiated in a methanol solution
under UV-A lamps in a Rayonet photoreactor to provide near quantitative conversion to
the dithiocyanate peptide 13 (Scheme 1.3). A series of natural amino acids were
incorpo-rated within the tripeptide and were evaluated to demonstrate the compatibility of other
side chains with the developed solid-phase peptide synthesis conditions. To this end
pep-tides 14-20 were prepared by the same method (Scheme 1.4). Only arginine displayed
ad-ditional reactivity after removal of the guanidium protection group. With the ability to
pre-pare various s-tetrazine peptide macrocycles now in hand, this synthetic method can also
be employed to introduce isotope labels into the peptide backbone. The isotope-enriched
amino acids were incorporated into the peptide sequence by the same solid-phase peptide
synthesis protocol; dichlorotetrazine insertion gave 21 and 22 (Scheme 1.4). Importantly,
the IR signals of the isotopically enriched 13C=18O amide peptides 21-22 are shifted out of
11
Scheme 1.4. Tetrazine Tripeptide Linchpins Prepared by Solid-Phase Synthesis
Figure 1.5. Infrared Shift of Isotopically Labeled Amides
3520 Org. Lett., Vol. 14, No. 13, 2012
perturb thephotolysis of theelectron-deficient S,S-tetrazine chromophore.
To monitor structural transitions on a fast time scale employing 2D-I R, differentiation of the amide I I R stretching modes of the diverse peptide carbonyls would be required.12To this end, tripeptides 4l,m and 7 were prepared (Figure 4), wherein the alanine and/or cysteine amino acid carbonylswerelabeled with13C or correspond-ing13C/18O, thelatter prepared by H218O exchange13of the 13
C-amino acid (see SI ). Tripeptides 4l,m were then pre-pared according to the previously developed solid-phase conditionsemploying theisotopically labeled amino acids. A modification to this protocol was required to construct tripeptide 7, as the 18O enrichment procedure proved incompatible with the para-monomethoxytrityl sulfur-protected cysteine. Pleasingly employing the thio-tert-butyl sulfur protected amino acid during the 18O exchange14 followed by solid-phase peptide synthesis proved effective. Sequential removal of the cysteine protecting groups with tributylphospineand TFA prior to insertion of thetetrazine moiety permitted preparation of tripeptide 7.
IR analysisof theisotopically labeled tripeptidesrevealed that the 13C/18O and 13C amino acid amide carbonyl stretching bands are shifted by∼60 and∼30 cm 1, respec-tively, with thedoubly labeled peak appearing at∼1590 cm 1, well separated from the main amide I band (Figure 5). The stretching frequency of the singly labeled carbonyl, however, remained somewhat buried in the main band.
Following the successful preparation of the 4a m series of tetrazine tripeptide linchpins, designated as (i, iþ 2) with regard to separation of Cys residues, we next sought to study larger macrocyclic congeners that inscribe the tetrazine ring. Standard Fmoc-based solid-phase peptide synthesiswasemployed to construct the(i, iþ 3) and (i, iþ 4) target peptides 9a,b and 9c respectively (Figure 6). With these model linchpins in hand, the photofragmentation reaction was again investigated. N anosecond flash photo-lysis15experiments revealed a dependence of the photo-chemical yield on the size of the macrocyclic peptide con-strained by the S,S-tetrazine. Peptide 4c, with an (i, iþ 2) relationship between the Cys residues, afford the highest photoproduct yield upon flash photolysis (> 25% ). The (i, iþ 3) relationship in 9b led to a decreasein photoproduct to > 15% ; a further decreaseto∼10% wasobserved for the (i, iþ 4) peptide 9c. The observed photochemical yield dependence is likely related to the conformational strain exerted by the peptides on the S,S-tetrazine ring. Impor-tantly the photochemical yields are sufficient that popula-tion changes are observable by 2D I R, while adequate intact linchpin is maintained to enable spectroscopic data to be accumulated over an extended period of time. Figure 3. Tetrazine tripeptides synthesized in 7 30% overall
yield with the exception of 4k which undergoes decomposition upon purification.
Figure 4. I sotopically labeled S,S-tetrazine containing tripep-tide units with doubly labeled carbonyls highlighted in yellow and singly labeled in green.
Figure 5. I nfrared spectra (1550 1770 cm 1) of 4a (red), 4l (green), and 7 (black) recorded in CD3OD .
(12) (a) Torres, J.; A dams, P. D .; A rkin, I . T. J. M ol. Biol. 2000, 300, 677–685. (b) Fang, C.; Wang, J.; Charnley, A. K .; Barber-Armstrong, W.; Smith, A . B.; D ecatur, S. M .; H ochstrasser, R. M . Chem. Phys. L ett. 2003, 382,586–592. (c) Fang, C.; Wang, J.; K im, Y. S.; Charnley, A. K .; Barber-A rmst rong, W.; Smith, A . B.; D ecatur, S. M .; H ochstrasser, R. M . J. Phys. Chem. B 2004, 108, 10415–10427. (d) Fang, C.; H ochstrasser , R. M . J. Phys. Chem. B 2005, 109,18652–18663.
(13) M arecek, B.; Song, B.; Brewer, S.; Belyea, J.; D yer, R. B.; Raleigh, D . P. Org. L ett. 2007, 9,4935–4937.
(14) Gormer, K .; Waldmann, H .; Triola, G. J. Org. Chem. 2010, 75,
12
and can thus be observed independently from the rest of the peptide backbone (Figure 1.5).
The isotope labeling feature permits the monitoring of picosecond structural transitions
within the amide backbone by 2D IR without interference from the remaining amide
sig-nals of 10 following photochemical release.
A Solution-Phase Fragment Coupling Strategy to Access a Kinked Helix (10)
To prepare kinked helix 10 from the tripeptide linchpins (Figure 1.6), a solution-phase
fragment union strategy was developed.31 This approach first required an orthogonal
pro-tection group strategy to differentiate the N-terminus of the linchpin 11 from the lysine
side-chains of either fragment. The Boc- protection group and the removal thereof was
demonstrated to be compatible with the tetrazine ring during the synthesis of the linchpins.
13
Evaluation of known deprotection conditions that are orthogonal to Boc were not
compat-ible with the S,S-tetrazine phototrigger. Notably, the basic conditions used to remove the
Fmoc-group were found to react with the tetrazine peptides. Interesting reactivity with the
tetrazine chromophore was observed upon application of reductive conditions employed to
remove the Cbz-protection group in peptide 7. Importantly, treatment with Pd/C and
hy-drogen gas led to the reduction of the s-tetrazine ring to the dihydrotetrazine congener 23.
When the colorless solution of the reduced product 23 was exposed to air, 23 underwent
oxidation back to the red starting material 7 (Scheme 1.5).
Scheme 1.5. Reduction of the s-Tetrazine Chromophore
To test the conditions for Cbz removal, model peptide 24 was prepared. Treatment of
24 under the identical conditions outlined in Scheme 1.5, reduced the s-tetrazine ring; but
did not lead to efficient removal of the Cbz group. Forging a new strategy, Cbz is known
14
Scheme 1.6. Benzyl Carbamate Removal with Concentrated Trifluoroacetic Acid
to be mildly unstable under strongly acidic conditions. To this end, stirring 24 in a solution
of neat TFA (Scheme 1.6) was found to drive off carbon dioxide over the course of 24 hours
to furnish 25 with efficient removal of the Cbz group and importantly without affecting the
tetrazine chromophore.
Turning next to the construction of the full-length peptide 10 containing the s-tetrazine
ring,a solution-phase fragment union protocol was developed by post-doctoral fellow
Mo-hannad Abdo. With the use of the Cbz protecting group validated, the synthesis of the target
10 was planned to arise via union of three fragments 26, 27 and 28 (Scheme 1.7). The
appropriate linchpin 26 was prepared via Boc protection of the N-terminus of 11 (from
Scheme 1.3). The protected C- and N-terminal peptide fragments 27 and 28 in turn were
15
constructed via solid-phase peptide synthesis employing N-methyl indole and
2-chlo-rotrityl resins, respectively. After activation of linchpin 26 with the coupling agent, HBTU,
the free amine of peptide 27 was coupled. Then, following purification and removal of the
Boc protecting group, the resulting peptide was attached to the activated peptide fragment
28. Global deprotection was then achieved by treatment with neat TFA to furnish target
peptide 10 in an 11% yield over four steps after final HPLC purification (Scheme 1.7).
To monitor the picosecond structural transitions within specific regions of the amide
backbone by 2D IR following the photochemical release of s-tetrazine within 10, the amide
stretching modes at specific locations along the peptide construct required differentiation
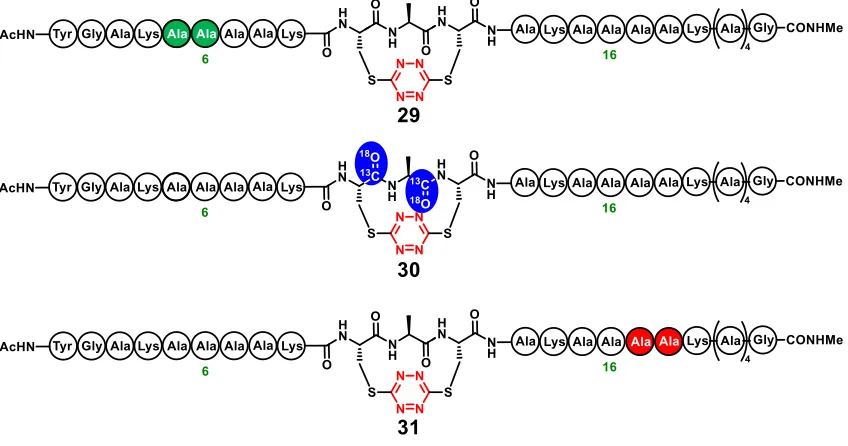
by isotopic editing of the amides. Specifically, we sought to incorporate the 13C=18O
dou-ble label at three defined positions along the peptide backbone. The solution phase
16
fragment coupling strategy (Scheme 1.7) was used to prepare labeled peptides 29-31
(Fig-ure 1.7). Peptide 30 would permit measurement of the kinked region while the backbone
dynamics distal to the s-tetrazine phototrigger could be monitored through the two
13C=18O-Ala units introduced within 29 or 31 specifically at amino acid locations 5-6 and
17-18, respectively.
2D IR Observation of Non-Equilibrium Folding Dynamics of a Kinked Helix
The isotopically enriched helical peptides 29-31, constrained with the tetrazine
photo-triggering cross-link, were then used to explore the ultrafast, non-equilibrium folding
dy-namics of the kinked helix.32 Transient 2D IR spectroscopy was used to record structural
snapshots of the bond distances and bond angles during formation of a single helical turn
of the kinked helix upon photorelease of the tetrazine chromophore (Figure 1.8). The
re-sults with the isotopically labeled variant peptides 29-31 proved structurally distinct. When
10 is isotopically edited with 13C=18O at residues Cys10 and Ala11 (i.e.30), both
Figure 1.8. Non-Equilibrium Folding Dynamics Observed
amide backbone vibrations are isotopically down-shifted 60 cm–1, which strongly reduces
their coupling with those of the other carbonyls. The location, polarization, and line width
S,S-Tetrazine Photolysis Complete in
< 67 ps 2D-IR probe
λ= 355 nm
700 fs pulse
17
of the isotopically shifted amide I band was then used to determine structural parameters
in two picosecond snapshots, recorded over a nanosecond range of delays. To examine the
site-specific structural changes upon photorelease, the two labeled peptides (29 and 31)
were also examined. The amide I modes involving 29 and 31 each with a pair of residues
spatially separated by approximately one helix turn from the kink revealed equivalent
di-agonal 2D IR trace spectra through all optical delay times, thereby implying that these
residues do not undergo any significant structural change as a result of the photolysis. On
the other hand, the transient 2D IR spectrum of peptide 30 containing the labeled pair
within the s-tetrazine distorted region, exhibits very different spectra and responses to
pho-tolysis.
Specifically, the isotopically labeled region of 30, located around 1,600 cm–1, exhibits
significant photolysis-induced changes in peak position and spectral width, which are most
evident from the 2D IR diagonal traces. A frequency upshift of 7.5 cm–1 occurs over the
first 300 ps after photolysis of 30, followed by a slight decrease to a fixed value (3 cm–1
up-shifted) after 500 ps. The 2D IR spectral width of the diagonal 2D IR traces of this band
increases by 5 cm–1 from the starting constrained configuration and then decreases until
about 500 ps delay, whereupon a constant value is reached. The spectral width was fit to
exponential decay with a time constant of 97 ± 7 ps indicating rotation about the psi angle
to recover the helical structure.
In summary, the design, synthesis and validation of peptides containing the s-tetrazine
18
picosecond snapshots of helix relaxation. The constrained peptide 10 is believed to be
lo-cated somewhere on the downhill side of the free energy barrier towards the complete helix.
Upon release of the constraint, the 2D IR spectra provided a glimpse into the
conforma-tional reorganization that occurs as the peptide proceeds toward equilibrium. These
exper-iments reveal key motions along the folding coordinate as the peptide reorganized toward
the full α-helical conformation which importantly does not involve movements that push
the kink along the chain toward the ends of the peptide. Moreover, the peptide also does
not irreversibly unfold before proceeding toward the native helical conformation. Rather,
the central region, where the small perturbation to the helical structure had been enforced
by the constraint undergoes a local structural change following photorelease. The data
col-lected during the acquisition permits the visualization of the fastest structural changes for
10,as the peptide proceeds toward the equilibrium ensemble in response to release of the
phototrigger. Although the propagation times for helices have been estimated from
exper-iments to be on the order of tens of nanoseconds, the structural movements observed in
these experiments suggest that propagation times after nucleation are on the order of
hun-dreds of picoseconds. Moreover, the simulated equilibrium time autocorrelations of the
angle between the dipoles, the distance between the two dipoles, and the dihedral angles
all agree well with the observed parameters, suggesting the conformational kinetics are
19
References for Chapter 1
1. McCammon, J. A.; Gelin, B. R.; Karplus, M. Nature 1977, 267, 585.
2. Henzler-Wildman, K. A.; Lei, M.; Thai, V.; Kerns, S. J.; Karplus,M.; Kern, D. Nature
2007, 450, 913.
3. Henzler-Wildman, K.; Kern, D. Nature 2007, 450, 964.
4. Smock, R. G.; Gierasch, L. M. Science 2009, 324, 198.
5. Frauenfelder, H.; Sligar, S. G.; Wolynes, P. G. Science 1991, 254, 1598.
6. Brooks, C. L.; Gruebele, M.; Onuchic, J. N.; Wolynes, P. G. Proc. Natl. Acad. Sci. U.S.A.
1998. 95, 11037.
7. Wolynes, P. G.; Eaton, W. A.; Fersht, A. R. Proc. Natl. Acad. Sci. U.S.A.2012, 109,
17770.
8. Anfinrud P, Schotte F. Science. 2005. 309, 1192-1193.
9. Cho HS, Dashdorj N, Schotte F, Graber T, Henning R, Anfinrud P. Proc Natl Acad Sci U
S A. 2010. 107, 7281-7286.
10.Sborgi, L.; Verma, A.; Sadqi, M.; Alba, E.; Muñoz, V. Methods Mol. Biol.2013, 932,
205.
11.Serrano, A.L.; Waegele, M.M.; Gai, F. Protein Science.2012, 21, 157-170.
12.Thompson, P. A.; Eaton, W. A.; Hofrichter, J. Biochemistry, 1997, 36, 9200–9210.
13.Thompson, P. A.; Muñoz, V.; Jas, G. S.; Henry, E. R.; Eaton, W. A.; Hofrichter, J.J.
Phys. Chem. B, 2000, 104, 378–389.
14.Brooks, C. L. J. Phys. Chem.1996, 100, 2546–2549.
15.Asplund, M. C.; Zanni, M. T.; Hochstrasser, R. M. Proc. Natl. Acad. Sci. 2000, 97, 8219.
16.Adapted with permission from the National Academy of Sciences: Hochstrasser, R. M.
Proc. Natl. Acad. Sci., 2007, 104, 14190-14196. Copyright (2007) National Academy of
Sciences, U.S.A.
17.Remorino, A.; Korendovych, I. V.; Wu, Y.; DeGrado, W. F.;Hochstrasser, R. M. Science
2011, 332, 1206.
20
19.H. S. M. Lu, M. Volk, Y. Kholodenko, E. Gooding, R. M.Hochstrasser,W. F. DeGrado, J.
Am. Chem. Soc. 1997, 119, 7173
20.M. Volk, Y. Kholodenko, H. S. M. Lu, E. A. Gooding, W. F.DeGrado, R. M.
Hochstrasser, J. Phys. Chem. B. 1997, 101, 8607
21.Volk, M. Eur. J. Org. Chem. 2001, 2605.
22.King, D. S.; Denny, C. T.; Hochstrasser, R. M.; Smith, A. B., III. J. Am. Chem. Soc.
1977, 99, 271-273.
23.Hochstrasser, R. M.; King, D. S.; Smith, A. B., III. J. Am. Chem. Soc.1977, 99 3923–
3933.
24.Dellinger, B.; King, D. S.; Hochstrasser, R. M.; Smith, A. B., III. J. Am. Chem. Soc.
1977, 99, 3197.
25.Dellinger, B.; King, D. S.; Hochstrasser, R. M.; Smith, A. B., III. J. Am. Chem. Soc.
1977, 99, 7138.
26.M. D. Coburn, G. A. Buntain, B.W. Harris, M. A. Hiskey, K. Y. Lee, D. G. Ott, J.
Heter-ocycl. Chem. 1991, 28, 2049.
27.M. D. Helm, A. Plant, J. P. A. Harrity, Org. Biomol. Chem. 2006, 4, 4278.
28.Tucker, M. J., Courter, J. R., Chen, J., Atasoylu, O., Smith, A. B. and Hochstrasser, R. M.
Angew. Chem. Int. Ed.2010, 49, 3612–3616.
29.Tucker, M. J.; Abdo, M.; Courter, J. R.; Chen, J. X.; Smith, A. B., III; Hochstrasser, R.
M. J. Photochem. Photobiol. A. 2012, 234, 156–163.
30.Abdo, M.; Brown, S. P.; Courter, J. R.; Tucker, M. J.; Hochstrasser, R. M.; Smith, A. B.,
III. Org. Lett.2012, 14, 3518-3521.
31.Courter, J. R.; Abdo, M.; Brown, S. B.; Tucker, M. J.; Hochstrasser, R. M.; Smith, A. B.,
III. J. Org. Chem. 2014. 79, 759-768.
32.Tucker, M. J.; Abdo, M.; Courter, J. R.; Chen, J. X.; Brown, S. P.; Smith, A. B., III;
Hochstrasser, R. M. PNAS. 2013, 110, 17314.
33.Ishikawa, H.; Kwak, K.; Chung, J. K.; Kim, S.; Fayer, M. D. PNAS. 2008. 105,
21
Experimental for Chapter 1
Reaction Equipment. Solid-phase syntheses were carried out in peptide synthesis reaction
vessels (25 or 50 mL) with coarse porosity fritted glass support and Teflon stopcocks.
Pho-tolysis experiments were performed in a RayonetTM Srinivasan-Griffin Photoreactor (The
Southern New England Ultraviolet Company) using either UV-A lamps (part # LZC-UVA)
or UV-B lamps (part # LZC-UVB) purchased from Luzchem.
Chromatography. Prep-scalereverse-phase chromatography was conducted with a Gilson
215 liquid handler/injector fitted with Gilson 333/334 binary HPLC pumps and UV/vis
dual wavelength detector (model 156) and Trilution software. The chromatographies were
carried out on a Waters XBridge Prep BEH 130 C18 5µm OBD 19 × 100mm column (part
# 186003587). The eluent was acetonitrile (HPLC grade) and Millipore water with 0.1%
trifluoroacetic acid buffer unless otherwise noted and gradients specific to the compound.
Instruments Used for Spectral Data. 1H NMR, 13C NMR and 2D NMR spectra were
recorded on a Bruker Avance III equipped with either a 5 mm dual inverse probe or 5 mm
DCH CryoProbe. The analytical LC-MS analyses were conducted using a Waters 2767
sample manager, consisting of a Waters 2525 binary gradient HPLC connected to a diode
array detector and a Waters Micromass ZQ mass spectrometer with electro-spray
ioniza-tion. The LC-MS samples were analyzed as solutions in water or acetonitrile, prepared at
0.15 – 0.20 mg/mL concentration. The LC-MS chromatography was carried out on an
At-lantis–C18 column (4.6 ×50 mm; 5 µm) with linear gradients of 0.05% formic acid in
22
on Waters LC-TOF mass spectrometer (model LCT-XE Premier) using electrospray
ioni-zation in positive or negative mode, depending upon the analyte. MALDI-MS spectra were
collected with a Bruker Ultraflex III TOF/TOF matrix-assisted laser desorption/ionization
mass spectrometer. All FTIR spectra were taken on a Nicolet 6700 FTIR spectrometer or
PerkinElmer FTIR (model Spectrum BX).
Triaminoguanidine hydrochloride (1). A 250 mL round bottom flask was charged with
guanidine hydrochloride (14.70 g, 153.9 mmol) and suspended in 1,4-dioxane (80 mL).
With magnetic stirring, hydrazine hydrate (25.2 mL, 508 mmol, 3.3 equiv) was added, after
one minute, the solid had dissolved and the solution was refluxed for 2.0 hours during
which time a white, solid precipitated. The contents were cooled to ambient temperature,
vacuum filtered, and the solid washed with 1,4-dioxane (2 × 50 mL). The solid was dried
in vacuo for 16 hours to yield 20.76 g (96%) of triaminoguanidine hydrochloride, as a
crystalline white solid. 13C NMR (126MHz, D2O) δ = 159.7.
A 1L, three necked flask was set-up with a reflux column and mechanical stirred. To the
flask was added triaminoguanidine hydrochloride (14.06 g, 100.0 mmol) and dissolved in
23
was added dropwise from an additional funnel at a rate such that the exothermic reaction
did not rise above ca.40 oC. After complete addition of the reagent, the solution was stirred
at ambient temperature for 15 minutes and then heated to 80 oC for 3.5 hours during which
time a light yellow solid formed and the solution turned dark orange. The contents were
diluted with water (100 mL) then cooled to ca. 5 oC, the solid was collected by vacuum
filtration and washed with ice water (3 × 100 mL) until the orange color was removed. The
material was dried in vacuo for 16 hours to yield 10.00 g (74%) of bis
-dimethylpyrrazol-yldihydrotetrazine as faint yellow, amorphous powder. 1H NMR (500MHz, CDCl3) δ =
8.07 (s, 2 H), 5.96 (s, 2H), 2.48 (s, 6 H), 2.21 (s, 6 H). 13C NMR (126MHz, CDCl3) δ =
150.1, 145.9, 142.4, 110.0, 13.9, 13.6.
A 125 mL Erlenmeyer flask was charged with bis-dimethylpyrrazolyldihydrotetrazine
(10.00 g, 36.7 mmol) and dissolved in CHCl3 (75 mL) then cooled to 0oC in an ice bath.
Next, NO2 gas was generated by dissolving, in portions, copper wire (4.66 g, 73.4 mmol,
2 equiv) in concentrated nitric acid (50 mL) contained in a separate Erlenmeyer flask. The
red gas that evolved was pushed with nitrogen gas, through glass tubing and bubbled
through the chloroform solution which turned dark red upon addition, the reaction was
continued until the solution became saturated with NO2 evident by the red gas evolving
from the chloroform solution (ca. 3 min). The solution was transferred to a separatory
24
over MgSO4. The filtrate was stripped under reduced pressure to yield 9.72 g (98%) of bis
-dimethylpyrrazolyltetrazine a red, amorphous powder. 1H NMR (500MHz, CDCl 3) δ =
6.16 (s, 2 H), 2.68 (s, 6 H), 2.36 (s, 6 H). 13C NMR (126MHz, CDCl3) δ = 159.4, 154.5,
143.8, 112.0, 14.7, 13.9.
CAUTION:The dihydrazinyltetrazine product was found to undergo exothermic
de-composition above 120 oC when analyzed by DSC-TGA under air and ramping the
temperature at 5o/minute. No decomposition was observed when
dihydrazinylte-trazine was held at 80oC under air for 60 minutes. As a precaution an inert
atmos-phere is highly recommended to prevent any oxidation during the course of the
reac-tion.
Dihydrazinyltetrazine (4). A 250 mL, two-necked flask was charged with bis
-dime-thylpyrrazolyltetrazine (9.72 g, 36.0 mmol) and suspended in acetonitrile (75 mL), a reflux
condenser was attached and the contents placed under a nitrogen atmosphere. Next,
hydra-zine hydrate (3.57 mL, 72.0 mmol, 2.05 equiv) was added neat with magnetic stirring. The
flask was placed in an oil bath, pre-heated to 70 oC for 75 minutes, a red precipitate formed
and the reaction solution became faint red (almost colorless). The contents were cooled in
an ice bath and the red solid collected by vacuum filtration and dried under vacuum for 15
min to yield 3.02 g (59%) of dihydrazinyltetrazine as a red amorphous powder. The product
25
Dichlorotetrazine (5). A 100 mL round bottom flask, was charged with
dihydrazinylte-trazine (2.95 g, 20.8 mmol) and suspended in acetonitrile (40 mL) then cooled in an ice
bath. Trichloroisocynanuric acid (9.89 g, 42.6 mmol, 2.05 equiv) was dissolved in
acetoni-trile (30 mL) and added dropwise over 15 minutes. The ice bath was removed and the
contents stirred at room temperature for 1.0 hour, the color of the solution changed from
red to orange. The reaction was vacuum filtered, the white solid was rinsed with acetonitrile
(2 × 5 mL) and the filtrate was collected and evaporated (70 torr, bath temperature 22oC)
to give a red-orange solid. The crude material was dissolved in CH2Cl2 (15 mL) and filtered
through a pad of celite (3.5 cm diameter × 8 cm length), the column was eluted with
di-chloromethane until the solution eluent ran colorless. The solvent was stripped under
re-duced pressure (100 torr, bath temperature 22oC) to yield 3.10 g (99%) of dichlorotetrazine
as a waxy, orange solid. 13C NMR (126MHz, CDCl
3) δ = 168.3.
The material can be further purified by sublimation; heating the product in a subliminator
26
Procedures for Manual Solid-Phase Peptide Synthesis
Resin Washing Procedures. Resin washing was conducted with the indicated solvent and
was allowed to contact the resin for 30 seconds during each wash. The solvent was pushed
through the frit using an “air push” apparatus made from a 15 mL disposable syringe and
a 14/20 septum, or nitrogen gas was used in cases when an inert atmosphere is a
require-ment.
General Procedures for the Resin Loading
Wang Resin Amino Acid Loading. Wang resin (0.22 mmol) was placed in a peptide
synthesis vessel and the resin was swelled in CH2Cl2 (10 mL) for 1.0 hour. The solvent
was drained and a pre-mixed solution consisting of Fmoc-AA-OH (0.88 mmol, 4 equiv),
MSNT (0.88 mmol, 4 equiv) and methyl imidazole (0.66 mmol, 3 equiv) dissolved in
CH2Cl2 (5 mL) was added to the resin. The contents were gently rocked for 2.0 hours, then
drained and the resin washed with CH2Cl2 (3 × 5 mL). The procedure was repeated and the
resin carried on to the next step.
N-Methyl Indole AM Resin Amino Acid Loading. N-Methyl indole resin (0.22 mmol)
27
1.0 hour. The solvent was drained and the resin was washed with DMF (3 × 6 mL) then
treated with 20% piperidine/DMF (2 × 6 mL) allowing the solution to contact the resin for
10 minutes. The resin was washed with DMF (3 × 5 mL), then a pre-mixed solution
con-sisting of Fmoc-AA-OH (1.1 mmol, 5 equiv), HBTU (1.1 mmol, 5 equiv), oxyma (1.1
mmol, 5 equiv) and DIPEA (2.2 mmol, 10 equiv) dissolved in DMF (5 mL) was added to
the resin. The contents were rocked gently for 1.0 hour, then drained and the resin washed
with DMF (3 × 5 mL). The coupling procedure was repeated and the resin carried on to the
next step.
2-Chlorotrityl Chloride Resin Amino Acid Loading. 2-Chlorotrityl chloride resin (0.40
mmol) was placed in a peptide synthesis vessel and the resin was swelled in CH2Cl2 (10
mL) for 1 h. The solvent was drained and the resin was then treated with a pre-mixed
solution of Fmoc-AA-OH (0.48 mmol, 1.2 equiv), and DIPEA (1.6 mmol, 4 equiv)
dis-solved in CH2Cl2 (5 mL) was added to the resin. The contents were rocked gently for 1 h,
then drained and the resin washed with DMF (3 × 5 mL). The coupling procedure was
28
Rink Resin Amino Acid Loading. Rink Novagel resin (0.10 mmol) was placed in a
pep-tide synthesis vessel and the resin was swelled in CH2Cl2 (10 mL) for 1 h. The solvent was
drained and the resin was washed with DMF (3 × 6 mL) then treated with 20%
piperi-dine/DMF (2 × 6 mL) allowing the solution to contact the resin for 10 minutes. The resin
was washed with DMF (5 × 6 mL) and a pre-mixed solution of Fmoc-protected amino acid
(0.50 mmol, 5 equiv), HBTU (190 mg, 0.5 mmol, 5 equiv), oxyma (71 mg, 0.5 mmol, 5
equiv) and DIPEA (174 µL, 1.0 mmol, 10 equiv) dissolved in DMF (4 mL) was added to
the resin. The contents were rocked gently for 1 h, then drained and the resin washed with
DMF (3 × 6 mL).
General Procedure for Manual Solid-Phase Peptide Synthesis
Solid-Phase Peptide Synthesis (SPPS). The resin-bound Fmoc-amino acid (0.1 mmol)
was washed with DMF (3 × 5 mL) and then treated with a solution of 20% piperidine/DMF
(2 × 6 mL) allowing each treatment to contact the resin for 5 minutes. The resin was washed
with DMF (5 × 6 mL), then a pre-mixed solution of Fmoc-protected amino acid (0.5 mmol,