CONTOURLET BASED TEXTURE
ANALYSIS AND CLASSIFICATION OF
MAMMOGRAM IMAGES
S.DEEPA*
Research Scholar, Department of ECE, Sathyabama University, Chennai,Tamilnadu, India
Dr.V.SUBBIAH BHARATHI
Principal, DMI College of Engineering Chennai, Tamilnadu,India
Abstract :
In this paper we have proposed a fully automated Computer Aided Diagnostic (CADx) system that can aid the radiologists in reading vast number of mammograms generated during screening procedures. The aim of the proposed system is to minimize the number of false positives and the number of false negatives. The remarkable potential of contourlet transform in extracting texture features of images with smooth contours is exploited in the proposed method. Mammogram images are taken from MIAS (Mammographic Image Analysis Society) database and a Probabilistic Neural Network (PNN) is trained to classify the image as normal, benign or malignant. The Region of Interest (ROI) of size 256 x 256 pixels is segmented from the mammogram image using Otsu’s N segmentation method and the Contourlet Coefficient Co-occurrence Matrix (CCCM) features are extracted. The texture feature set comprising the dominant features is fed to a PNN for the purpose of classification. To evaluate the efficiency of the proposed system 3 fold cross validation is performed and a classification accuracy of 91.1% is obtained. The performance of the proposed method is compared against other methods in terms of sensitivity, specificity and classification accuracy. The results obtained prove that the texture analysis of mammogram images using CCCM features outperforms other methods in terms of classification accuracy and hence can be successfully applied for the classification of mammogram images. Keywords : Mammogram, Contourlet transform, CCCM, PNN, Otsu’s N segmentation
1. INTRODUCTION
According to statistics, breast cancer is the most frequently diagnosed cancer and the leading cause of cancer death among females, accounting for 23% of the total cancer cases and 14% of the cancer deaths [Jemal et al.(2011)]. Mammography has been one of the most reliable methods for early detection of breast carcinomas. When breast cancer detection occurs before any spread, the five-year survival rate is 97% and as it spreads to the local lymph nodes the survival rate reduces to 76%. If it is detected after metastasis to other organs; the five-year survival rate is only 20% [Espey et al.(2007)].Thus earlier the cancer is detected the better the chances are for successful treatment and survival. Screening Mammography is a regular routine done annually for women with no symptom for early detection of breast cancers because it can show changes in the breast up to two years before a patient or physician can feel them. The screening programs generate vast number of mammograms which are to be carefully examined and major concern is the number of false negative errors, i.e. cases in which a mammogram containing a malignant tumour is classified as normal or benign. 10% to 30 % of cancer cases are missed during routine screening [Bird et al. (1992)] which necessitates the need for an efficient Computer Aided Diagnostic (CADx) system that can be used as a tool to assist the radiologists. Another major concern is the false positive errors where the normal mammogram is classified as abnormal leading to unnecessary biopsies. The analysis of mammography is a complex cognitive task that includes various aspects of medical expertise and conclusive clinical findings. Since mammograms are two-dimensional projections of the three-dimensional structure of the breast, overlapping structures cause a wide variation in glandular intensity. It cannot be assumed that all regions of glandular tissue will be significantly brighter than the surrounding fat, so it is appropriate to use texture, rather than intensity, as a primary classification method for breast tissue.
these primitives according to certain placement rules. Texture analysis using structural details is more suitable only when one is dealing with very regular textures, hence not a right option to analyse medical images. Statistical methods analyse the spatial distribution of gray values, by computing local features at each point in the image, and deriving a set of statistics from the distributions of the local features. The most widely used statistical methods are co-occurrence features and gray level differences which have inspired a variety of modifications later on. Model-based methods hypothesize the underlying texture process, constructing a parametric generative model, which could have created the observed intensity distribution. Morphology based methods make use of mathematical morphology which is an effective tool for extracting image components that are useful in the representation and description of texture features. Though morphology-based methods are relatively new they do not produce very good textural features as compared to the other methods.
Signal processing methods analyse the frequency content of the image. Spatial domain filters such as Laws masks (1980), local linear transforms proposed by Unser and Eden (1989), and various masks designed for edge detection (e.g. Roberts' and Sobel's operators ) are the most direct approach for capturing frequency information. Tuceryan (1992) used moment-based features successfully in texture segmentation. Various frequency domain methods also known as spectral methods are used for calculating multiscale textural features. Wavelet transforms [Wang and Yong (2008)] and Gabor wavelets [Tou et al. (2008)] are popular signal processing methods often used in texture classification combined with other methods. The major drawback for wavelets in two-dimensions is their limited ability in capturing directional information. To overcome this deficiency, researchers have recently considered multi-scale and directional representations that can capture the intrinsic geometrical structures. Some examples include the steerable pyramid, brushlets [Meyer and Coifman (1997), complex wavelets [Kingsbury (2001)], ridgelet transform [Chen and Bhattacharya (2006)], log polar transform, Radon transform [Liu et al (2009)] and the curvelet transform [Cand`es and Donoho (2000)]. Contourlets proposed by Do and Vetterli (2003, 2005) not only possess the main features of wavelets namely, multiscale and time-frequency localization, but also offer a high degree of directionality and anisotropy. Due to these properties contourlets are more efficient in capturing the textural details of images with smooth contours. Various texture based analysis techniques to classify mammograms are proposed in literature and to the authors’ knowledge in most of the papers the Region of Interest is manually cropped from the image and is subjected to further analysis. This makes the CADx system semi automatic in the sense human judgement is required to crop the ROI from the mammogram images. To overcome this disadvantage we have proposed a fully automated computer aided diagnostic system to classify digital mammogram images. The rest of this paper is organized as follows, section 2 explains the methods and materials used, section 3 discusses the results and section 4 contains the conclusion.
2. MATERIALS AND METHODS
The steps involved in the proposed method and the details of the case sample used for the study is discussed in detail.
2.1 Case sample
The MIAS database consists of mammogram images digitised at 50 micron pixel edge, which is reduced to 200 micron edge and clipped/padded so that every image is 1024 x 1024 pixels. It consists of left and right breast MLO (Medio Lateral Oblique) view mammogram images of 161patients. For certain patients two images of the same breast are provided constituting 330 images. Of the 330 images available in the database 207 images are normal, 69 images are benign (non-cancerous) and 54 images are malignant (cancerous). The nature of abnormality is further classified into six types viz., circumscribed masses, speculated masses, micro calcifications, architectural distortions, ill- defined masses and asymmetry.
2.2 ROI Segmentation
shows a sample benign mammogram image (mdb001), corresponding segmented images and the extracted ROI image. Figure 1c shows a sample malignant mammogram image (mdb239), corresponding segmented images and the extracted ROI image.
a) mdb037- Normal mammogram image
b) mdb001- Benign mammogram image
c) mdb239 – Malignant mammogram image
Figure 1. Mammogram Images, their corresponding Otsu’s N thresholded images and ROI
2.3 Feature Extraction
Figure 2. Contourlet decomposed ROI for n=3 [8 sub bands]
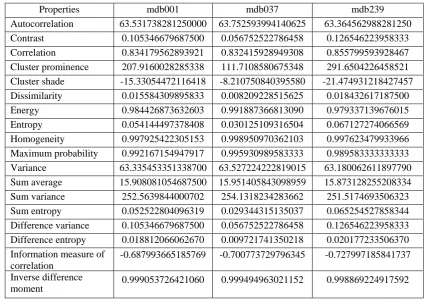
Table 1 shows the Contourlet Coefficient Co-occurrence Matrix (CCCM) features extracted for three different ROIs extracted from mammogram images.
Table 1.Contourlet Coefficient Co-occurrence Matrix features
Properties mdb001 mdb037 mdb239 Autocorrelation 63.531738281250000 63.752593994140625 63.364562988281250
Contrast 0.105346679687500 0.056752522786458 0.126546223958333
Correlation 0.834179562893921 0.832415928949308 0.855799593928467
Cluster prominence 207.9160028285338 111.7108580675348 291.6504226458521 Cluster shade -15.33054472116418 -8.210750840395580 -21.474931218427457
Dissimilarity 0.015584309895833 0.008209228515625 0.018432617187500
Energy 0.984426873632603 0.991887366813090 0.979337139676015
Entropy 0.054144497378408 0.030125109316504 0.067127274066569
Homogeneity 0.997925422305153 0.998950970362103 0.997623479933966
Maximum probability 0.992167154947917 0.995930989583333 0.989583333333333
Variance 63.335453351338700 63.527224222819015 63.180062611897790
Sum average 15.908081054687500 15.951405843098959 15.873128255208334 Sum variance 252.5639844000702 254.1318234283662 251.5174693506323 Sum entropy 0.052522804096319 0.029344315135037 0.065254527858344 Difference variance 0.105346679687500 0.056752522786458 0.126546223958333 Difference entropy 0.018812066062670 0.009721741350218 0.020177233506370 Information measure of
correlation
-0.687993665185769 -0.700773729796345 -0.727997185841737
Inverse difference
moment 0.999053726421060 0.999494963021152 0.998869224917592
2.4 PNN Classifier
exp (1)
Where
denotes the smoothing parameter,
denotes the neuron vector and
d denotes the dimension of the pattern vector x.
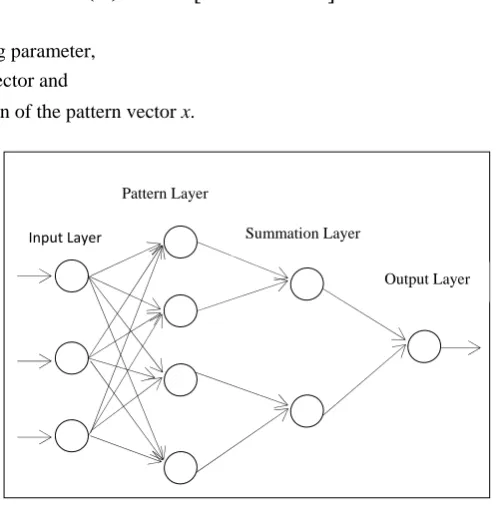
Figure 3. Probabilistic Neural Network Architecture
The summation layer neurons compute the maximum likelihood of pattern x being classified into Ciby summarizing and averaging the output of all neurons that belong to the same class using equation given below,
∑ exp (2)
Where is the total number of samples in class Ci. The decision layer unit classifies the pattern x in accordance with the Baye's decision rule based on the output of all the summation layer neurons by
, 1,2 … , (3)
Here C(x) denotes the estimated class of the pattern x and m is the total number of classes in the training samples.
3. Results and Discussion
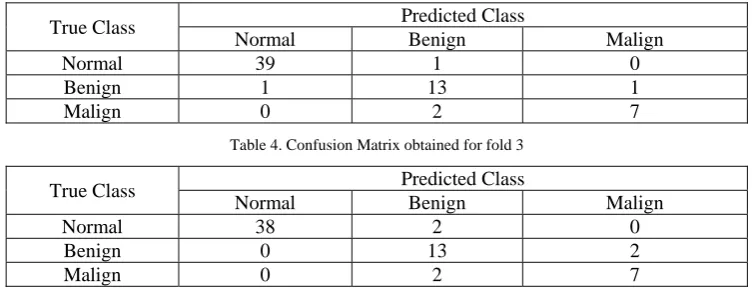
For our experimentation purpose we have used 192 mammogram images, of which 120 images are normal, 45 images are benign and 27 images are malignant. Abnormal images (benign and malignant) with abnormalities of type circumscribed masses, spiculated masses and micro calcifications are considered. To validate the performance of the proposed system 3 fold cross validation is done on the images.Cross-validation is a statistical method of evaluating and comparing learning algorithms by dividing data into two segments: one used to learn or train a model and the other used to validate the model. In 3 fold cross-validation the data is first partitioned into 3 equal sized segments and in the first iteration datasets 1&2 are used for training and 3rd dataset is used for testing, subsequently 2 iterations of training and validation are performed such that within each iteration a different fold of the data is held-out for validation while the remaining 2 folds are used for training the network. For each fold the confusion matrix is determined to know the number of correct classification and misclassification. Confusion Matrix is the matrix whose diagonal entries give the number of correctly classified images and the off diagonal entries give the number of misclassified images. The rows of the matrix describe the actual class and the columns describe the predicted class. Tables 2, 3 and 4 show the confusion matrix obtained for testing folds 1, 2 and 3 respectively.
Table 2. Confusion Matrix obtained for fold 1
True Class Predicted Class
Normal Benign Malign
Normal 38 2 0
Benign 0 13 2
Malign 0 2 7
Input Layer
Pattern Layer
Summation Layer
Table 3. Confusion Matrix obtained for fold 2
True Class Predicted Class
Normal Benign Malign
Normal 39 1 0
Benign 1 13 1
Malign 0 2 7
Table 4. Confusion Matrix obtained for fold 3
True Class Predicted Class
Normal Benign Malign
Normal 38 2 0
Benign 0 13 2
Malign 0 2 7
Classification accuracy for any diagnostic system can be defined as the number of images classified correctly with respect to the total number of images tested as given in equation (4)
.
. (4)
The classification accuracy of 90.6 %, 92.18 % and 90.6 % is obtained respectively for fold 1, 2 and 3 thus contributing to an average classification accuracy of 91.1 %. Since the dataset taken for validation and experimentation of various methods proposed in literatures differ from one another, a direct comparison of the results obtained is not possible. Hence to compare the performance of the proposed method with other methods we divided the dataset into training set and testing set. Table 5 shows the distribution of the training set and testing set used for the experimentation. The images are segmented to obtain the ROI and are subjected to various texture feature extraction techniques mentioned in the first column of table 6. Two statistical feature extraction methods: First Order Statistical (FOS) texture features & second order statistical texture features- the GLCM (Gray Level Co-occurrence Matrix) features and three transform based methods: DWT (Discrete Wavelet Transform) texture features, DTCWT (Dual Tree Complex Wavelet Transform) texture features and CCFOS (Contourlet Coefficient First Orders Statistics) features are taken into consideration. The PNN is trained using the features extracted from the training set and the test images are given as input to the classifier. The classifier classifies the image as normal, benign or malignant. Sensitivity and specificity are determined using the relations shown in equations (5) & (6).
, (5)
, (6)
Here TP refers to true positive, TN refers to True Negative, FP refers to False Positive and FN refers to False Negative. TP & TN indicate the number of correct classification and FP & FN indicated the number of misclassifications. Table 6 displays the performance metrics obtained using the various methods stated above and the metrics obtained using the proposed method is shown in bold.
Table 5. Distribution of the dataset
Class No. of training
samples
No. of testing samples
Normal 80 40 Benign 30 15
Malignant 18 9
Table 6. Comparison of results obtained
Method Normal Vs. Abnormal Benign Vs. Malignant
Sn Sp Acc (%) Sn Sp Acc( %)
FOS 0.71 0.88 81.25 0.67 0.73 70.83
GLCM 0.75 0.90 84.38 0.78 0.73 75.00
DWT 0.75 0.90 84.38 0.67 0.80 75.00
DTCWT 0.79 0.93 87.50 0.67 0.87 79.17
CCFOS 0.79 0.95 89.06 0.78 0.80 79.17
Results obtained show that the transform based methods perform better than statistical methods and the proposed method has achieved a classification accuracy of 92.18 %, the highest for the test data under consideration.
4. Conclusions
In this study, a texture based analysis of digital mammograms using contourlet coefficient co-occurrence matrix features is proposed. By segmenting the ROI automatically from the mammogram image using Otsu’s N thresholding method, the need for manual extraction of ROI is eliminated making the system fully automatic. The proposed method demonstrates the potential of contourlet transform and second order texture features (co-occurrence matrix features) for classification problems. The experimental dataset considered for this study consists of three types of mammogram images, normal, benign and malignant mammogram images taken from mini-MIAS database and a classification accuracy of 91.1% is achieved. The future work may include determining the type of abnormalities present in the mammogram and classify them further based on Breast Imaging-Reporting and Data System [ BIRADS].
References
[1] Bamberger R.H. and Smith M.J.T, “A filter bank for the directional decomposition of images: Theory and design,” IEEE Transactions
on Signal Processing, vol. 40, no. 4, pp. 882–893, 1992
[2] Bird R.E., Wallace T.W., and Yankaskas B.C., “Analysis of cancers missed at screening mammography”, 184(3):613-617, 1992.
[3] Burt P.J and Adelson E.H., “The Laplacian pyramid as a compact image code,” IEEE Transactions on Communications, vol. 31, no. 4,
pp. 532–540,1983.
[4] Cand`es E.J and Donoho D.L. “Curvelets – a surprisingly effective non adaptive representation for objects with edges”,Curve and
Surface Fitting, Saint-Malo: Vanderbilt University Press, 2000.
[5] Chen G.Y. and Bhattacharya P., “Invariant Texture Classification Using Ridgelet Packets”, 18th International Conference on Pattern
Recognition ICPR, Hongkong, 2006.
[6] Do M.N., and Vetterli M, “Contourlets”, Beyond Wavelets, G. V. Welland, Ed. New York:Academic Press, 2003.
[7] Do M.N., and Vetterli M, “The Contourlet Transform: An Efficient Directional Multiresolution Image Representation”, IEEE
Transactions on Image Processing, Vol. 14, No. 12, December 2005
[8] Espey D.K., Wu X.C., Swan J., Wiggins C., Jim M., Ward E., Wingo P.A., Howe H.L., Ries L.A.G., and Miller B.A., "Annual report
to the nation on the status of cancer, 1975–2004,featuring cancer in American Indians and Alaska Natives," Cancer, vol. 110, pp. 2119-2152,2007.
[9] Haralick R.M., Shanmugam K., and Dinstein I., “Textural features for image classification”, IEEE Transactions on Systems, Man
&Cybernatics,1973;SMC-3:610–21
[10] Jemal A., Bray F., Melissa M. Center, Jacques Ferlay, Elizabeth Ward, David Forman, “Global Cancer Statistics”, CA: A Cancer
Journal for Clinicians, vol. 61, pp.61-90, 2011.
[11] Kingsbury N., “Complex wavelets for shift invariant analysis and filtering of signals”, Journal of Applied and Computational
Harmonic Analysis, vol. 10, pp. 234–253, 2001.
[12] Laws, K. I., Textured Image Segmentation. Ph.D. thesis, University of Southern California, 1980.
[13] Liu G., Lin Z. and Yu Y., “Radon Representation-Based Feature Descriptor for Texture Classification,” IEEE Transactions on Image
Processing, vol. 18, no. 5, pp. 921-928, 2009.
[14] Mammographic Image Analysis Society, http://www.wiau.man.ac.uk/services/MIAS/MIASweb.html.
[15] Meyer F.G. and Coifman R.R., “Brushlets: A tool for directional image analysis and image compression,” Journal of Applied and
Computational Harmonic Analysis, vol. 5, pp. 147–187, 1997.
[16] Otsu N., “A Threshold Selection Method from Gray-level Histograms,” IEEE Transactions on Systems, Man & Cybernatics, Volume
9, Issue 1, pp: 62-66,1979,
[17] Peckingpaugh SH., “An improved method for computing gray-level co-occurrence matrix based texture measures”. Graph Model
Image Proc. pp. 574-80, 1991.
[18] Tou J.Y.,Tay Y.H., and Lau P.Y., “Gabor Filters as Feature Images for Covariance Matrix on Texture Classification Problem,” 15th
International Conference on Neural Information Processing ICONIP, vol. 5507, pp. 745-751, 2008.
[19] Tuceryan M., and Jain A.K., “Texture Analysis,” The Handbook of Pattern Recognition and Computer Vision (2nd Ed), World
Scientific Publishing, Singapore, pp. 207-248, 1998.
[20] Tuceryan, M, “Moment Based Texture Segmentation”,11th International Conference on Pattern Recognition, The Hague,
Netherlands,1992.
[21] Unser, M., Eden, M., “Multiresolution feature extraction and selection for texture segmentation”, IEEE Transactions on Pattern
Analysis, Vol. 2, 717–728,1989.
[22] Wang Z., and Yong J., “Texture Analysis and Classification with Linear Regression Model Based on Wavelet Transform,” IEEE