ANALYSIS FOR REDUCTION IN
PROCESS REJECTION OF PLASTIC
MOULDING JAR BY USING SIX SIGMA
METHODOLOGY
1
Shivani Solanki
Maharana Pratap College of Technology, Gwalior (M.P) India, *Corresponding author,
2
Prof. A. Bangar
HOD (ME), Maharana Pratap College of Technology, Gwalior (M.P) India
Abstract
This paper may be considered as a systematic and collective approach to reduce black dot rejection during manufacturing of Plastic Molding Jar. This paper covers the manufacturing process of Plastic Molding Jar as well as various operation of it.
We have tried to gather all data from Vimal Plastics Ltd Noida, manufacturer of Plastic Moulding Jar and analyzed it with the help of Six-Sigma Methodology and the quality control tools to reduce rejection. Keywords: Screw barrel cleaning, Six-Sigma Methodology.
1. INTRODUCTION
Currently in Vimal Plastics Parts Production Department which produce plastic products for Cosmetic Components as main business facing many rejection problems. The main defect cause this rejection is “Black dot” on the appearance of the product.
This paper presents systematic and collective approach to reduce the process rejection due to black dot appearance of the plastic molding jar. We have done the work at Vimal Plastics Ltd, Noida (Manufacturer of plastic moulding jar).
This paper is mainly focused on six sigma quality philosophy and other related philosophy that would be implemented in these studies in order to identify the current problem or rejection criteria facing by the company. The “Six Sigma” Philosophy used because, it provides a step-by-step quality improvement methodology that uses statistical methods to quantify variation.
Vimal Plastics, is known all over India for flip top and other injection molded cosmetic components. The main clients of the company are Baidyanath, Lotus Herbals, Hamdard, Oriflame, Modi Care, Reckitt Benckiser, Avon, Himalaya, Aimil, Bakson, Ranbaxy and Cipla.
2. METHODOLOGY
Six-Sigma is employed in a systematic project-oriented fashion through define, measure, analyze, improve, and control (DMAIC) cycle.
3. MANUFACTURING PROCESS
The manufacturing process of plastic molding jar is injection moulding cycle.
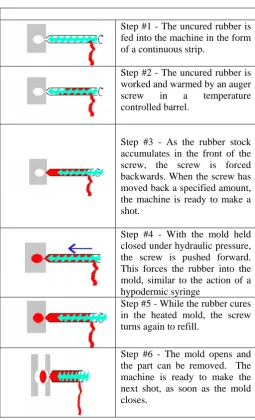
Table 1: Manufacturing Process of plastic moulding jar
Step #1 - The uncured rubber is fed into the machine in the form of a continuous strip.
Step #2 - The uncured rubber is worked and warmed by an auger screw in a temperature controlled barrel.
Step #3 - As the rubber stock accumulates in the front of the screw, the screw is forced backwards. When the screw has moved back a specified amount, the machine is ready to make a shot.
Step #4 - With the mold held closed under hydraulic pressure, the screw is pushed forward. This forces the rubber into the mold, similar to the action of a hypodermic syringe
Step #5 - While the rubber cures in the heated mold, the screw turns again to refill.
4. IDENTIFY THE CURRENT REJECTION PROBLEM
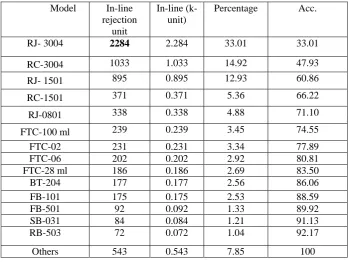
Table 2: In- line rejection based on part produced
Model In-line rejection
unit
In-line (k-unit)
Percentage Acc.
RJ- 3004 2284 2.284 33.01 33.01
RC-3004 1033 1.033 14.92 47.93
RJ- 1501 895 0.895 12.93 60.86
RC-1501 371 0.371 5.36 66.22
RJ-0801 338 0.338 4.88 71.10
FTC-100 ml 239 0.239 3.45 74.55
FTC-02 231 0.231 3.34 77.89
FTC-06 202 0.202 2.92 80.81
FTC-28 ml 186 0.186 2.69 83.50
BT-204 177 0.177 2.56 86.06
FB-101 175 0.175 2.53 88.59
FB-501 92 0.092 1.33 89.92
SB-031 84 0.084 1.21 91.13
RB-503 72 0.072 1.04 92.17
Others 543 0.543 7.85 100
Table 2 shows the rejection data for 60 tone injection Moulding for the month of May 2012. This data shows the highest rejection ratio compared to the pervious months rejection data. This shows that, part named ROUND JAR-3004 have the highest rejection rate for the month which is 2284 units and contributes 33.01 % of the total rejection rate. Since the part has the highest rejection rate it has been taken as the studying element for the research.
5. DMAIC METHODOLOGY: MEASURE
5.1. Calculation of defect per million opportunities (DPMO) for each month
Above table shows the total output, reject quantity, DPMO and sigma level for each month from June to September 2012.
It shows that the highest rejection rate was identified in the month June 2012 meanwhile for other months the data collected shows small variations.
5.2. Computation of Sigma level using the above database for four months June 12 to Sept 12
Total pieces manufactured=P = 149760
Total rejection =R = 2310
Total CTQ =O = 5
Defect per unit(DPU) =R/P = 0.0154247
DPO =DPU/CTQ = 0.0030849
Sigma level ( Z )
=0.8406+√{29.37- 2.221ln(DPMO)} = 4.2356
The figure below explains that the sigma level from the month June to September ranging from 4.2356 to 4.3301. This shows the average sigma level for the whole process is 4.242.
Figure 2: Sigma level from month June to September 2012
6. DMAIC METHODOLOGY: ANALYZE
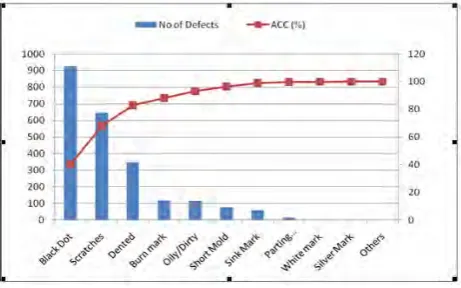
6.1. Rejection data based on the defect type for month June 2012
As a measure to track down the problem machine E03 will be used to analyze the root cause for the black dot defects since it shows the highest rejection rate and the analyze data will be used as references for other machine.
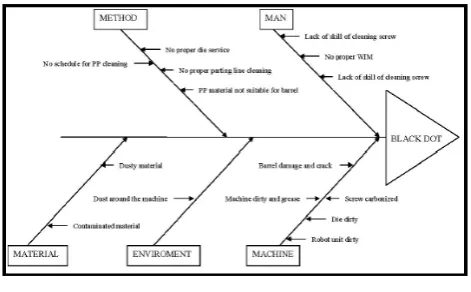
6.2. Cause and Effect/ Ishikawa Diagram
A cause and effect diagram is a tool that shows systematic relationship between a result or a symptom or an effect and its possible causes. This tool was devised by Dr. K. Ishikawa and is also known as Ishikawa diagram. The factors that influence threading are:
Man i.e. Operator
Machine i.e Plastic Molding Machine Material i.e. Moulding jar
Tools & Instruments i.e. Measuring Tools
Figure 4: Root causes analysis for black dot
After collecting and analyze the data, the identified defect was the black dot defect which caused major quality problem in the 60 tone injection Molding line.
7. DMAIC METHODOLOGY: IMPROVE 7.1. Modification to remove defects
Screw and barrel cleaning.
PP and special material for cleaning screw and barrel by purging. 7.2 Comparison of Special Cleaning material and PP Material
PP Material Special Material
1. Soft type, unable to purge out all the dirt/stain in barrel and screw.
1. hard type and easily remove dirt/stain in the barrel or screw.
2. When changing model especially for parts using material ABS and PS material not effective. Reason is because PP softer than PS and ABS material.
2. suitable to use during change model either from ABS to PS or other material.
3. Usage volume for this maerial is very high.
3. Usage volume for this material is much more lower.
4. Setting temperature for this material is more than 270 Celsius so needs more waiting time.
4. Setting temperature for this material almost same as the ABS and PS material around 230 Celsius.
7.3 Characteristic of cleaning agents
Minimize downtime & reduce scrap
Easy to use
Economical
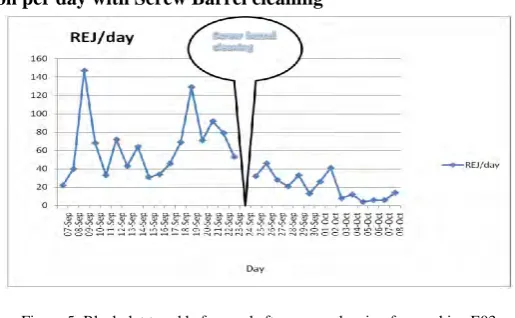
7.4 Total no. of rejection per day with Screw Barrel cleaning
Figure 5: Black dot trend before and after screw cleaning for machine E03
From fig.5 the analysis done for this paper, a conclusion can be made that machine condition is the major contributor for the black dot problem.
8. Result
The analyses have been done from figure 5 to reduce black dot defect by special cleaning agent. The rejection rate after modification is mentioned in table 3.
Table 3: R ejection Rate after Modification
The overall result compiled after this study at plastic injection part production line: 1. Current Sigma level 4.2356 increases to 4.3301.
2. Defects per million opportunities (DPMO) reduce from 3084.9 to 2301.1.
9. CONCLUSION
As we know, nowadays competition is very high & also increasing day by day. Thus to survive in the market the quality of the product must be high standard with minimum cost. In present work an effort has been done to reduce rejection rate because ultimately rejection plays an important role to decide cost & quality.
From the analysis done for this paper, a conclusion can be made that machine condition is the major contributor for the black dot problem.
Since the engineering group member cannot clean the injection screw or the barrel every day, a new cleaning materialagent is proposed to solve this problem. Total no. of rejection per day is reduced after cleaning of screw barrel.
Target of 3.4 defects per million opportunities as per six sigma quality strategy is not so easy. Selecting root cause of the problem & preventing the reoccurrence of any hindrances, company can achieve this goal. However Japanese have several goals like zero defects etc. and believe that all targets must be ambitious so as to stretch our abilities. Six sigma provides a structured methodology to achieve this goal.
Therefore if Indian industries have sincere approach for purpose they can surly reduce their rejects to this sigma level as per experience in this paper regarding six sigma.
10. REFERENCES
[1] Bendell, T (2006). “A review and comparison of six sigma and the lean Organizations.” Emerald Group Publishing Limited. Vol. 18
No. 3. pp. 255-262.
[2] Charles P.Q. (1998). “SPC Methods for Quality Improvement.” John Wiley & Sons, Inc.
[3] Costing, H. (1994). Readings in total quality management. Pp.11-12, 152-153, 321-329.
[4] Crosby, P. (1986). “Quality Improvement through Defect Prevention.” Philip Crosby Associates, Inc., Winter Park, FL.
[5] Deming, W.E. (1986). “Out of the Crisis”. MIT Center for Advanced Engineering Studies.
[6] Eckes. G, (2001). “The six sigma revolution.” New York. John Wiley & Sons.
Before Cleaning After Cleaning
1. The highest rejection per day is 147.
1.The highest rejection per day is 41.
2. The lowest rejection per day is 22.
[7] Evans, J.R. and Lindsay, W.M. (2002).”The Management and Control of Quality.” 5th edition, Thomson Learning, Stamford, CT.
[8] Evans, J.R. and Lindsay, W.M. (2005). “An Introduction to Six Sigma & Process Improvement.” Thomson South-western Publishing
Company, Cincinnati, OH.
[9] Feigenbaum, A.V. (1983). “Total Quality Control.” 3rd ed. McGraw-Hill. New York.
[10] Hagemeyer, C. and Gershenson, J.K. “Classification and application of problem solving quality tools.” The TQM Magazine. Vol. 18,
No. 5, pp. 455-483.
[11] Grant, E.L. and Leavenworth, R.S. (1988). “Statistical Quality Control.” 6th edition, McGraw-Hill.
[12] Gilbert, J.D. (1992), “TQM flops – a chance to learn from the mistakes of others.”, National Productivity Review, Autumn, pp. 491.
[13] General Electric (n.d.), “What is six sigma? The roadmap to customer impact.”, available at:
[www.ge.com/sixsigma/keyelements.html]
[14] Harry, M.J. and Schroeder, R. (2000). “Six Sigma: The Breakthrough Management Strategy Revolutionizing the World’s Top
Corporations.” Doubleday, New York.
[15] Henderson, Kim M., Evans and James, R. (2000). “Successful Implementation of Six-Sigma: Benchmarking General Electric
Company.” Benchmarking: An International Journal; Volume No. 7.
[16] Juran, J. (1989). “Juran on Leadership for Quality: An Executive Handbook.” Free Press, New York, NY.
[17] Mizuno, S. (Ed.), 1988. “Management for Quality Improvement: The7 New QC Tools.” Productivity Press, Cambridge, MA
(originally published in Japanese, 1979).
[18] P.B.Crosby (1979). Quality is Free. McGraw-Hill
[19] Peter S.P., Robert P.N., and Roland R.C. (2002). “The Six Sigma Way: An Implementation Guide for Process Improvement Teams.”
McGraw-Hill.
[20] Pyzdek, T. (2001). “The Six Sigma Handbook – A Complete Guidefor Greenbelts, Blackbelts and Managers at All Levels.”
MGraw-Hill, New York, NY.
[21] Raisinghani, M.S. (2005), “Six sigma: concepts, tools and applications”, Industrial Management & Data Systems, Vol. 105 No. 4, pp.
491-505.
[22] Sai Kim (2000). “Services Quality Six-Sigma case studies.” annual Quality Congress Proceedings 54.
[23] Sean P.G., CIT. “Understanding Six Sigma: Implications for Industry and Education.” Journal of Industrial Technology. Volume 20,
Number 4.
[24] Shewhart, W.A. (1980). “Economic Control of Quality Manufactured Product.” Van Nostrand.
[25] Smith, D., Blakeslee, J., and Koonce, R. (1999). “Strategic Six Sigma.” Wiley, Hoboken, NJ.
[26] Summers, D.C.S. (2003). “Quality.” 3rd edition. New Jersey. Prentice Hall. pp. 4-21, 54-101,618-624.
[27] Vimal Plastics part production, Injection moldings manual book.
Round Jar-3004 Machine No E03
DATE REJ/day
07-Sep-12 22
08-Sep-12 40
12-Sep-12 147
10-Sep-12 68
11-Sep-12 33
12-Sep-12 72 13-Sep-12 43
14-Sep-12 64
15-Sep-12 31
16-Sep-12 34
17-Sep-12 46
18-Sep-12 69
19-Sep-12 129
20-Sep-12 71
21-Sep-12 92
22-Sep-12 79
23-Sep-12 53
24-Sep-12 Screw barrel cleaning
25-Sep-12 32
26-Sep-12 46
27-Sep-12 28
28-Sep-12 21
29-Sep-12 33
30-Sep-12 13
01-Oct-12 26
02-Oct-12 41
03-Oct-12 8
04-Oct-12 12
05-Oct-12 4
06-Oct-12 6
07-Oct-12 6