In Iraq the problem of electricity shutdown in the main supply still exists and the cuts may last for hours. This shutdown causes problems in lectures and students experiments in the colleges because all electrical devices are off. PV system is a good alternative source to overcome such a problem; therefore a stand-alone photovoltaic power system is presented in this paper to supply department laboratories to ensure power continuity. A stand-alone PV system is presented to supply three laboratories selected as a case study, these laboratories belong to the electronic and communications engineering department, Al-Nahrain University, Baghdad. The loads for these laboratories were calculated based on what are exists already from electrical devices assuming that they were fully on during work time. The Pvsyst6 software package is used for simulation purposes in this work.
1. Introduction
The sun is an important source of alternative and clean energy since the energy density received from the sun about (1 kW/m2) at sea level. The process of generating electricity by solar energy does not need fuel, the costs of maintenance of the solar system is low, produce no pollution and no noise. Iraq is located in Asia in the southwestern part surrounded by the north of Turkey, from the south of Saudi Arabia and Kuwait, from the east of Iran and from the west surrounded by Saudi Arabia, Syria and Jordan. Iraq lies between latitudes 29o5’ and 37o22’ north, and between longitudes 38o45’ east and 48o45’. The area of Iraq is 435052 km2. The northern part of Iraq contains mountain ranges while the nature of the land in the southern and central part of it is flat so the atmosphere in central and southern Iraq is sunny most days of the year while in the
north, the atmosphere is less clear. The middle and south area of Iraq can be considered as one of the world maximum solar radiation regions. The western Iraq desert has the highest solar electricity generation power among the others in the region, as the global mean of 170 W/m2, the yearly cumulative global radiation for Baghdad is (2160–7000) MJ/m2 per year [1]. In Baghdad city the capital of Iraq the highest solar radiation received during June and July about (243 Wh/m2) while the lowest solar radiation received in December about (79 Wh/m2). Some studies such as AL-Riah et al. [2] analyzed the average monthly solar radiation for the period 1971–1985 in three main cities (Mosul, Baghdad and Nasiriyah), which are located in northern, central and southern of Iraq, respectively. The percentages numbers of solar radiation days were calculated for the purpose of evaluating the efficiency of solar systems in those cities. One of the most significant effects of the past 40 years in Iraq is the deterioration of the electrical grid and the lack of equipment. Until 2017, the Ministry of Electricity has been
on Energy Web
Research Article
Design and Simulation of Stand-alone PV System for
Electronic and Communications Engineering
Department
Laboratories in Al-Nahrain University
A.L.
Mahmood
Al-Nahrain University, College ofEngineering, Electronic and Communications Engineering Department,Baghdad, Iraq
Abstract
Keywords:Stand-alone, Photovoltaic, Renewable energy, PV system, Solar energy.
Received on 22 June 2018, accepted on 05 August 2018, published on 31 January 2019
Copyright © 2019 A.L. Mahmood et al., licensed to EAI. This is an open access article distributed under the terms of the Creative Commons Attribution licence (http://creativecommons.org/licenses/by/3.0/), which permits unlimited use, distribution and reproduction in any medium so long as the original work is properly cited.
doi: 10.4108/eai.13-7-2018.156438
*
Corresponding author. Email:[email protected],
unable to equip citizens with electricity more than 12 hours a day in most parts of the country. This sharp imbalance between supply and demand in the processing of electric power caused the transfer of Iraqi citizens to rely on personal and shared generators working with diesel and gasoline [3].
This dependence on generators caused a large consumption of fuel of poor quality, which caused a severe damage to the air quality and the Iraqi environment. The Iraqi citizen has begun to feel the environmental risks associated with pollutants from motor vehicles and generators [4, 5]. Reducing fossil fuel consumption is the biggest challenge that can be passed on by Iraq to the use of renewable energies in electricity generation [6]. Iraq has many renewable energies representing the most important solar energy and promising potential [7]. It is an available energy almost free of charge. Solar energy can be used to produce large amounts of electrical energy via solar concentrators or by using photoelectric cells. Iraq has a very distinguish location near the solar belt countries enables the country to receive a high quantity of solar radiation up to (6.5-7) kilowatt-hours/m2. Sun brightness ranges from 2,800 to 3,300 hours per year. The highest actual brightness of the sun is in June at 11.4 hours/day, and the lowest brightness in January by 6.3 hours / day [8]. Many investigations are carried out all over the world to study the design, operation, optimization and cost analysis of the stand-alone PV system for household electrification [9-11]. E. T. El Shenawy et al. [12] introduced the use of Solar (photovoltaic) energy to supply the electrical energy for a household of about 50 m2 in a rural area situated in Shalateen (Egypt), the design and installation of the stand-alone photovoltaic system according to the daily electrical load for the house and the irradiation data related to the location were detailed. Guda, H. A and Aliyu U. O. presented in [13] the detailed design of a stand-alone photovoltaic power system for a typical residential building in Bauchi, Nigeria with medium energy consumption is selected. Saleh. U. A. et al introduced in [14] the design of a standalone photovoltaic system as a power source for an ozone monitor Laboratory at Anyigba, North Central, Nigeria, the solar radiation data were obtained from Tropospheric Data Acquisition Network (TRODAN) project for the chosen location.
2. Stand-alone PV system
The stand-alone PV solar system that used in the companies and homes consists of solar panels, metal structure, batteries, inverter, wires, meters, charge controller, and circuit breakers as shown in Figure 1. These components are connected together at the work site. The battery comes in a strong, lightweight and corrosion-resistant cover to protect the harsh and severe weather conditions. This system provides an alternative source of energy in many cases and can be relied upon to provide clean, safe, and reliable energy.
The first step in the process of designing and sizing the stand-alone PV system is begin by knowing the monthly and
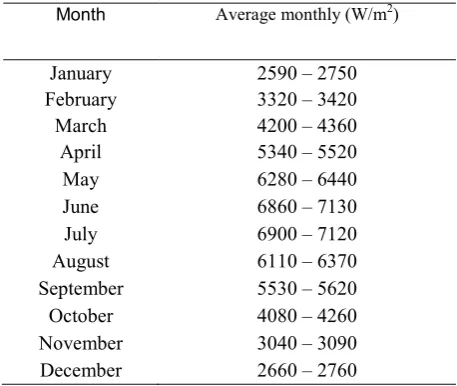
annual solar radiation values for the site and the amount of energy to be provided. One of the main things in the design is the process of providing meteorological data (solar radiation and temperature) to the system site (Baghdad) in order to obtain the best design for the solar system. Table 1 shows the average monthly values of solar radiation on the city of Baghdad and it is clear that the solar radiation falling on it has very high values, especially in the summer.
Figure 1.Stand-alone PV system.
While Table 2 shows the minimum and maximum temperature in Iraq for year 2016.
Table 1. The monthly average values of daily global solar radiation (W/m2) in Baghdad.
Month Average monthly (W/m2)
January 2590 – 2750
February 3320 – 3420
March 4200 – 4360
April 5340 – 5520
May 6280 – 6440
June 6860 – 7130
July 6900 – 7120
August 6110 – 6370
September 5530 – 5620
October 4080 – 4260
November 3040 – 3090
December 2660 – 2760
3. Electrical demand
proposed stand-alone system is on the surface of the building containing these laboratories.
Table 2. The monthly values of temperature in Iraq [8].
Month Minimum air
temperature Maximum air temperature
January 4.4oC 16oC
February 6oC 18.9oC
March 10.4oC 23.7oC
April 15.8oC 30.1oC
May 21.6oC 36.7oC
June 24.7oC 41.8oC
July 25.4oC 44.4oC
August 25.3oC 43.6oC
September 21.4oC 40.5oC
October 16.7oC 33.7oC
November 9.6oC 23.7oC
December 5.5oC 17.5oC
Figure 2.Department building and the suggested place for the PV system.
Figure 3 provides the monthly mean sunshine hours for Baghdad city, it is clearly indicates that it has high sunshine hours all year long, reaching 350-360 h/month in the summer and 200-210 h/month in the winter. The PV system must be correctly oriented to receive the maximum radiation levels over the year.
Table 3 illustrates the annually solar radiation with different tilt angles. It is obvious that the maximum annually solar radiation at tilt between 30° and 35°. This indicates that the yearly optimal tilt angle is approximately equal to the latitude of Baghdad (33.33°) [17].
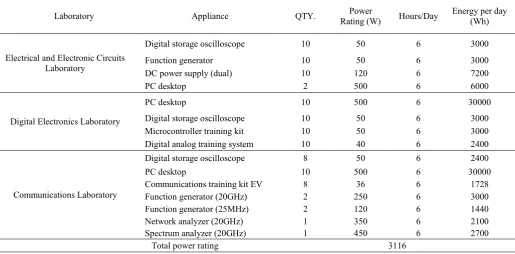
The electrical loads of the three laboratories include desktop computers, oscilloscopes, function generators, DC power supplies; different types of training kits, network and spectrum analyzers. The daily electrical demand for each device is shown in Table 4. It is assumed that these electrical devices for each laboratory are fully on during the
work time (from 8:30 am to 2:30 pm). Illuminations and air-conditioning were removed from the account because the work time is during the day and to reduce the electrical load also. The average daily load demand can be calculated from Table 4 to be 100968 Wh/day.
Figure 3. Monthly mean sunshine hours [16].
The best facing orientation panel is in south facing because the peak output power solar panel is maximum in south facing orientation since the sun path is proportionally perpendicular to solar panel [18]. However, a two axis solar radiation tracking algorithm is proposed by the author based on date and time for Baghdad city [19].
Table 3. Yearly solar radiation with different tilt angles [17].
Tilt angle Annually average radiation (kW/m2/day)
0o 5.3
10o 5.7
20o 6
30o 6.08
35o 6.04
40o 5.9
50o 5.6
60o 5.1
90o 2.8
3. PV system design
Table 4. Total energy requirement and power rating of the labs.
Laboratory Appliance QTY. Rating (W) Power Hours/Day Energy per day (Wh)
Electrical and Electronic Circuits Laboratory
Digital storage oscilloscope 10 50 6 3000
Function generator 10 50 6 3000
DC power supply (dual) 10 120 6 7200
PC desktop 2 500 6 6000
Digital Electronics Laboratory
PC desktop 10 500 6 30000
Digital storage oscilloscope 10 50 6 3000
Microcontroller training kit 10 50 6 3000
Digital analog training system 10 40 6 2400
Communications Laboratory
Digital storage oscilloscope 8 50 6 2400
PC desktop 10 500 6 30000
Communications training kit EV 8 36 6 1728
Function generator (20GHz) 2 250 6 3000
Function generator (25MHz) 2 120 6 1440
Network analyzer (20GHz) 1 350 6 2100
Spectrum analyzer (20GHz) 1 450 6 2700
Total power rating 3116
3.1 PV Sizing
The solar panel contains a set of PV cells connected in series and parallel, the electrical energy produced by this panel are insufficient to handle medium and large loads of energy. For the purpose of obtaining the voltages required for loads, a set of solar cell panels should be connected in series while the panels are connected in parallel to achieve the required current. However, before starting to calculate the number of series and parallel solar cell panels the following information should be determined:
• The system dc voltage (Vdc). • The average sun hours per day (Tsh).
• The average daily demand of energy in watt-hours (Ed).
The first step in calculating the number of solar panels begins by determining the average daily demand of energy (Ed) which is calculated by dividing the average daily demand by the product of efficiencies of all components in the system as given in equation (1) below [13].
𝐸𝐸𝑟𝑟𝑟𝑟= 𝐸𝐸𝑑𝑑
𝜂𝜂𝑏𝑏𝜂𝜂𝑖𝑖𝜂𝜂𝑐𝑐 (1)
Where ηb = battery efficiency
ηi = inverter efficiency
ηc = charge controller efficiency
The average peak power (Pave,peak) is then obtained by dividing the required daily average energy demand by the average sun hours of the site per day (Tsh) as:
𝑃𝑃𝑎𝑎𝑎𝑎𝑎𝑎,𝑝𝑝𝑎𝑎𝑎𝑎𝑝𝑝=𝐸𝐸𝑇𝑇𝑟𝑟𝑑𝑑𝑠𝑠ℎ (2)
The system dc current (Idc) is obtained by dividing the average peak power by the system dc voltage as:
𝐼𝐼𝑟𝑟𝑑𝑑=𝑃𝑃𝑎𝑎𝑎𝑎𝑎𝑎𝑉𝑉𝑑𝑑𝑐𝑐,𝑝𝑝𝑎𝑎𝑎𝑎𝑝𝑝 (3)
The number of modules in series (Nsm) is then obtained by dividing the system dc voltage by the rated voltage of each module (Vrm) as:
𝑁𝑁𝑠𝑠𝑠𝑠=𝑉𝑉𝑉𝑉𝑟𝑟𝑟𝑟𝑑𝑑𝑐𝑐 (4)
The numbers of parallel number of module strings (Npm) were obtained by dividing the total dc current of the system by the rated current of one module (Irm) as:
𝑁𝑁𝑝𝑝𝑠𝑠= 𝐼𝐼𝑑𝑑𝑐𝑐
𝐼𝐼𝑟𝑟𝑟𝑟 (5)
𝑁𝑁𝑡𝑡𝑠𝑠=𝑁𝑁𝑠𝑠𝑠𝑠×𝑁𝑁𝑝𝑝𝑠𝑠 (6)
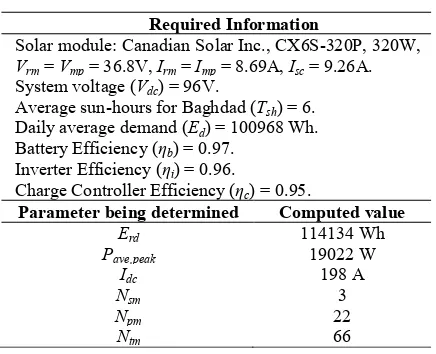
However, table 5 presents the PV array sizing procedure summary for the case study in this paper (i.e. three laboratories).
Table 5. Summary of PV array sizing.
Required Information
Solar module: Canadian Solar Inc., CX6S-320P, 320W, Vrm = Vmp = 36.8V, Irm = Imp = 8.69A, Isc = 9.26A. System voltage (Vdc) = 96V.
Average sun-hours for Baghdad (Tsh) = 6. Daily average demand (Ed) = 100968 Wh. Battery Efficiency (ηb) = 0.97.
Inverter Efficiency (ηi) = 0.96.
Charge Controller Efficiency (ηc) = 0.95.
Parameter being determined Computed value
Erd 114134 Wh
Pave,peak 19022 W
Idc 198 A
Nsm 3
Npm 22
Ntm 66
3.2 Battery Bank Sizing
Batteries used in solar systems must be of a deep cycle type, so it can be charged and discharged quickly for many times and for several years. Batteries must have high storage capacities to ensure that all loads are operated at night, rainy, and dusty days. To determine the required battery size, you must first determine the amount of estimated energy storage (Eest) required which is equal to the product of the daily average energy demand and the number of autonomy days (Daut) as in below [13].
𝐸𝐸𝑎𝑎𝑠𝑠𝑡𝑡=𝐸𝐸𝑟𝑟×𝐷𝐷𝑎𝑎𝑎𝑎𝑡𝑡 (7)
A safe energy storage (Esafe) is then computed by dividing the obtained estimated energy storage by maximum allowable depth of discharge (Ddisch) as given by:
𝐸𝐸𝑠𝑠𝑎𝑎𝑠𝑠𝑎𝑎= 𝐸𝐸𝑎𝑎𝑠𝑠𝑒𝑒
𝐷𝐷𝑑𝑑𝑖𝑖𝑠𝑠𝑐𝑐ℎ (8)
The total capacity of the batteries bank used in ampere-hours (Ctb) is calculated by dividing the safe energy storage over the dc voltage given by one battery (Vb) as:
𝐶𝐶𝑡𝑡𝑡𝑡=𝐸𝐸𝑠𝑠𝑎𝑎𝑠𝑠𝑎𝑎
𝑉𝑉𝑏𝑏 (9)
The total number of batteries (Ntb) can be calculated by dividing the total capacity of the batteries bank used in hours over the capacity of one battery in ampere-hours (Cb) as shown below:
𝑁𝑁𝑡𝑡𝑡𝑡=𝐶𝐶𝑒𝑒𝑏𝑏
𝐶𝐶𝑏𝑏 (10)
The number of batteries in series (Nsb) can now be determined by dividing the system dc voltage by the rated dc voltage of one battery as:
𝑁𝑁𝑠𝑠𝑡𝑡=𝑉𝑉𝑑𝑑𝑐𝑐
𝑉𝑉𝑏𝑏 (11)
The number of parallel battery strings (Npb) can be calculated by dividing the total number of batteries (Ntb) over the series number of batteries as below:
𝑁𝑁𝑝𝑝𝑡𝑡=𝑁𝑁𝑒𝑒𝑏𝑏
𝑁𝑁𝑠𝑠𝑏𝑏 (12)
Now Table 6 shows the battery bank sizing summary.
Table 6. Summary of battery bank sizing.
Required Information
Battery module: Rolls, 12-CS-11PS, Cb = 296 Ah, Vb = 12 V, Ddisch = 80% Battery Efficiency (ηb) = 0.97.
Number of Days of Autonomy (Daut) = 2.5 Days
Parameter being determined Computed value
Eest 252420 Wh
Esafe 315525 W
Ctb 26293 Ah
Ntb 88
Nsb 8
Npb 11
3.3 Charge Controller Sizing
The main function of the solar charge controller unit is to control the current values of the solar cells as well as the total current value of the load while ensuring that the voltages generated from the solar cells and load voltage are matched. The most important point in determining the capacity of the solar charge controller unit is its ability to withstand the total short circuit current of the array (𝐼𝐼𝑠𝑠𝑑𝑑𝐴𝐴 = 𝐼𝐼𝑠𝑠𝑑𝑑𝑀𝑀×𝑁𝑁𝑝𝑝𝑠𝑠) and a certain safe factor (Fsafe). The safe factor is necessary in order to allow for a reasonable system expansion. Thus, the desired charge controller current (Icc) is given by:
𝐼𝐼𝑑𝑑𝑑𝑑 =𝐼𝐼𝑠𝑠𝑑𝑑𝑀𝑀×𝑁𝑁
𝑝𝑝𝑠𝑠×𝐹𝐹𝑠𝑠𝑎𝑎𝑠𝑠𝑎𝑎 (13)
Table 7. Summary of charge controller sizing.
Required Information
Charge controller: Generic universal controller with MPPT converter, 96V
Icc = 704A
Charge Controller Efficiency (ηc) = 0.95. Safety factor (Fsafe) = 1.25
Parameter being determined Computed value
Icc required (Iccr) 254.7 A Number of charge controller
(Iccr/Icc) 1
4. System Simulation using Pvsyst6
Package
With simulation tools, as opposed to sizing tools, the user must specify the nature and size of each component. The tool then provides a detailed analysis of the behavior of the system. The accuracy of simulations in PVsyst, according to [20], depends strongly on the input meteorological data and simulation parameters decided by the user. In this work for the modeling, analysis and optimization, Pvsyst6 software is used. The software takes load demand and solar energy data and; models PV, converters and batteries with different sizes to match the demand. The system modeled in this study for department laboratories consists of PV system as power source. Pvsyst integrates pre-feasibility, sizing and simulation support for PV system. After having defined the location and loads, the user selects the different components from a product database and the software automatically calculates the size of each component.
The geographical location of the PV system using Google Earth (ground-level view) for the electronic and communications engineering department at Al-Nahrain University is listed in Table 8. As mentioned previously the stand-alone PV system is located on the surface of the department building as shown in Figure 2.
Table 8. The geographical locations of the PV system.
Latitude: 33o16’40.92” N Altitude: 41 Longitude: 44o22’30.23” E Time zone: +3
The meteorological data were taken from the available NASA-SEE databases in the PVsyst since there are no meteorological stations in Baghdad. In the Albedo – settings tab the Albedo values are selected as 0.3 for concrete surface. Selected parameters for tilt and azimuth angles for the system are listed in Table 9.
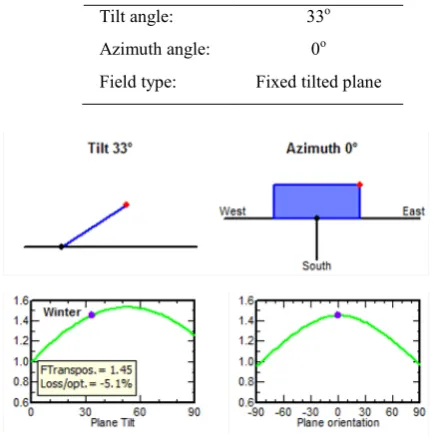
Figure 4 shows the optimization of the plane tilt and orientation implemented in PVsyst.
Table 9. Orientation parameters selected in PVsyst.
Tilt angle: 33o
Azimuth angle: 0o
Field type: Fixed tilted plane
Figure 4. Tilt and azimuth angle selection in PVsyst.
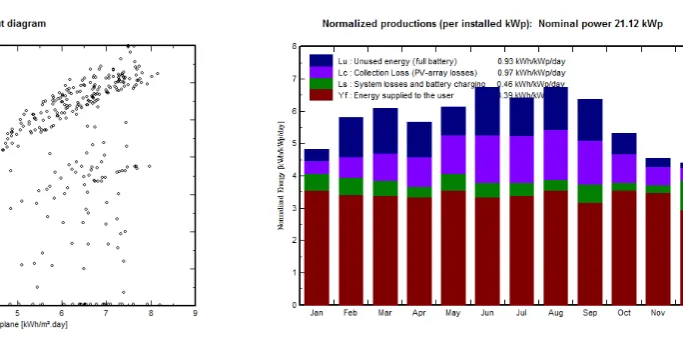
South is 0o according to figure 4, which is the definition of the azimuth angles in PVsyst. The PV modules selected for this study is a Canadian Solar Inc. (CX6S-320P) 320W, 31V poly-silicon, while the battery set selected is Rolls, 12-CS-11PS, 12V, 296Ah. However, table 10 shows selected parts from the final report given by the PVsyst simulation program. The solar path horizon at Baghdad city is shown in figure 5. Figures 6 and 7 gives the results of the simulations for daily generated power and normalized productions respectively.
Table 10 Simulation results for the proposed PV system.
However, some websites can give you a preliminary design according to the required kWh/day you need, one of these websites is https://www.altestore.com. By using the off-grid calculator of this site with required daily electrical energy (EL) of 100968 kWh/day, 320W solar panel, 2.5 cloudy days, and 6 average sun-hours the calculator gives you 69 panels.
5. Economic Analysis
The most valuable statistical evaluation tool for the economic behaviour of energy systems is life cycle cost (LCC) analysis. In renewable energy systems, it covers all system life stages; capital cost and initialization stage, operation & maintenance stage and the replacement stage [21]. The initial capital cost of any system is the cost required for purchasing all system components; this includes PV arrays, storage system, charge controller, inverter and installation (including wiring and other auxiliaries). Operation and maintenance costs (OMC) include annual periodic expenses for system management, regular maintenance and site supervision. For continuous operation and to ensure efficient system performance, some parts of the system must be replaced periodically. Storage batteries in any PV system need to be replaced every 5-10 years according to the battery type and the operating conditions. In life cycle analysis, the analysis must be carried out according to the longest life component of all system parts. The optimum life cycle of the PV modules used is around 25 years, whereas the life cycle of the storage batteries can run up to 10 years. Given a maximum life cycle of 25 years, the batteries will need to be replaced every 10 years. For future estimations, two important parameters must be considered; the inflation rate and the discount rate. Inflation rate represents the escalation trend in the costs over the all system life, while the discount rate represents the decrease in the components cost with future mass production.
The PV module costs (PVC) is $400, while the storage batteries cost (BC) is $1000. The inverter (InvC) and charge controller (CC) costs $2000 for each one. For the PV arrays life cycle of 25 years and the 10 years battery life, the installation cost (IC) is 10% of the PV cost while the annual (OMC) cost is 2% of the PV initial cost. Given an inflation rate (i) of 4% and discount rate (d) of 8%, the system life cycle cost and the unit electrical cost can be estimated.
The annual (OMC) costs can be calculated depending on the system capital cost taking into consideration the inflation and discount rates, as follows [12];
𝑂𝑂𝑂𝑂𝐶𝐶 = 2%𝑃𝑃𝑃𝑃𝐶𝐶×�1+𝑟𝑟1+𝑖𝑖� �1−�
1+𝑖𝑖 1+𝑑𝑑�
25
1−�1+𝑑𝑑1+𝑖𝑖� � (14) Since the battery life is considered 10 years, it must be replaced twice in the system’s lifetime. The battery replacement costs are calculated for first time after 10 years and for second replacement after 20 years as follows [12, 22];
𝐵𝐵𝐶𝐶1 =𝐵𝐵𝐶𝐶�1+𝑟𝑟1+𝑖𝑖�10
𝐵𝐵𝐶𝐶2 =𝐵𝐵𝐶𝐶�1+𝑟𝑟1+𝑖𝑖�20 (15)
The system’s life cycle cost can be calculated by adding the PV, battery, battery replacements, inverter, controller, installation, operation and maintenance costs [12].
𝐿𝐿𝐶𝐶𝐶𝐶 =𝑃𝑃𝑃𝑃𝐶𝐶+𝐵𝐵𝐶𝐶1+𝐵𝐵𝐶𝐶2+𝐼𝐼𝐼𝐼𝐼𝐼𝐶𝐶+𝐶𝐶𝐶𝐶+𝐼𝐼𝐶𝐶+𝑂𝑂𝑂𝑂𝐶𝐶 (16)
The annual life cycle cost (ALCC) can be estimated as follows [22];
𝐴𝐴𝐿𝐿𝐶𝐶𝐶𝐶=𝐿𝐿𝐶𝐶𝐶𝐶� 1−�1+d1+i�
1−�1+d1+i�25� (17) The unit electrical cost (UC) in $/kWh can be estimated from the annual life cycle cost and the annual energy generated by the PV system [23];
𝑈𝑈𝐶𝐶= 365×𝐸𝐸𝐴𝐴𝐴𝐴𝐶𝐶𝐶𝐶𝐿𝐿 (18)
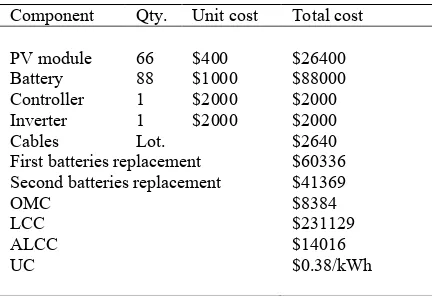
Where EL is the daily required electrical energy for the household, kWh/day. According to the above methodology, table 11 summarizes the cost analysis of the PV system, the costs of Cables, Design, Metering and Control Devices are lamped together as 10% of equipment cost.
Table 11: Cost estimate of the PV system components.
Component Qty. Unit cost Total cost
PV module 66 $400 $26400
Battery 88 $1000 $88000
Controller 1 $2000 $2000
Inverter 1 $2000 $2000
Cables Lot. $2640
First batteries replacement $60336 Second batteries replacement $41369
OMC $8384
LCC $231129
ALCC $14016
UC $0.38/kWh
6. Conclusions
The electricity generation in Iraq has a setback since 1991 due to wave of destruction of major generating stations, while in 2003 another major disruption and sabotage have started with further shortages of electrical power supply. The shortages cause daily blackout maintained for more than 18–8 h minimum. Iraq can benefit from large solar potentials by using its various applications. The study reviewed scientific research in the field of solar energy application in Iraq found that its field is wide and its potential is great in Iraq. In this work, a 21.12 kWp stand-alone photovoltaic system was suggested to supply three laboratories in the college of engineering in Baghdad city to supply the loads during the work time (from 8:30 am to 2:30 pm). The calculations of the proposed PV system were compared with the simulated results obtained from the PVsyst6 simulation package using the data obtained from NASA-SEE databases Satellites observations for Baghdad. Fairly good agreement between calculated and simulated values suggests that the model can be employed to supply these laboratories. The economic analysis shows that the used energy cost $0.38/kWh which is small cost as compared to other alternatives such as diesel generator. The power calculation of 100kW diesel generator run 6 hours 5 days in the week using https://power-calculation.com
website shows that the used energy cost $0.48/kWh. The PVsyst simulation shows that the proposed PV system saved 646.940 tons in CO2 emissions during 25 years.
References
[1] Fayadh M. Abed, Y. Al-Douri, Ghazy. M.Y. Al-Shahery. (2014) “Review on the energy and renewable energy status in Iraq: The outlooks”. Renewable and Sustainable Energy
Reviews, 39: 816–827.
[2] AL-Riahi M, AL-Hamdani N, AL-Saffar H. (1992) “Some aspects of solar radiation climatology of Iraq”. Renew
Energy, 2: 167–73.
[3] Chaichan M T and Kazem H A. (2012) “Status and future prospects of renewable energy in Iraq”. Renewable and
Sustainable Energy Reviews, 16 (1): pp. 6007–6012.
[4] Al-Waeely A A, Salman S D, Abdol-Reza W K, Chaichan M T, Kazem H A and Al-Jibori H S S. (2014) “Evaluation of the spatial distribution of shared electrical generators and their environmental effects at Al-Sader City-Baghdad-Iraq”. International Journal of Engineering & Technology
IJET-IJENS, 14 (2): 16-23.
[5] Chaichan M T, Kazem H A, Abid T A. (2016) “The Environmental Impact of Transportation in Baghdad, Iraq”.
Environment, Development and Sustainability, 18 (6), DOI:
10.1007/ s10668-016-9900-x.
[6] Chaichan M T and Al-Asadi K A H. (2015) “Environmental Impact Assessment of traffic in Oman”, International Journal
of Scientific & Engineering Research, 6 (7): 493-496.
[7] Abdmouleh Z, Alammari R A M, Gastli A. (2015) “Recommendations on renewable energy policies for the GCC countries”, Renewable and Sustainable Energy
Reviews, 50:1181-1191.
[8] Khaleel Ibrahim Abass. (2017) “Is Iraq Ready to Use Solar Energy Applications: A Review”. International Journal of
Engineering Science Invention, 6 (10): 27-42.
[9] Yuehong Lu, Shengwei Wang and Kui Shan. (2015) “Design optimization and optimal control of grid-connected and standalone nearly/net zero energy buildings”, Applied
Energy, 155:463–477.
[10] G. Kamalapur and R. Udaykumar. (2011) “Rural electrification in India and feasibility of photovoltaic solar home systems”, International Journal of Electrical Power &
Energy Systems, 33: 594-599.
[11] S. Shaahid and M. Elhadidy. (2008) “Economic analysis of hybrid photovoltaic–diesel–battery power systems for residential loads in hot regions—A step to clean future”.
Renewable and Sustainable Energy Reviews, 12: 488-503.
[12] E. T. El Shenawy, A. H. Hegazy and M. Abdellatef. (2017) “Design and Optimization of Stand-alone PV System for Egyptian Rural Communities”. International Journal of
Applied Engineering Research, 12 (20): 10433-10446.
[13] Guda, H. A and Aliyu U. O. (2015) “Design of a Stand-Alone Photovoltaic System for a Residence in Bauchi”.
International Journal of Engineering and Technology, 5 (1):
34-44.
[14] Saleh.U.A, Y.S. Haruna, and F.I Onuigbo. (2015) “Design and Procedure for Stand-Alone Photovoltaic Power System for Ozone Monitor Laboratory at Anyigba, North Central Nigeria” International Journal of Engineering Science and
Innovative Technology, 4 (6): 41-52.
[15] Hussain Z. Ali, Ali. M. AL-Salihi, Ahmed. K. AL-Abodee. (2016) “Mapping Monthly Average Global Solar Radiation over Iraq Using GIS and Heliosat Model”. International
Journal of Computers & Technology, 15 (5): 6724-6731.
[16] https://weather-and-climate.com/
average-monthly-Rainfall-Temperature-Sunshine,baghd-d,Iraq
[17] Afaneen A. Abbood, Mohammed A. Salih, Hasan N. Muslim. (2017) “Management of electricity peak load for residential sector in Baghdad city by using solar generation”.
International Journal of Energy and Environment, 8 (1):
63-72.
[18] Emad Jaleel Mahdi, Sahib Nama Abdul-Wahid, Sarmad Shaker Abdulstar, Sabiha A. Sahab, and Asmaa Hassan Mosli. (2011) “Optimum Orientation of Solar Panels in Baghdad city”. Journal of Basrah Researches ((Sciences)), 37
(3).
[19] Anas Lateef Mahmood. (2018) “Date/Time Operated Two Axis Solar Radiation Tracking System for Baghdad City”,
International Journal of Applied Engineering Research, 13
(7): 5534-5537.
[20] A. Mermoud. (Published: 2014-04-22) “What is the accuracy of the pvsyst simulation results?” http:// forum.pvsyst.com/viewtopic.php?f=30&t=1649. [21] A. Roy and M. A. Kabir. (2012) “Relative life cycle
economic analysis of stand-alone solar PV and fossil fuel powered systems in Bangladesh with regard to load demand and market controlling factors”. Renewable and Sustainable
Energy Reviews, 16: 4629-4637.
[22] A. Ghafoor and A. Munir. (2015) “Design and economics analysis of an off-grid PV system for household electrification”. Renewable and Sustainable Energy Reviews,
42: 496-502.
[23] K. Bataineh and D. Dalalah. (2012) “Optimal configuration for design of stand-alone PV system”. Smart Grid and
![Table 2. The monthly values of temperature in Iraq [8].](https://thumb-us.123doks.com/thumbv2/123dok_us/8416943.1692663/3.595.43.297.160.502/table-monthly-values-temperature-iraq.webp)