Cervical Cancer Detection and
Classification Using Texture Analysis
M.K. SOUMYA, K. SNEHA
and C. ARUNVINODH
Department of Computer Science & Engineering,
Royal College of Engineering & Technology, Akkikavu, Calicut University, India
*Corresponding author E-mail: [email protected] http://dx.doi.org/10.13005/bpj/988
(Received: April 13, 2016; accepted: June 16, 2016) ABSTRACT
Cervical cancer is one of the deadliest cancer among women. The main problem with cervical cancer is that it cannot be identified in its early stages since it doesn’t show any symptoms until the final stages. Therefore the accurate staging will help to give the accurate treatment volume to the patient. Some diagnosing tools like X-ray, CT, MRI, etc. can be used with image processing techniques to get the staging of disease. Transform features such as contourlet and Gabor features mainly based on energy are used for the prediction of output. Second-order statistical features based on contrast, correlation, energy and homogeneity are significantly used to predict outcome from pre-treatment MR images of cervical cancer tumors. This paper proposes a classification technique using Magnetic Resonance Images(MRI) to obtain the staging of cervical cancer patients.
Key words: Cervical cancer, Magnetic resonance imaging (MRI), Texture analysis, GLCM, Gabor, Contourlet, classification, SVM.
INTRODUCTION
Cervical cancer has become one of the major causes of cancer death among women worldwide. This can be cured in its earlier stage. For most of the cases it shows symptoms only in the advanced stages. Cervical cancer is a cancer arising from the cervix. Cancer is due to the abnormal growth of cells that have the ability to invade or spread to other parts of the body. Studies have found that infection with the virus called HPV (Human papillomavirus)1 is the cause of almost all
cervical cancers.
Magnetic Resonance Imaging (MRI) is a widely-used method of high quality medical imaging. The soft tissue contrast and non-invasiveness are the important advantages of MRIs. The radiologist examined the MRI to identify the presence of tumor abnormal tissues. The shortage
of radiologist, the time conception and the misinterpretations caused by viewing the MRI through the naked eye called out for an automated system to analyze and classify medical images. This paper proposes a classification model with MR Images, with the help of texture analysis techniques and support vector machine (SVM) classification.
In the paper titled New Features of Cervical Cells for Cervical Cancer Diagnostic System Using Neural Network. by Mustafa et al.3, it
has been stated that though Pap test is the most popular and effective test for cervical cancer, Pap test does not always produce good diagnostic performance. In the paper Preprocessing for Automating Early Detection of Cervical Cancer, by Debasis Bhattacharyya et al.4 states that In
information can muddle automatic identification of the tissues within the cervix. Asselin et al.,5 discuss
the imaging methods available to provide appropriate biomarkers of tumor structure and function using selective regions of interest (ROI), Cluster analysis and Histogram analysis. Turid Torheim et al.,6 present the paper with texture
analysis methods and classification by using SVM to identify the cured and relapsed images. S. Jagadeeswari and S. Malarkhodi7 presented a
paper on classification by using an Artificial Neural Network to identify the normal and abnormal tumor images with Fourier transform and Gaussian low pass filter. Rupinderpal and Rajneet8 presented a
noise removal method using discrete wavelet transform.
Texture analysis
Texture analysis19 describes a variety of
image-analysis techniques that quantify the variation in surface intensity or patterns. Some are imperceptible to the human visual system. Texture analysis may be particularly well-suited for the longitudinal monitoring of disease or recovery and for lesion segmentation and characterization. Texture analysis Approaches are usually classified into
• structural, • statistical, • model-based and • transform methods.
The structural approaches represent texture by well-defined primitives and a hierarchy of spatial arrangements of those primitives. For describing the texture, one must define the primitives and the placement rules. Providing an honest symbolic description of the image is the main advantage of the this approach This feature is more useful for synthesis than analysis tasks.
Statistical approaches do not arrange to perceive expressly the hierarchical structure of the texture They represent the texture indirectly with the non-deterministic properties that govern the distributions and relationships between the grey levels of an image. Most popular second-order statistical features for texture analysis are derived from the co-occurrence matr ix. They were demonstrated to feature a potential for effective
texture discrimination in biomedical. The approach supported multidimensional co-occurrence matrices was recently shown to surpass wavelet packets (a transform-based technique) when applied to texture classification.
The model based texture analysis using fractal and stochastic models, attempt to interpret an image texture by use of, generative image model and stochastic model. Parameters of the model are estimated and then used for image analysis. The fractal model17 has been shown to be useful for
modeling some natural textures. It can be used also for texture analysis and discrimination.
Transform methods of texture analysis represent an image in a space whose co-ordinate system has an interpretation which is closely related to the characteristics of a texture (such as frequency or size). Examples are Fourier ,Gabor and wavelet transforms. Due to the lack of spatial localization, methods based on the Fourier transform perform poor in practice. Gabor filters provide means for better spatial localization.
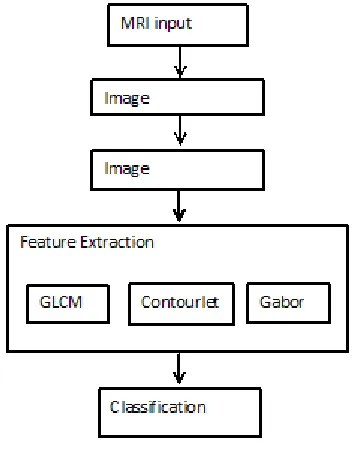
Proposed method
Magnetic Resonance Images (MRI)[9] of locally advanced cervical cancer patients are taken for this work. The block diagram of the proposed method is shown in fig 1. These are preprocessed using contrast enhancement and segmentation techniques along with the morphological operations such as erosion and dilation. Features are then extracted by first order statistical features and second order grey level co-occurrence matrix (GLCM). Finally the SVM classifier will predict the treatment outcome of the patient is cured or relapsed.
MRI Dataset
is taken as the input to this work. Convert the image into gray scale and remove the noise and improve the image quality to get more surety and ease in detecting the tumor. The dataset consist of magnetic resonance images of 24 patients with locally advanced cervical cancer. The three datasets, axial T1and T2-weighted images and sagital T2-weighted images are considered for this work.
Algorithm
Step 1 Input the MR image.
Step 2 Enhance the MR image using Adaptive gamma correction method.
Step 3 The enhanced image is then segmented using Otsu’s segmentation technique. Step 4: Features are now extracted using 3
methods:
1. Grey level co-occurrence matrix (GLCM) features are extracted
2. Contourlet transforms feature extraction 3. Gabor filter feature extraction
Step 5 Classification of the image is done using Support vector machine (SVM) classifier. Step 6 Staging of each image is the resultant
output. Pre processing
It is the first step in our proposed technique. Acquired images are then preprocessed using the following methods.
Image enhancement
Enhancement improves the brightness of dimmed images via the gamma correction and probability distribution of luminance pixels. The enhancement techniques are classified into two: direct enhancement methods and indirect enhancement methods. In direct enhancement methods, the image contrast can be directly defined by a specific contrast term. In indirect enhancement methods attempt to enhance image contrast by redistributing the probability density. The adaptive gamma correction (AGC)9 is formulated as follows:
(1)
Gamma parameters calculated as:
...(2) The image contrast can be enhanced robotically by Gamma correction, which is a non-linear operation. Gamma correction is used for correcting lightness or the darkness of image[4]. Image brightness can be corrected according to the gamma value only. Range of Gamma value is from 0.0 to 10.0. If the gamma value is less than 1.0(<1.0), then the image gets darken. Else if the gamma value is greater than 1.0(>1.0), the image gets lighten. Else gamma value is equal to 1, then no changes in an image. Gamma is applied only for display images not to the data of image.
The AGC method can progressively increase the low intensity and avoid the significant decrement of the high intensity. Three major process of gamma correction are:
• Histogram analysis – It provides the spatial information of an input image.
• Weighting distribution – It is used to even the irregular occurrence and thus avoid generation of inauspicious artifacts. • Gamma correction – It can robotically
enhance the image. Image segmentation
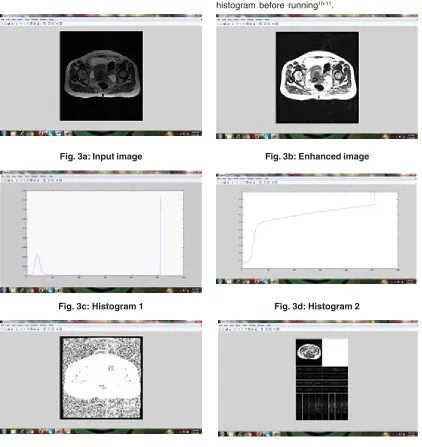
Fig. 3c: Histogram 1
Fig. 3a: Input image Fig. 3b: Enhanced image
Fig. 3d: Histogram 2
Fig. 3f: Contourlet feature Fig. 3e: Segmented Image
change the representation of an image into something that is more meaningful and easier to analyze. The methods are categorized on the basis of two properties discontinuity and similarity. Based on this property image segmentation is categorized as Edged based segmentation and region based segmentation. The segmentation methods that are based on discontinuity property of pixels are considered as boundary or edges based techniques. The region based segmentation is partitioning of an image into similar areas of connected pixels. There are different type of the
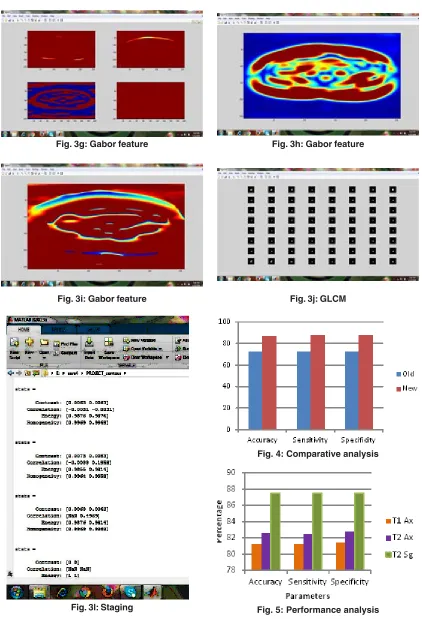
Fig. 3h: Gabor feature Fig. 3g: Gabor feature
Fig. 3i: Gabor feature Fig. 3j: GLCM
Fig. 3l: Staging
Fig. 5: Performance analysis Fig. 4: Comparative analysis
Feature extraction
Reducing the amount of resources needed to describe a huge set of data are called feature extraction. The features used for the proposed system are statistical glcm features and transform features such as contourlet and gabor [12].
Gray level co-occurrence matrix
The spatial gray level co-occurrence estimates image properties related to second-order statistics which considers the relationship among pixels or groups of pixels. The GLCM functions characterize the texture of an image by calculating how often pairs of pixel with specific values and in a specified spatial relationship occur in an image, creating a GLCM, and then extracting statistical measures from this matrix. The Grey-level Co-occurrence Matrices (GLCM) [14] has been widely used for various texture analysis implementations and it has provided satisfying results. For generating texture features the co-occurrence probabilities provide a second-order method. However, the GLCM method involves extensive calculations. Each GLCM generated will be 256 × 256 in size, when all 256 grey levels are being used to generate the GLCMs. The GLCM will be used to extract textural features where the calculations of each element in GLCM is involved, therefore larger the size, the more calculations are performed.
Second-order statistical texture features can be calculated from the grey level co-occurrence matrix. These features are descriptions of textures in the original image. The four features contrast, correlation, energy, and homogeneity were used in this study.
Contourlet features
The Contourlet transform that was instructed by Do and Vetterli in 2002, could be a new 2-dimensional transform methodology for image representations. The Contourlet transform has properties of multi resolution, localization, radial asymmetry important, specimen and property which means could be a methodology of enhancing the image quality of textures on surfaces that square measure far and steeply angular with relevance the purpose of read. Its basic functions are multiscale and multi-dimensional. In the contourlet transform,
a Laplacian pyramid is employed in the first stage, while directional filter banks (DFB) are used in the angular decomposition stage.
The essential objective of the contourlet development was to acquire inadequate extension for average pictures that are piecewise smooth far from charming shapes. Contourlet were developed as an improvement over wavelets in terms of its ineffectiveness. The resulting transform has the multiscale and time-frequency-localization properties of wavelets, however conjointly offers a high degree of radial asymmetry and property. Specifically, contourlet transform involves basis functions that are oriented at any power of 2’s number of directions with versatile side. With such a fashionable set of basic functions, Contourlet will represent a smooth contour with fewer coefficients compared with wavelets. Using Contourlet for Edge Detection Our approach involves taking the contourlet transform of test grey scale images and detects the edges more accurately.
The edge detection algorithm is as follows: 1. Take the contourlet transform of the image. 2. Choose a scale factor to use, and truncate
all other coefficients. 3. Invert the transform.
4. Threshold using the mean of the pixel values of the image.
Gabor features
Gabor filter features are widely used for the extraction of features from the images. The Gabor filter wavelets are in the form of sine wave modulated by the Gaussian coefficient. The Gabor filters are used in documents analysis, texture segmentation, image representation, edge detection and image coding etc. It provides optimal resolution in space and time domains. Also it provides better visual representation in the comprised texture images.
phase (Õ) would be more beneficial than any other, so the phase shift can be removed to define the Gabor filter function in a more compact form (3).
...(3) Finally, a normalized 1-D Gabor filter function can be defined (f0 = f) as
...(4) It is straightforward to generalize the filter in one to two dimensions where the time variable t is replaced by the spatial coordinates (x, y) and the frequency variable u by the frequency variable pair (u, v) and this was presented in the late 70’s. If similar studies in optics are not considered, the major effort to the development and use of 2-D Gabor filters has been made in image processing and especially in feature extraction. The normalized 2-D Gabor filter function in the frequency domain is eq.5 where f is the central frequency of the filter, the rotation angle of the Gaussian major axis and the plane wave,
γthe sharpness along the major axis, and η the sharpness along the minor axis (perpendicular to the wave).
...(5)
Where .
Classification
Support vector machines (SVMs) [15] are a set of related supervised learning methods used for classification and regression. Support Vector Machine (SVM) is a regression prediction and classification tool that uses machine learning theory for maximizing predictive accuracy while avoiding over-fit to the data automatically. Support vector machines (SVM) seeks to find the optimal separating hyper plane between classes, by choosing the hyper plane with the maximal margin. Classification in SVM is an example of Supervised Learning. To check whether the system is performing in a right way or not is indicated by the help of known labels. This information points to a desired response, validating the accuracy of the system, or be used to help the system learn to act correctly. Accuracy, sensitivity, and specificity are defined as
Accuracy=(TP+TN)/(TP+TN+FN+FP) ...(6) Sensitivity=TP/(TP+FN) ...(7) Specificity=TN/(TN+FP) ...(8) Where TP is the number of true positives, TN is the number of true negatives, FP is the number of false positives, and FN is the number of false negatives. Using sensitivity/specificity in addition to accuracy ensured that both patient groups were well classified [16].
Implementation
We have successfully built the prototype of classification using texture analysis and SVM with the help of MATLAB. The dicom images are collected from various hospitals, Govt, Medical College and MES Medical College, Kerala. 24 images are tested for the comparative analysis with clinical factors. To confirm the clinical result expert radiologist were consulted. Three dataset are used for the examination. All the images are scaled to grey images and reconstructed for the processing using preprocessing techniques. The fig (3) shows the resulting images when compilation proceeds. First step is to input the image fig (3a) shows the axial T1-weighted image which is the dataset 1. Then the image is preprocessed with its contrast enhancement and segmentation processes. The contrast enhanced image is shown in fig. (3b). The histogram of the probability density function, fig.(3c) and cumulative density function, fig. (3d). And the segmented image is shown in fig (3e). The fig (3f) shows the contourlet feature extraction of the enhanced image. Real and imaginary part of the Gabor feature extraction is shown in the fig (3g). Magnitude of the Gabor filter is shown in fig. (3h) and the phase is shown in fig. (3i).
The fig.(3k) shows the values of glcm feature extraction. Finally the output will display on the comand window as shown in fig (3l).
Result analysis
graph. The proposed system accuracy is compared with the old method accuracy value. The proposed system accuracy is calculated as 81% for the dataset1 that is T1-weighted axial images. For the dataset 2,T2-weightedd axial images, accuracy is 82% .And for the dataset 3 ,T2-weighted sagital images, the accuracy is 83%. The performance analysis graph is shown in fig (5) which shows the accuracy, sensitivity and specificity of the 3 types of dataset. From the graph, it is clear that the proposed method is having the better accuracy value. The calculation is based on the clinical validation review. The classification can predict the staging of the patient whether it belongs to stage I,II,III, or IV. Calculating the TP, TN, FP, FN values with the result of classification will give the accuracy, sensitivity and specificity
CONCLUSION
The purpose of this study was to investigate whether features derived from MR imag-es of patients with locally advanced cervical cancer
could be used to predict the stag-ing of disease. Nonlinear SVM classification models were constructed based on both second-order texture features and transform features of the tumors. Transform fea-tures such as contourlet and Gabor features mainly based on energy are used for the prediction of output. However, second-order statistical features based on contrast, correlation, energy and homogeneity are significantly used to predict outcome from pre-treatment MR images of cer vical cancer tumors. The best perfor ming transform based models had accuracies around 81% for the axial T1-weighted MR images, 82% for axial T2-weighted and 83% for sagital T2-weighted MR images performed somewhat better than models based solely on clinical factors. Thus, texture features outperformed transform features as well as statistical features for staging prediction, and can compete with predictions based on tumor volume. As a suggestion to the future work, it is better to predict the treatment volume according to the staging will help the radiologist for a better treatment planning.
REFERENCES
1. Rajendra A Kerkar, Yogesh V Kulkarni, “Screening for cervical cancer : an overview”, J Obstet Gynecol India 2006; 56(2): 115-122. 2. Mangal Mahajan, Rajesh Kuber, KR Chaudhari, Prashant Chaudhari, Pravin Ghadage, and Rushikesh Naik, “MR imaging of carcinoma cervix”, Indian J Radiol Imaging. 2013; 23(3): 247–252.
3. Mustafa, N., N. A. Mat Isa, M. Y. Mashor, and N. H. Othman. “New Features of Cervical Cells for Cervical Cancer Diagnostic System Using Neural Network.” IJSSST, 2008; 9(2). 4. Das, Abhishek, Avijit Kar, and Debasis Bhattacharyya. “Preprocessing for Automating Early Detection of Cervical Cancer.” In Information Visualisation (IV), 15th International Conference on, 2011; 597-600. IEEE
5. Asselin, Marie-Claude, James PB OConnor, Ronald Boellaard, Neil A. Thacker, and Alan Jackson. “Quantifying heterogeneity in human tumours using MRI and PET.”
European Journal of Cancer 2012; 48(4): 447-455.
6. Turid Torheim, EirikMalinen, Knut Kvaal, Heidi Lyng, Ulf G. Indahl, Erlend K. F. Andersen, and Cecilia M. Futsæther,” Classification of Dynamic Contrast Enhanced MR Images of Cervical Cancers Using Texture Analysis and Support Vector Machines”,IEEE Transactions on medical imaging, 2014; 33(8).
7. S.Jagadeeswari, S.Malarkhodi, “Segmentation and Classification Using Artificial Neural Network of Cervical Cancer in Magnetic Resonance Image”, International Journal of Mathematics and Computer Research, 2014; 2(5).
8. Rupinder pal Kaur, Rajneet Kaur / International Journal of Engineering Research and Applications (IJERA) ISSN: 2248-9622 2013; 3(2): 1611-1614. 9. Shih-Chia Huang, Fan-Chieh Cheng, and
Enhancement Using Adaptive Gamma Correction With Weighting Distribution” , IEEE Transactions On Image Processing, 2013; 22(3).
10. Hetal J. Vala, Prof. Astha Baxi, “A Review on Otsu Image Segmentation Algorithm”, International Journal of Advanced Research in Computer Engineering & Technology (IJARCET)
13. Volume 2, Issue 2, February 2013, ISSN: 2278 – 1323.
14. S. S. Dhumal, S. S. Agrawal, “MRI Classification and Segmentation of Cervical Cancer to Find the Area of Tumor”, International Journal for Research in Applied Science & Engineering Technology (IJRASET), Volume 3 Issue VII, July 2015. 15. Robert M. Haralick, K. Shanmugam and
It’shak Dinstein, Texture Features for Image Classification, IEEE Transactions on Systems, Man and Cybernetics, 3(6), 1973, 610-621.
16. P. Mohanaiah, P. Sathyanarayana, L. Gur uKumar, “Image Texture Feature Extraction Using GLCM Approach”, International Journal of Scientific and Research Publications, 2013; 3(5).
17. S. Jain, “Brain Cancer Classification Using GLCM Based Feature Extraction in Artificial Neural Network”,International Journal of Computer Science & Engineering Technology 2013; 4(7): 966-970.
18. N. Cristianini and J. Shawe-Taylor, An Introduction to Support Vector Machines : And Other Kernel-Based Learning Methods. Cambridge, U.K.: Cambridge Univ. Press, 2000.