https://dx.doi.org/10.24001/ijaems.3.8.12 ISSN: 2454-1311
www.ijaems.com Page | 886
An Experimental Study of Variable
Compression Ratio Engine Using Diesel Blend -
A Computing Approach
S. Vinodh
1, A. Bragadeesh
2, P. Nishanth
31Assistant professor, Department of Aeronautical, Mahendra Engineering College, Namakkal, India 2,3Student, Department of Aeronautical, Mahendra Engineering College, Namakkal, India
Abstract— Increase in the scarcity of the fossil fuels,
prices and global warming have generated an interest in developing alternate fuel for engine. Technologies now focusing on development of plant based fuel, plant oils and plant fats as alternative fuel. The present work deals with finding the better compression ratio for the honne oil diesel blend fueled C.I engine at variable load and constant speed operation. In order to find out optimum compression ratio, experiments are carried out on a single cylinder four stroke variable compression ratio diesel engine. Engine performance tests are carried out at different compression ratio values. The optimum compression ratio that gives better engine performance is found from the experimental results. Using experimental data Artificial Neural Network (ANN) model was developed and the values were predicted using ANN. Finally the predicted values were validated with the experimentally.
Keywords— biofuel, ANN, feed forward back
propagation, variable compression ratio diesel engine, optimization.
I. INTRODUCTION
Predicting and analysis of chemical reactions of fuels are important tasks because they can unlock insights into the complicated dynamics of systems which are difficult or expensive to test experimentally. Optimisation of the compression ratio of diesel fuelled with variable compression ratio C.I engine at various compression ratios
and concluded that at compression ratio 14.8
improvements in performance and emission characteristics were attained [9]. Investigation of the performance and emission parameters of methyl ester of cottonseed oil blended with diesel in a single cylinder variable compression ratio diesel engine at a constant speed of 1500rpm and concluded that the highest brake thermal efficiency and lowest specific fuel consumption were observed for 5% biodiesel blend for compression ratio of 15and 17and 20% biodiesel blend for compression ratio of 19 and also the maximum NOx emission were observed for
International Journal of Advanced Engineering, Management and Science (IJAEMS) [Vol-3, Issue-8, Aug- 2017] https://dx.doi.org/10.24001/ijaems.3.8.12 ISSN: 2454-1311
www.ijaems.com Page | 887 diesel engine using nakthamala oil biodiesel fuel to predict
the exhaust emissions of C.I.engine. The experimental results reveals that blends of nakthamala oil methyl ester (NOME) provide improved emission characteristics and ANN results showed good correlation between the ANN predicted values and the desired values for various engine exhaust emissions [2].
From the above studies it is clear that biodiesel can be used as an alternate for diesel without modifications in the C. I Engine and ANN can be used as a prediction algorithm to get better correlation with the experimental values.
II. TRANSESTERIFICATION
Transestrification if the process of using alcohol(e.g. Methanol, ethanol or butanol),in the presence of a catalyst, such a sodium hydroxide or potassium hydroxide, to break the molecule of the renewable oil chemically into methyl or ethyl ester of the renewable oil, with glycerol as a by product. Biodiesel, defined as the mono-alkyl esters of fatty acids derived from vegetable oil or animal fat, in application ass an extender for combustion in diesel engines, has demonstrated a number of promising characteristics, including reduction of exhaust emissions. Transesterified, renewable oils have proven to be a viable altemative diesel engine fuel with characteristics similar to those of diesel fuel. The transesterification reaction proceeds with or without catalyst by using primary or secondary monohydric aliphatic alcohols having 1-8carbon atoms as follows:
III. OFADIESELENGINEUSINGNAKTHAMALA OILBIODIESELFUELTOPREDICTTHE
EXHAUSTEMISSIONSOFC.I.ENGINE.
Triglycerides + Monohydric alcohol = Glycerine + Mono-alkyl esters.
A. Properties of Calophylluminophyllum oil
In this present work the calophylluminophyllum oil methyl ester is produced by transesterification process. Transesterification is a chemical reaction between
triglyceride and alcohol in the presence of
catalyst.Transesterification makes the viscosity lowered. The purified calophylluminophyllum oil methyl ester was then blended with petroleum diesel in various concentrations for preparing biodiesel blends to be used in CI engine for conducting experiments. The properties of calophyllum inophylum oil are listed in Table I
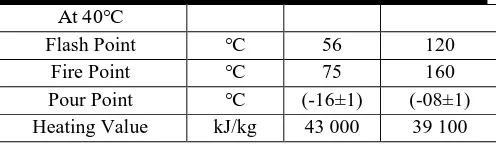
Table I: Properties of Calophylluminophyllum oil
Properties Units HSD Honne Oil
Density At 30℃ kg/m3 830 910
Kinematic Viscosity mm2/s 3.12 (32.48±2)
At 40℃
Flash Point ℃ 56 120
Fire Point ℃ 75 160
Pour Point ℃ (-16±1) (-08±1)
Heating Value kJ/kg 43 000 39 100
IV. EXPERIMENTALINVESTIGATIONS
Variable compression ratio diesel engine test rig was shown in the Fig.1 and its specifications are given bellow.
Bore in mm - 80
Stroke in mm - 110
Rated speed in rpm - 1500
Rated power output in KW - 5
Method of Loading -Eddy current
Compression ratio - 13:1 to 20:1
Diameter of orifice in mm - 20
Type of ignition -compression ignition
Method of starting - manual cranking
Method of cooling - water cooling
No of cylinder - 1
Fig. 1: Variable compression ratio diesel engine test rig experimental setup
A. Experimental procedure
The experiment is carried out on a single cylinder four stroke variable compression ratio vertical diesel engine test rig which has coupled to eddy current dynamometer.
Initially the engine was started by manual
cranking in proper direction and the
decompression lever is used for easy cranking. The engine is allowed to run to attain the steady
state.
Set the engine to a particular compression ratio. Apply various load and note down the time taken
https://dx.doi.org/10.24001/ijaems.3.8.12 ISSN: 2454-1311
www.ijaems.com Page | 888 Repeat the experiment for various compression
ratios and corresponding readings are noted. The following engine tests were performed in single cylinder variable compression ratio diesel engine test rig with diesel, and calophylluminophyllum methyl ester blended with diesel for various concentrations and finds the performance and Emission characteristic is studied. The best performance was obtained for IC engine using diesel blend at 25% of bio-diesel and 75% of diesel. Thus the tests are carried out for varying the compression ratios (14:1 to 18:1) and various blend concentrations as follows.
25% of calophylluminophyllum methyl ester +75% of diesel.
B. Performance curves
The following performance curves were plotted using the values obtained
Load VsSpecific Fuel Consumptions (SFC)
Load Vs Brake Thermal Efficiency Load Vs Mechanical Efficiency
V. EXPERIMENTALRESULTSANDDISCUSSION
The performance tests are carried out on variable compression ratio (VCR) engine under different compression ratio (C.R) and loads using Diesel as fuel and the results are tabulated in the Table II.
The performance tests are carried out on variable compression ratio (VCR) engine under different compression ratio (C.R) and loads using 25% honne oil diesel blend as fuel and the results are tabulated in the Table III.
Table II: Performance observations for 100% diesel
C.R LOA D
B.P TFC SFC Meff ITE BTE IP Kg KW Kg/hr Kg/KW-hr
Hr
% % % KW
14:1 1 0.3151 0.4788 1.5194 22.270 24.059 5.3580 1.4151
14:1 2 0.6238 0.6156 0.9868 36.190 22.794
9
8.2495 1.7238
14:1 4 1.2276 0.7358 0.5993 52.741 25.753
2
13.582 6
2.3271
14:1 6 1.8365 1.005 0.5475 62.54 23.774
0
14.868 6
2.9365
15:1 1 0.3173 0.464 1.4624 19.382 28.720
8
5.5669 3
1.6373
15:1 2 0.6238 0.5801 0.9299 32.094 27.277
7
8.7545 8
1.9438
15:1 4 1.2356 0.7358 0.5954 48.350 28.276
4
13.671 7
2.5556
15:1 6 1.8378 0.9427 0.5129 58.198 27.269
2
15.870 3
3.1578
16:1 1 0.3183 0.4713 1.4805 19.794 27.778
2
5.4986 1.6083
16:1 2 0.6254 0.5915 0.9457 32.654 26.362
4
8.6083 1.9154
16:1 4 1.2316 0.7735 0.6280 48.842 26.539
0
12.962 2.5216
16:1 6 1.8414 0.9731 0.5284 58.804 26.196
3
15.404 3.1314
17:1 1 0.3173 0.4132 1.3021 22.711 27.527
7
6.2520 1.3973
17:1 2 0.6254 0.5801 0.9275 36.674 23.932 8.7771 1.7054
17:1 4 1.2372 0.7938 0.6416 53.393 23.762
8
12.687 2.3172
17:1 6 1.8390 1.0056 0.5468 63.001 23.631
6
14.888 2.9190
18:1 1 0.3183 0.4022 1.2634 22.931 28.099
9
6.4437 1.3883
18:1 2 0.6278 0.5485 0.8735 36.980 25.200
6
9.3194 1.6978
18:1 4 1.2396 0.7182 0.5794 53.673 26.178
2
14.050 2.3096
18:1 6 1.8378 0.9141 0.4974 63.202 25.895 16.36 2.9078
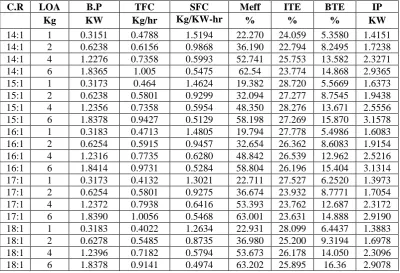
Table III: Performance observations for 25% of Calophylluminophyllum + 75% diesel
C.R LOAD B.P TFC SFC Meff ITE BTE IP
Kg KW Kg/hr Kg/KW-hr % % % KW
14:1 1 0.3149 0.4502 1.4296 23.4174 27.4106 6.4188 1.3449
14:1 2 0.6254 0.5746 0.9186 37.7824 26.4375 9.9887 1.6554
14:1 4 1.2235 0.7015 0.5733 54.2952 29.476 16.004 2.2535
14:1 6 1.830 0.9577 0.5231 63.9930 27.4093 17.5401 2.860
15:1 1 0.3163 0.4404 1.3920 24.7863 26.5951 6.5919 1.2763
15:1 2 0.6198 0.5485 0.8849 39.2346 26.4311 10.370 1.5798
15:1 4 1.2343 0.7015 0.5681 56.2610 28.7087 16.151 2.1948
15:1 6 1.840 0.942 0.5123 65.7169 27.2571 17.912 2.800
International Journal of Advanced Engineering, Management and Science (IJAEMS) [Vol-3, Issue-8, Aug- 2017] https://dx.doi.org/10.24001/ijaems.3.8.12 ISSN: 2454-1311
www.ijaems.com Page | 889
16:1 2 0.6250 0.5485 0.8775 40.1959 26.0167 10.457 1.5550
16:1 4 1.2340 0.7015 0.5685 57.0251 28.3057 16.141 2.1640
16:1 6 1.8359 0.9282 0.5054 66.3700 27.3386 18.1446 2.765
17:1 1 0.3171 0.4249 1.3396 26.0578 26.2873 6.8492 1.2171
17:1 2 0.6238 0.5485 0.8792 40.9399 25.4946 10.437 1.5238
17:1 4 1.2364 0.6935 0.5603 57.8744 28.2699 16.3610 2.1364
17:1 6 1.8378 0.942 0.51297 67.1269 26.6495 17.8890 2.7378
18:1 1 0.3165 0.3969 1.2539 21.5854 33.9041 7.31835 1.4665
18:1 2 0.6254 0.5535 0.8849 36.4609 28.4393 10.3692 1.7154
18:1 4 1.2316 0.6935 0.5630 53.0504 30.7200 16.2974 2.3216
18:1 6 1.8358 0.8619 0.4696 62.7400 31.1450 19.5404 2.9253
A. Performance curves for 25% honne oil and 75% diesel blend.
Fig. 2: Specific fuel consumption Vs Load
Fig. 3: Mechanical Efficiency Vs Load
https://dx.doi.org/10.24001/ijaems.3.8.12 ISSN: 2454-1311
www.ijaems.com Page | 890 B. Summary
Based on the experimental data and the graphs were drawn for the different compression ratio and load with SFC, mechanical efficiency and brake thermal efficiency.The Fig 2, 3 and 4 shows that the SFC is almostequal for all the compression ratio. But the mechanical and brake thermal efficiency are more for the compression ratio of 18:1 than other values.
VI. ARTIFICIALNEURALNETWORK
The first and arguably most simple type of artificial neural network is the feed neural network. Information are moves in only one direction forwards in this network: Data goes through the hidden nodes (if any) and to the output nodes from the input nodes. There are no cycles and loops in this network. Feed forward networks can be constructed from different types of units, e.g. binary McCulloch-Pitts neurons, the simplest example being the preception. Continuous neurons, frequently with sigmoidal activation, are used in the context of the back propagation of error.
Fig.5: Simple feed forward back propagation network
In the model, 80%of the data set was randomly assigned as the training set, while the remaining 20%of the data are put aside for prediction and validation. From all of the trained networks, any ones could provide this condition, from which the simplest network was chosen to have a more precise investigation into the model. The correlation between the predicted values by the ANN model and the measured values resulted from experimental tests are very high.
A. Prediction output responses using ANN
Table IV: Artificial Neural Network
Output responses ANN
Brake power 2-3-2-1
SFC 2-2-3-1
Mechanical efficiency 2-2-2-1
The training algorithm of Feed Forward Back-Propagation isselected for predicting engine parameters. The input response is selected as Compression Ratio and Load also Speed and volume of fuel consumed are taken as constant and the outputs are tabulated in Table V
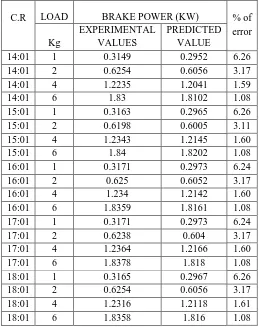
Table.V: Comparison experimental and predicted values of Brake Power
C.R LOAD BRAKE POWER (KW) % of
error Kg
EXPERIMENTAL VALUES
PREDICTED VALUE
14:01 1 0.3149 0.2952 6.26
14:01 2 0.6254 0.6056 3.17
14:01 4 1.2235 1.2041 1.59
14:01 6 1.83 1.8102 1.08
15:01 1 0.3163 0.2965 6.26
15:01 2 0.6198 0.6005 3.11
15:01 4 1.2343 1.2145 1.60
15:01 6 1.84 1.8202 1.08
16:01 1 0.3171 0.2973 6.24
16:01 2 0.625 0.6052 3.17
16:01 4 1.234 1.2142 1.60
16:01 6 1.8359 1.8161 1.08
17:01 1 0.3171 0.2973 6.24
17:01 2 0.6238 0.604 3.17
17:01 4 1.2364 1.2166 1.60
17:01 6 1.8378 1.818 1.08
18:01 1 0.3165 0.2967 6.26
18:01 2 0.6254 0.6056 3.17
18:01 4 1.2316 1.2118 1.61
18:01 6 1.8358 1.816 1.08
The below Fig. 6 (a), (b), (c), (d), (e) shows that the predicted neural network (2-3-2-1) for brake power. It is seen that the predicted values are very close to the experimental results and the maximum error is 6.26%.
International Journal of Advanced Engineering, Management and Science (IJAEMS) [Vol-3, Issue-8, Aug- 2017] https://dx.doi.org/10.24001/ijaems.3.8.12 ISSN: 2454-1311
www.ijaems.com Page | 891 (b)
(c)
(d)
(e)
Fig. 6: Comparison of Predicted and Experimental Values of brake power
Then again the input response is selected as Compression Ratio and Load also Speed and volume of fuel consumed are taken as constant. Output response is Specific fuel consumption and it is tabulated in Table VI
Table VI: Comparison experimental and predicted values of Specific Fuel Consumption
C.R
LOAD SPECIFIC FUEL
CONSUMPTION (kg/kWhr) % of
error
Kg EXPERIMENTAL
VALUES
PREDICTED VALUE
14:01 1 1.4296 1.4093 1.42
14:01 2 0.9186 0.8988 2.16
14:01 4 0.5733 0.5539 3.38
14:01 6 0.5231 0.5033 3.79
15:01 1 1.392 1.3722 1.42
15:01 2 0.8849 0.8656 2.18
15:01 4 0.5681 0.5483 3.49
15:01 6 0.5123 0.4925 3.86
16:01 1 1.3785 1.3587 1.44
16:01 2 0.8775 0.8577 2.26
16:01 4 0.5685 0.5487 3.48
Table VI contd.: Comparison experimental and predicted values of Specific Fuel Consumption
C.R
LOAD
SPECIFIC FUEL CONSUMPTION
(kg/kWhr)
LOAD
% of error
kg EXPERIMENTAL
VALUES kg
16:01 6 0.5054 0.4856 3.92
17:01 1 1.3396 1.3198 1.48
17:01 2 0.8792 0.8594 2.25
17:01 4 0.5603 0.5405 3.53
17:01 6 0.51297 0.49317 3.86
18:01 1 1.2539 1.2341 1.58
18:01 2 0.8849 0.8651 2.24
18:01 4 0.563 0.5432 3.52
18:01 6 0.4696 0.4498 4.22
The below Fig. 7 (a), (b), (c), (d), (e) shows that the predicted neural network (2-3-2-1) for SFC.It is seen that the predicted values are very close to the experimental results and the maximum error is 3.86%.
https://dx.doi.org/10.24001/ijaems.3.8.12 ISSN: 2454-1311
www.ijaems.com Page | 892 (b)
(c)
(d)
(e)
Fig. 7: Comparison of Predicted and Experimental Values of SFC
Then again input response is selected as Compression Ratio and Load also Speed and volume of fuel consumed are taken as constant. Output response is Mechanical Efficiency and the outputs are tabulated in Table VII
Table VII: Comparison experimental and predicted values of brake thermal efficiency
C.R LOAD MECHANICAL EFFICIENCY
(%) % of
error
kg
EXPERIMENTAL VALUES
PREDICTED VALUE
14:01 1 23.4174 22.4644 4.07
14:01 2 37.7824 36.8294 2.52
14:01 4 54.2952 53.3422 1.76
14:01 6 63.993 63.04 1.49
15:01 1 24.7863 23.8333 3.84
15:01 2 39.2346 38.2816 2.43
15:01 4 56.261 55.308 1.69
15:01 6 65.7169 64.7639 1.45
16:01 1 25.431 24.478 3.75
16:01 2 40.1959 39.2429 2.37
16:01 4 57.0251 56.0721 1.67
16:01 6 66.37 65.417 1.44
17:01 1 26.0578 25.1048 3.66
17:01 2 40.9399 39.9869 2.33
17:01 4 57.8744 56.9214 1.65
17:01 6 67.1269 66.1739 1.42
18:01 1 21.5854 20.6324 4.42
18:01 2 36.4609 35.5079 2.61
18:01 4 53.0504 52.0974 1.80
18:01 6 62.74 61.787 1.52
The below Fig. 8 (a), (b), (c), (d), (e) shows that the predicted neural network (2-3-2-1) for mechanical efficiency. The values are more accurate with the maximum error of 3.84%..
(a)
International Journal of Advanced Engineering, Management and Science (IJAEMS) [Vol-3, Issue-8, Aug- 2017] https://dx.doi.org/10.24001/ijaems.3.8.12 ISSN: 2454-1311
www.ijaems.com Page | 893 (c)
(d)
(e)
Fig.8: Comparison of Predicted and Experimental Values of Mechanical Efficiency.
VII. CONCLUSION
The performance test on VCR engine is carried out for the engine fueled with 25% biodiesel blend and neat diesel. The experimental results of both the fuels are compared. Thus it is understood thatthe25 % biodiesel blend produces better performance than base fuel at the compression ratio of 18:1
The training algorithm of Feed Forward Back-Propagation is selected for predicting engine parameters. The input responses selected are Compression Ratio and Load by taking speed as constant. Then, the ANN results are validated with experimental results and found satisfactory. Thus it can be concluded that the training algorithm of feed forward back-propagation is sufficient in predicting engine performance parameters.
REFERENCES
[1]Nilesh. M, Sujit. K, Vinay. K and Tausif Mulla, Study of performance characteristics of variable compression ratio diesel engine using ethanol blends with diesel, International Journal of Engineering Science and Technology Vol. 4, No.6, pp.2784-2795, 2012
[2]Sarala. R,Rajendran. M andSutharson B, Exhaust emission analysis using nakthamala oil biodiesel fuel in a c.i engine with ann, International Journal of Research in Environmental Science and Technology, Vol.2, No.2, pp.48-53, 2012.
[3]Balajiganesh. N and Chandra Mohan Reddy. B, Optimization of C.I Engine Parameters Using Artificial Neural, International Journal of Mechanical and Industrial Engineering, Vol.1, No.2, pp.76-82, 2011. [4]Deepanraj. B, Dhanesh. C, Senthil. R andKannan. M,
Use of Palm oil Biodiesel Blends as a Fuel for Compression Ignition Engine, American Journal of Applied Sciences Vol.8,No.11, pp.1154-1158, 2011.
[5]Venkanna.B.K andVenkataramana Reddy.C,
Performance, emission and combustion characteristics of direct injection diesel engine running on calophylluminophyllumlinn oil (honne oil), International Journal of Agricultural and Biological Engineering, , Vol.4 No.1, pp.1-9, 2011.
[6]Seshaiah. N, Efficiency and exhaust gas analysis of variable compression ratio spark ignition engine fuelled with alternative fuels”, international journal of energy and environment, Vol.1, No.5, pp.861-870, 2010.
[7]Shivakumar, SrinivasPai. P, Shrinivasarao.B
andSamaga. B. S., “Performance And
Emissioncharacteristics of a 4 Stroke C.I. Engine Operated On Honge Methyl Ester Using Artificial Neural Network, ARPN Journal of Engineering and Applied Sciences, Vol.5,No.6, pp.83-94, 2010.
[8]Anand. R, Kannan. G, Rajasekhar Reddy. K and Velmathi. S, The performance and emissions of a variable compression ratio diesel engine fuelled with bio-diesel from cotton seed oil, ARPN Journal of Engineering and Applied Sciences, Vol.4, No.9, pp.72-87, 2009.