IJIRT 101584
INTERNATIONAL JOURNAL OF INNOVATIVE RESEARCH IN TECHNOLOGY237
Control Of Anaesthesia Concentration Using Model
Based Controller
Ninu Jagannivas
1, Hepsiba.D
2 1PG Scholar,
2Assistant Professor
Dept. Electronics and Instrumentation, Karunya University Coimbatore, India
Abstract-Administration of Anaesthesia is important for both surgery and intensive care. The intravenous anaesthetics are widely used to provide rapid onset, stable maintenance, and rapid recovery compared with inhaled anaesthetics. The aim of the project is to investigate a reliable and safe methodology for delivering total intravenous anaesthesia using closed loop control technology and bispectral analysis of human electroencephalogram (EEG) waveform .In this work a Bispectral Index (BIS), derived from power spectral and bispectral analysis on EEG waveform, is used to measure the depth of anaesthesia. . In comparison with conventional method, drug effect is measured during drug infusion in closed loop anaesthesia. This may provide superior safety, better patient care, better quality of anaesthesia. Main advantage of this method is to make recurrent and minor alterations to anaesthetic drug. A model based controller is used to control the drug infusion rate .The performance of the model based controller is compared with the PID controller. The results show that the model based controller gives better performance than others controllers and it reduces rise time , settling time and peak time.
I.INTRODUCTION
Depth of anesthesia monitoring is an important part of patient care. Anesthesia is used in many areas such as dental surgery, surgical operation with incision, and intensive care. One of the aims of anesthesia is to allow the patients to feel no pain and get into an unconscious state without memory in surgical operations.However, it is harmful or even dangerous to patients if an excessive amount of drug is given. In order to control intravenous drug delivery, the depth of anesthesia needs to be assessed.One critical problem often faced by anesthetists in clinical practice is how to assess accurately the depth of anesthesia in patients during surgery, and another is how much drug should be infused to achieve the desired depth of anesthesia. It is desirable that the depth of anesthesia could be assessed together with drug administration automatically and interactively with little human
intervention as can be seen in many industrial processes.At present, many anesthetists are still delivering anesthetic drugs manually using clinical signs (such as sweating, pupil size, etc.) to assess depth of anesthesia. A primary aim of this project is to investigate the technology that provides automated intravenous drug administration and depth of anesthesia assessment
II. SYSTEM DESCRIPTION
The definition of depth of anesthesia (DOA) is extremely varied, ranging from scientific discussions of the minimum alveolar concentration (MAC) for inhalational anesthetics or plasma drug concentration for intravenous anesthetics to clinical descriptions of "light", "moderate", or "deep" anesthesia Currently, there is no accepted "gold standard" defining the state of anesthesia. In fact, the definitions of anesthesia depth have evolved with the drugs used in clinical practice. Consequently, the use of potent inhaled anesthetics and intravenous anesthetics in modem clinical practice has precluded the unifying definitions of anesthetic depth.
IJIRT 101584
INTERNATIONAL JOURNAL OF INNOVATIVE RESEARCH IN TECHNOLOGY238
signs varies from anesthetist to anesthetist due to different experiences in anesthetists. To achieve the desired anesthetic depth, either inhaled anesthetics or intravenous anesthetics can be used.
Pharmacokinetics and pharmacodynamics are essential concepts with which the intravenous drugs may be given to their best advantage. The use of pharmacokinetics and pharmacodynamics in the drug infusion using TCI technique leads to continuous infusion techniques. An anesthesia pump is needed to drive the syringe in both methods.
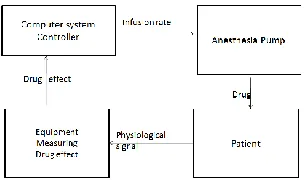
Figure 1 Basic closed loop anesthesia system
.
Monitoring Depth Of Anesthesia Clinical Signs
Clinical signs of anesthetic depth include blood pressure (BP), heart rate (HR), HR variability, sweating, pupil size, lacrimation, (isolated arm and eye) movement and respiratory patterns etc. However, the use of muscle relaxants eliminates the rate and volume of respiration as the clinical signs of DOA (Stanski, 1994), it also makes interpretation of movement both difficult and imprecise in most clinical circumstances. Of the clinical signs blood pressure and heart rate are numerical signs, and all the others are not.
In clinical practice, clinical signs are important for anesthetists to assess the depth of anesthesia and have been routinely monitored. However, it has not been possible to use clinical signs to generate uniform measures of depth of anesthesia. The usefulness of the clinical signs may be changing over time, and the clinical signs may correlate with DOA for certain anesthetics and may not for some others. Surgical stimulation may interfere with some of the clinical signs such as blood pressure, and many factors have influence on pulse rate.
Drug Concentration
Another way to assess depth of anesthesia is to determine the anesthetic drug concentration from assaying blood samples. After being administered intravenously, the drug is transferred with hysteresis to the rest of the body by blood circulation, and only part of the drug will reach its effect site or its site of action, i.e.,
the brain. The drug concentration in plasma peaks almost instantly then declines due to the elimination or distribution of the drug from the body or to the rest of the body, whereas the drug concentration at effect site increases gradually until the drug concentrations in plasma and at effect site equilibrate. The relationship between the dose of drug administered and the drug concentration in plasma is characterized by pharmacokinetics, while pharmacodynamics characterizes the relationship between the drug concentration in plasma and the drug concentration at effect site. However, the drug concentration at effect site is only a measure of pharmacological effect, and the depth of anesthesia is a measure of drug effect. To estimate approximately the drug effect from the effect site drug concentration, a sigmoid model is available.
Ideally, the depth of anesthesia could be
estimated from the measure of drug
concentration at effect site. However the effect site is not accessible, and instead, the plasma drug concentration is measured from blood
samples. Pharmacokinetics and
pharmacodynamics make the estimate of effect site concentration possible. As significant time is required in assaying a blood sample, the measurement of depth of anesthesia from drug concentration is usually reserved for clinical experiments where the drug concentrations are analyzed or processed after the experiments.
IJIRT 101584
INTERNATIONAL JOURNAL OF INNOVATIVE RESEARCH IN TECHNOLOGY239
activity, which are controlled and paced by sub cortical thalamic nuclei. This electrical activity has direct physiologic correlates relevant to depth of anesthesia. Cerebral blood flow and cerebral metabolism are related to the degree of EEG activity. The EEG is a valuable tool because it reflects cerebral physiology, and is a continuous and non-invasive measure, its pattern changes markedly on administration of anesthetic drugs, and also it is not affected by neuromuscular blockers shows some sample EEG patterns at different stages of anesthesia with different drugs. EEG generally changes from a low amplitude, high frequency signal while awake to a large amplitude, low frequency signal when deeply anaesthetized.
The EEG signal has been used as an objective measurement of the depth of anesthesia for a long time. However, the raw EEG signals, are difficult to understand, and different classes of anesthetics are known to cause different EEG patterns. Some EEG patterns are generally associated with unconsciousness, and there is no EEG pattern that proves consciousness is present. In order to assess the depth of anesthesia, meaningful features containing in a raw EEG signal and related to the depth of anesthesia need to be extracted by means of signal processing. Traditionally, the EEG signal is processed by Fourier transformation for power spectral analysis. Many variables were derived from the EEG by this method. For example, spectral edge frequency (SEF) and median frequency (MF) are defined as the frequencies below which 95% or 50% of the EEG signal power is located, respectively. Processed EEG variables from power spectral analysis are single-variable descriptors of depth of anesthesia, and they are of limited use in describing depth of anesthesia
More recently, bispectral analysis was used to analyze the EEG signal, and a depth of anesthesia indicator, Bispectral Index (BIS) was derived and made commercially available. BIS is a multivariable depth of anesthesia indicator that combines the results from bispectral analysis and those from power spectral analysis of the EEG signal. It was reported that BIS is linearly related to the propofol drug concentration over a
clinically relevant range. Another class of depth of anesthesia descriptors is derived from the auditory evoked response (AER), also known as the auditory evoked potential (AEP), produced by auditory stimulation of peripheral nerves. The AER is a subset of EEG signal and can be separated from the EEG signal by means of special signal averaging techniques. The AER can be divided into three responses: brain stem response obtained in the first 10ms after the stimulation, the early cortical response (15~80ms), and the late cortical response (80~100ms).
Bispectral Index
Bispectral index (BIS) is one of several
technologies used to monitor depth
IJIRT 101584
INTERNATIONAL JOURNAL OF INNOVATIVE RESEARCH IN TECHNOLOGY240
and there is a tendency for signal correlation from different parts of the cortex to become more random.
Manually Controlled Drug Infusion
Manual delivery of anesthetic drug is the traditional method to deliver anesthesia using a high precision anesthesia pump. It involves the calculation of a bolus dose which induces the anesthesia and a maintenance infusion rate to maintain the anesthesia. As drug concentration is defined to be the amount of drug divided by volume the induction bolus dose (Bd) can be therefore easily calculated from the target drug concentration (Cr) and the volume (V1) of the patient . The bolus dose Bd calculated .it can be used to achieve the target drug concentration in plasma without overshoot. However most of the time in this case, the drug concentration in plasma is below the target. Alternatively, the central compartment volume V1can be replaced with the volume of distribution at the time of peak effect, so that the drug concentration is equal to the target concentration when the plasma and the effect site are in equilibrium after the bolus infusion, although it results in overshoot in plasma.
After the bolus infusion, smaller infusion rates must be maintained to compensate the distribution loss and the clearance of drug. As the rate of distribution into peripheral tissues decreases over time, the maintenance infusion rate should therefore be changed accordingly. The following equation, derived from pharmacokinetic model, can be used for the calculation of maintenance infusion rate in a dosing regimen design.
Target Controlled Infusion
Target controlled infusion, also known as computer assisted continuous infusion (CACI), is an automated drug infusion method. The physical components in a TCI system include a high precision anesthesia pump which drives a syringe, and a computer or microprocessor system controlling the infusion rate of the pump using a pharmacokinetic model. Currently, all TCI systems are for research except for the
diprifusor which is commercially available. From the point of view of a control strategy, target controlled infusion is an open loop control system for there is no measure of drug effect or patient response in the system. The system gives the drug according to the difference between the given target concentration (either in plasma or at effect site) and the drug concentration at the target site predicted by the built-in pharmacokinetic model.
Infusion Rate Generator
The infusion rate generator within a TCI component gives the drug infusion rate to the two anesthesia pumps for either a hypnotic agent or an analgesic agent. The infusion rate can be easily solved from equation above, if plasma is the site of target, and the infusion rate can be obtained when effect site is the site of target.
III MATHEMATICAL MODEL OF CLOSED-LOOP ANESTHESIA
The development of the closed-loop anesthesia (CLAN) control system includes system model development, test of the model, and the implementation of the physical system with hardware and software components. Modeling of the system before the design and implementation of the physical system has great advantage. A model provides an efficient way to investigate the closed-loop anesthesia control with a wide range of control strategies. The problems associated with the closed-loop anesthesia control (e.g. patient variability, drug interaction) can also be investigated with the model, which would significantly improve the reliability of the implemented system and patient safety.
IJIRT 101584
INTERNATIONAL JOURNAL OF INNOVATIVE RESEARCH IN TECHNOLOGY241
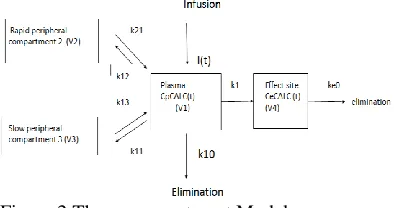
Kij= rate constants , Keo= elimination rate of drug, k1e= drug transfer rate
where kij is drug transfer rate between plasma and rapid/slow compartments, keo is elimination rate of drug from effect site to environment; ke0 is drug transfer rate from plasma to effect site,V is volume of individual compartment with V4 negligible; I(t) is drug infusion rate over time; CpcALc(t) is predicted plasma concentration; CecALc(t) is predicted effect site concentration. The change of concentration in the central compartment at any time is related to the drug transferred to and from the peripheral compartments, and the drug eliminated from and infused into the central compartment at that time. Similarly, the change of concentration in a peripheral compartment is associated with the drug transferred to and from the central compartment at any time. Hence the pharmacokinetic model can be characterized by the following differential equations:
=
(1)
= (2) = (3) where C1(t), C2(t) ,C3(t) are the drug concentrations (ng/ml) at time t in the central compartment, rapid and slow equilibrium compartment respectively. I(t) = drug infusion rate. And applying Laplace transform the differential equations becomes, ( 4)
(5) (6) (s) = (7) (8) (9) (10)
(11)
(12)
(13)
(14)
The development of the mathematical model assumes linear dose-concentration and linear dose-effect relationships. However, those relationships may vary in patients or even within single patient during the course of drug infusion. This patient variability is now technically not quantifiable, and therefore the mathematical model is developed as a population average model. In clinical practice, this patient variability would bring uncertainty on the control of anesthesia. The limitation of the developed
mathematical model comes from
pharmacokinetics and phamacodynamics, where some of the factors that affect the drug disposition are not modeled (such as age, sex, and health condition), and the linear approximation of patient specific sigmoid model introduces modeling error.
IV CONTROLLER DESIGN
IJIRT 101584
INTERNATIONAL JOURNAL OF INNOVATIVE RESEARCH IN TECHNOLOGY242
these cause variability among patients and even within a single patient being anaesthetized.
On the other hand, significant non-linearity exists in all existing anesthetic depth descriptors though their trends could linearly correlates with the drug effect, such as Bispectral Index. The control signal is also non-linear due to the fact that it is impossible to take any infused drug out of a patient. Another problem in closed-loop anesthesia control is the drug effect hysteresis that varies from one patient to another. Since a closed-loop anesthesia system could potentially be used with patients in the operating theatre during surgery, it is essential that such a system is able to respond quickly to any inadequate anesthesia caused by stimulation while ensuring the safety of patients. A Pill controller is therefore a good choice for its quick response and less computational complexity.
Target Controlled Infusion (TCI) has achieved significant success in clinical practice. Though TCI is an open-loop control scheme, the target drug concentration for individual patient is actually adjusted by an anesthetist in practice, and this adjustment is based upon the depth of anesthesia monitoring and the anesthetist's experience. To take advantage of the TCI technology, a TCI component is to be used in the closed-loop anesthesia system to drive directly an infusion pump, while the PID controller acts like the anesthetist to adjust the target drug concentration of the TCI component. One of the major advantages of using a TCI system in the closed-loop anesthesia system is that patient safety could be further ensured when the closed-loop control system malfunctions or the feedback signal is not available or bad in quality. In these circumstances, the closed loop control can be easily switched to open-loop TCI control, and switched back after the problem has been resolved.
Due to the existence of non-linearity and unknown dynamics in the closed-loop anesthesia system, a system control unit is introduced to monitor and modify the behavior of the PID controller and the infusion rate given by the TCI. This unit also contains digital signal processing and improves the level of confidence on patient safety in the use of closed-loop.
PID CONTROLLER
The specifications of the PID controller were given in time domain so that a search algorithm can be applied through computer simulation to find the desired controller gains. The specifications include rise time, maximum overshoot, settling time, and stead-state error as defined. Because the CLAN system is safety critical, the fundamental requirement from a controller tube used in such a system is its response speed to any inadequate anesthetic level. Based on this requirement, an aggressive rise-time of 50 seconds and a settling time of 75 seconds were chosen to obtain a reasonable fast response from the resulted PID controller since the drug effect peak time after a bolus infusion typically ranges from 1 to 2.4 minutes. Typical maximum overshoot for a PID controller is around 25%. In theory, a quicker response would be obtained from a larger maximum overshoot. However, this leads to a longer settling 107 time and results in more oscillation before the target has been achieved. This is not desired in a CLAN system using Bispectral Index which is not truly monotonic. Therefore a 10% maximum overshoot was set for the controller to compromise between the response speed and the smooth trend of Bispectral Index. As for steady state error, 10-3 is more than enough as Bispectral Index itself is oscillatory and the maximum measuring precision in Bispectral Index is 0.001.
The PID control scheme is named after its three correcting terms, whose sum constitutes the manipulated variable (MV). The proportional, integral, and derivative terms are summed to calculate the output of the PID controller.
Model Reference Adaptive Control
A control system is a device that regulates or controls the dynamics of any other plant or process. Adaptive control is one of the widely used control strategies to design advanced control systems for better performance and accuracy. Model Reference Adaptive Control (MRAC) is a direct adaptive strategy with some adjustable controller parameters and an adjusting mechanism to adjust them.
IJIRT 101584
INTERNATIONAL JOURNAL OF INNOVATIVE RESEARCH IN TECHNOLOGY243
response of the adaptive control system to the reference input. Controller: It is usually described by a set of adjustable parameters. In this paper only one parameter θ is used to describe the control law. The value of θ is primarily dependent on adaptation gain. Adjustment Mechanism: This component is used to alter the parameters of the controller so that actual plant could track the reference model. Mathematical approaches like MIT rule, Lyapunov theory and theory of augmented errorcan be used to develop the adjusting mechanism. The basic block diagram of MRAC system is shown in the figure, ym(t) is the output of the reference model and y(t) is the output of the actual plant and difference between
them is denoted by e(t)
e(t) = y(t) - ym(t)
V.Simulation Results PID Controller
The transfer function obtained through empirical method of modeling is used as the system for studying the performance of PID Controllers as shown in Figure
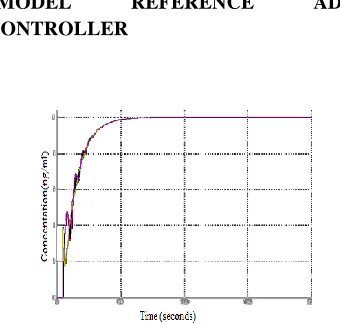
Figure 3 Closed Loop Response
Closed loop response of the anaesthesia model using PID controller is simulated using matlab is shown in the figure 3 above. The performance characteristics of the system is analysed and the high overshoot is the main disadvantage of the system
MODEL REFERENCE ADAPTIVE
CONTROLLER
Figure 4 Response of the Plant and Model with Model Reference Adaptive Controller
V. Performance Analysis
The comparison between various controllers have been done and it was found that MRAC provides better settling time,rise time.
VI. CONCLUSION
This project deals with anaesthesia process which is multi-variable interacting system, that is difficult to be controlled by the conventional control system. The control of NMB during anesthesia, through the continuous infusion of a muscle relaxant, is characterized by a very high degree of uncertainty in the dynamics of the system due to both inter patient variability as well as time variations. In order to deal with these features, adaptation method using MRAC were used. Adaptive controller performed well at the desired set points without any oscillation and overshoot. Simulation of Adaptive Control in anaesthesia process was carried out in MATLAB . A comparison between the performance of adaptive and conventional controller is carried out and it was observed that adaptive controller has got better performance with less overshooand less oscillation than the conventional controller.
Future work of this project can be extended by using Internal Model Control, Model Predictive Control .
Contr oller
Settlin g time(se c)
Rise time(sec)
Peak time(se
c)
PI 2.938 .0576 .1346
PID 2.36 .288 .098
MRA C
IJIRT 101584
INTERNATIONAL JOURNAL OF INNOVATIVE RESEARCH IN TECHNOLOGY244
REFERENCES
[1] T. Wigren, “Recursive prediction error identification method using the nonlinear Wiener model,” Automatica, vol. 29, no. 4, pp. 1011– 1025,1993.
[2]K. Godfrey, Compartmental models and their application. Academic Press, 1983.
H. Derendorf and B. Meibohm, “Modeling of
pharmacokinetic/pharmacodynamic (PK/PD)
relationships: Concepts and
perspectives,”Pharmaceutical Research, vol. 16, pp. 176–185, 1999.
[3]K. J. Åström and B. Wittenmark, Adaptive Control, 2nd ed. Mineola,New York, USA: Dover Publications, Inc., 2008.
M. M. Silva, T. Wigren, and T. Mendonça, “Nonlinear identification of a minimal neuromuscular blockade modeling anaesthesia,” Dept. Information Technology, Uppsala
University.
[3] “Nonlinear identification of a minimal neuromuscular blockade model in anesthesia,” IEEE Trans. Contr. Sys. Tech. (in press), Jan.2012
H.-H. Lin, C. L. Beck, and M. J. Bloom, “On the use of multivariable piecewise-linear models for predicting human response to anesthesia,”IEEE Trans. Biomed. Eng., vol. 51, no. 11, pp. 1876–1887, Nov. 2004.
[4] H. Alonso, T. Mendonça, J. M. Lemos, and T. Wigren, “A simple model for the identification of drug effects,” in Proc. IEEE Int. Symp.Intell. Signal Process. (WISP), Budapest, Hungary, 2009, pp. 269– 273.