ORIGINAL ARTICLE
Effect of Preliminary Selection of RC Shear
Walls’ Ductility Level on Material Quantities
Hossam El‑Sokkary
1,2and Khaled Galal
1*Abstract
According to the National Building Code of Canada, the seismic force resisting systems (SFRS) of reinforced concrete (RC) buildings are classified based on their ductility level as being ductile, moderately ductile and conventional con‑ struction systems. The selection of the ductility level of an SFRS at the conceptual design phase is primarily governed by the seismicity at the building location, the building dynamic characteristics, and the height limitations specified by the design code. The selected ductility level affects the design loads, the cross‑sections and reinforcement of the SFRS components, and hence the overall construction cost. This paper aims to evaluate the effect of the wall’s selected ductility level on the quantities of its constituent materials as well as the rebar detailing. Four multi‑storey RC shear wall buildings with different heights located in three different cities in Canada; Toronto, Montreal, and Vancouver, were selected to represent three different seismic hazard zones (low, medium, and high). For each building height and location, the walls were designed using the dynamic analysis procedure of the National Building Code of Canada to reach different ductility levels. The construction material quantity estimates were evaluated and compared to a refer‑ ence case for each building height, seismic hazard and ductility level. The effect of ductility level on the bars detailing is also investigated. This paper helps the structural engineers to select the cost‑effective and constructible RC shear wall system at the conceptual design phase before reaching the detailed design phase.
Keywords: conceptual design phase, reinforced concrete, shear walls, ductility, dynamic analysis, material quantities
© The Author(s) 2018. This article is distributed under the terms of the Creative Commons Attribution 4.0 International License (http://creat iveco mmons .org/licen ses/by/4.0/), which permits unrestricted use, distribution, and reproduction in any medium, provided you give appropriate credit to the original author(s) and the source, provide a link to the Creative Commons license, and indicate if changes were made.
1 Introduction
Current seismic design codes allow nonlinear response of the seismic force resisting system (SFRS). This non-linear response permits the SFRS to experience higher deformations that will dissipate the earthquake energy at a reduced design force level, and hence would lead to smaller sections of the system. The National
Build-ing Code of Canada (NBCC 2010) allows three levels of
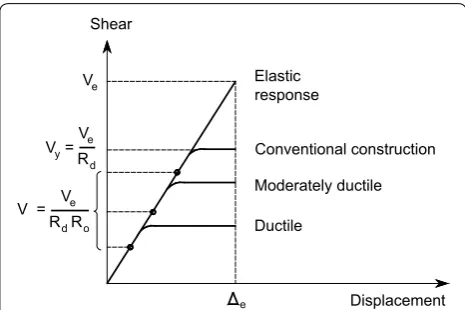
ductility for reinforced concrete (RC) shear wall build-ings; conventional construction, moderately ductile and ductile walls. As the wall level of ductility increases, the design seismic force decreases and stricter detail-ing, ductility and stability requirements are imposed
by the code (Fig. 1). Despite the fact that the product
of the ductility-related force modification factor, Rd,
and the overstrength-related force modification
fac-tor, Ro, is 3.5 × 1.6 = 5.6 for ductile RC shear walls and
2.0 × 1.4 = 2.8 for moderately ductile RC shear walls, in
some situations, designing the wall as a ductile system can result in a less economic design without any advan-tage over the moderately ductile, or even conventional RC walls. This is due to the elaborated stability and ductility requirements in the ductile wall design, which might not be necessary for the particular building and seismic hazard zone under consideration. Therefore, selection of the most suitable RC shear wall system and its level of ductility at the conceptual design stage is an important decision that can reduce the construction cost significantly. Moreover, the choice of the wall’s ductility level affects the building’s overall performance and its lateral deformations under design loads. These defor-mations have to be limited to the code requirements in order not to hinder the building’s stability or become
Open Access
*Correspondence: [email protected]
1 Department of Building, Civil and Environmental Engineering, Concordia University, 1515 St. Catherine West, Montreal H3G 2W1, Canada
detrimental to the building’s gravity load resisting system
and the non-structural elements (Adebar et al. 2010).
According to the NBCC (2010), the analysis for seismic
action is to be conducted using the Dynamic Analysis Procedures (DAP), except that under certain conditions, the Equivalent Static Procedures (ESP) may be applied. Although the DAP consume additional engineering time compared to the ESP, in many cases, the three-dimen-sional dynamic analysis can provide much more econom-ical design. Performing such detailed 3D analysis would not be feasible at the preliminary design stage where the final decision regarding the SFRS and its ductility level is not made yet. The designer decision about the ductility level of an SFRS at the conceptual design phase will affect the cost and constructability of the project (Pullmann
et al. 2003). Therefore, it would be beneficial to provide
guidelines to the structural engineer for the prelimi-nary selection of the most suitable RC shear wall system and the most efficient ductility level before reaching the detailed engineering phase of the structure.
The selected level of ductility depends on the type of the SFRS, the seismicity of building location, the build-ing dynamic characteristics, and the height limitations of
the design code. Adebar et al. (2014) stated that the
selec-tion of ductility level for RC shear wall buildings depends mainly on the seismic hazard of the region. They men-tioned that conventional, moderately ductile, and ductile walls are the systems of choice in low, medium, and high seismic hazard zones, respectively.
There are several studies that investigated the seismic performance of RC moment resisting frame structures
with different levels of ductility (Filiatrault et al. 1998;
Heidebrecht and Naumoski 1999; Sadjadi et al. 2007;
Galal and El-Sokkary 2008) and the ductility of RC walls
(Paulay et al. 1982; Priestley and Park 1987; Wallace
1994; Adebar et al. 2005). However, the literature review
showed that the relationship between the ductility level of an SFRS and the construction material quantities or bars detailing has not been sufficiently investigated for RC shear wall buildings in Canada. Hutchison and Van
Geldermalsen (1983) compared the cost of ductile RC
walls and walls with limited ductility for two building heights (4- and 8-storey buildings) designed according to the New Zealand Code of Practice. They found that a sav-ing of 9 and 10% of the total buildsav-ing cost was achieved when ductile walls were used for the 4- and 8-storey buildings, respectively. Choopool and Boonyapinyo
(2011) studied nine-storey RC moment resisting frames
with different levels of ductility and their impact on the construction cost estimates. The frames were designed according to the seismic specifications of Thailand as Ordinary Ductile, Intermediate Ductile, and Special Ductile Frames, and they were compared to the gravity load designed frames. They found that Ordinary Ductile Frame is the most expensive among the ductility levels considered. They also found that the costs of Special and Intermediate Ductile Frames were similar in a low seis-mic hazard zone due to the requirement for strong col-umn-weak beam.
The objective of this paper is to evaluate the effect of selected SFRS level of ductility on the construction mate-rial quantity estimates and the bars detailing of RC shear wall buildings. Four multi-storey RC shear wall buildings with different heights located in three different cities in Canada were selected. Toronto, Montreal, and Vancouver cities were selected to represent low, medium and high seismic hazard zones. 5-, 10-, 15-, and 20-storey ings were considered in the analyses. For each build-ing height and location, the shear walls were designed
according to the NBCC (2010) and the Canadian
Stand-ard Association (CSA A23.3-14) (2014) as ductile,
mod-erately ductile, and conventional construction systems. This paper proposes a factor (rebar constructability fac-tor, C.F.) that can reflect the complexity of assembling the wall reinforcement cages which is one of the main con-cerns affecting the constructability of RC buildings. The construction material quantity estimates and the rebar constructability of each case were evaluated and com-pared to a reference case. This paper helps the designers for the most suitable selection of ductility level for RC shear wall buildings that satisfies the code requirements, while providing the most economical choice.
2 Description of the Selected Buildings
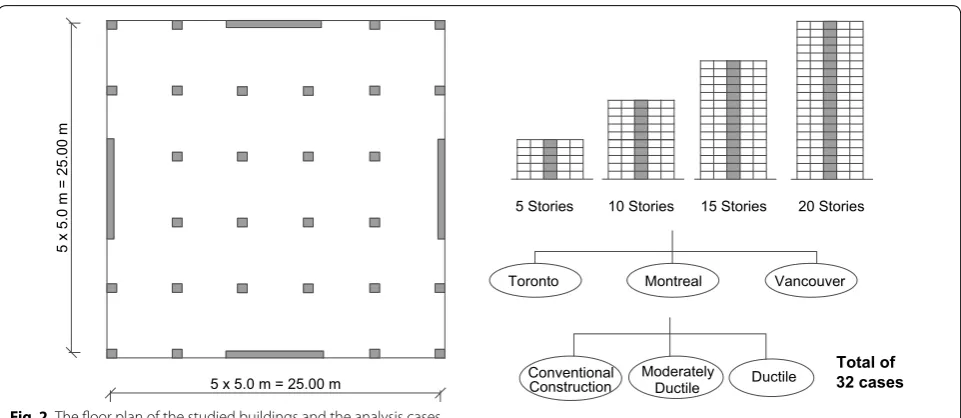
The four buildings selected for this study have the same floor plan that consists of five symmetrical bays in both
directions as shown in Fig. 2. The bay width is 5.0 m
with total floor dimensions of 25.0 m × 25.0 m. The
sto-rey height is 3.0 m, the slab thickness is 240 mm, and the Ductile
Moderately ductile Conventional construction Elastic
response
Displacement Ve
Ve V =y R
d
e Shear
V = Ve RdRo
average flooring and partitions load is 2.0 kPa. The slabs were designed to carry a live load equals to 1.9 kPa of a residential occupancy. The buildings are assumed to be founded on very dense soil (Class C). The design snow load was determined for each city and was found to be 1.12, 2.48, and 1.64 kPa for Toronto, Montreal, and Van-couver, respectively.
The shear walls were chosen to be located at the build-ing extremities in the two orthogonal directions. Two
walls were provided in each direction as shown in Fig. 2.
The wall dimensions are shown in Table 1, with the
larg-est dimension (Lw) being limited to 9.0 m, and a wall
thickness (tw) of 250–400 mm. The shear wall
cross-sec-tional dimensions were maintained along the building height in order to avoid any possible plastic hinging at higher floors. Normal density concrete of a
characteris-tic compressive strength, fc’, of 40 MPa was used, and the
yield strength of steel reinforcement, fy, was 400 MPa.
The modulus of elasticity of concrete was taken as 28.4
GPa, the concrete density as 24.0 kN/m3, and concrete
Poisson’s ratio was taken as 0.2. It is noted that similar buildings were considered in the literature, e.g., the sam-ple building in the Canadian Concrete Design Handbook
(2005) and the numerical study conducted by Boivin and
Paultre (2010).
3 Analysis and Design of Shear Walls
3.1 Analysis Assumptions
The buildings were modeled using ETABS software (CSI
2013) and response spectrum analyses were performed
for prediction of member forces and displacements in the structural systems. The response spectrum method involves the calculation of maximum member forces
and displacements for each mode shape using a smooth design response spectrum which is the average of several ground motion records of the location considered. The analyses were conducted using the design response
spec-tra of NBCC (2010) for the three locations considered
(Fig. 3). For each building height and location, the shear
walls were analyzed according to the Linear Dynamic Analysis and designed to have three different ductil-ity levels (ductile, moderately ductile and conventional construction).
Modal analysis was performed for each case to obtain
the building’s fundamental period of vibration (Ta). A
5% damping ratio was assumed in the analyses. A rea-sonable assumption of members’ stiffness is required to calculate the structure’s fundamental period of vibration, and hence, to determine the building base shear, inter-nal forces, and displacement demands under the design
seismic loads (Adebar and Ibrahim 2002). In order to
account for the cracking of RC elements, the member stiffness was reduced based on the effective cracked sec-tion properties taken as 20% of the slab gross moment of inertia. For the wall flexural and axial stiffnesses, the
values of section property reduction factor, αw, given by
CSA A23.3-14 (Canadian Standards Association CSA
2014) were calculated according to the equation:
where γw may be taken equal to Ro. The value of αw was
calculated as 0.825, 0.65, and 0.5 for conventional, mod-erately ductile, and ductile walls, respectively. It is worth
noting that the value of αw in CSA A23.3-04 (2004) was
(1) αw=1.0−0.35
RdRo
γw
−1.0
≥0.5 and ≤1.0 20 Stories 15 Stories
10 Stories 5 Stories
Conventional Moderately Ductile Ductile
Construction
Toronto Montreal Vancouver
Total of 32 cases 5 x 5.0 m = 25.00 m
5 x 5.0 m = 25.00
m
Table
1
S
ta
tic and dynamic analy
ses r
esults of the 32 studied c
ases
.
ǂ F
ac
tor
ed f
or
ces a
t the w
all base
.
*S
eismic loads go
ver
ned f
or these cases
taken as 0.7 for shear walls (assuming an axial load of 10% of the wall axial capacity) without any considera-tion of the wall ductility level. The shear wall foundaconsidera-tion was modeled as fixed supports along the wall length. Similar to the shear wall design example in the Concrete
Design Handbook (2005), the columns’ stiffness were
neglected in the numerical model, however, their weight was included in the building seismic weight. For the cases where gravity load resisting system need to be checked for the seismically induced deformations, another model that includes the gravity columns was created for each case. The building floors were assumed to act as rigid dia-phragms in the lateral direction. The seismic weight per floor for the studied buildings ranged between 5200 and 5900 kN. The number of mode shapes considered in the analysis was taken as 12, representing the first four mode
shapes in the three directions (Ux, Uy and Rz). The sum of
modal participating mass ratios (MPMR) in each direc-tion considering the first four mode shapes was found to be at least 0.94 of the total mass, which exceeds the mini-mum required ratio of 0.90 according to the code.
The minimum accidental eccentricity (± 0.1 Dnx)
speci-fied by NBCC (2010) was considered in the analyses,
where Dnx is the plan dimension of the building at level x
normal to the seismic force direction. The dynamic analy-ses showed that the studied buildings are not sensitive to torsion due to the selected location of shear walls (on the building perimeter). Therefore, a minimum design base shear from the DAP equals to 80% of the base shear cal-culated using the ESP was considered as required by the code. It is worth noting that, the 3D modeling is needed in order to account for the torsional effects and to iden-tify if the buildings are sensitive to torsion or not.
The design wind load acting on each building in each location was calculated. The factored base shear due to wind loads was compared to that due to earthquake loads. The wind loads were calculated using the Static
Procedures of NBCC (2010) assuming the buildings
were located in a rough terrain. The importance factors for wind and seismic load calculations were taken as 1.0, which represents a normal importance.
3.2 Shear Wall Design
The shear walls were designed according to the National
Building Code of Canada (2010) and the new provisions
of the Canadian Standard Association (CSA-A23.3-14)
(2014). NBCC (2010) prohibits the conventional
con-struction for shear wall buildings that are more than 40 m and 30 m high for Montreal and Vancouver cities, respectively. Therefore, shear walls designed as conven-tional construction were limited to 10 stories for Mon-treal and Vancouver, while for Toronto, there is no height limitation for RC shear wall buildings. The minimum wall
thickness was taken as ℓu/20 for conventional
construc-tion (minimum of 250 mm), ℓu/14 for moderately ductile
walls, and ℓu/10 for ductile walls, where ℓu is the
maxi-mum unsupported height of the wall between two floors.
NBCC (2010) limits the buildings’ maximum
intersto-rey drift (I.D.) ratio due to seismic loads to 2.5%, while for the cases governed by wind loads, the maximum I.D. ratio due to the service wind loads is limited to 1/500. The shear wall design was conducted using S-Concrete
software (S-Frame Software Inc 2015) and respecting the
aforementioned drift limits. The wall reinforcement was assumed to remain constant along the wall height (same as the plastic hinge region). The gravity columns were
removed at the shear wall location as shown in Fig. 1.
This is because having I-shaped walls has noticeably increased the walls’ stiffness and consequently the seis-mic force attracted to the building.
For ductile and moderately ductile walls, the wall level of ductility at the plastic hinge region is achieved by ensuring that the inelastic rotational capacity of the
wall, θic, exceeds the inelastic rotational demand, θid, as
required by CSA A23.3-14 (2014). θid is calculated as
follows:
where fRdRo is the wall design displacement, �f γw is
the elastic portion of the wall displacement, hw is the wall
total height, and ℓw is the wall length. θic is calculated
according to the equation:
(2)
θid =�fRdRo
−�f γw
hw−ℓw/2
≥ 0.003 for Rd= 2.0, and
≥ 0.004 for Rd= 3.5 Vancouver
T (s)
S(T ) (g
)
0.2 0.5 1.0 2.0 4.0 a
a
0.2 0.4 0.6 0.8 1.0
Toronto Montreal
Fig. 3 The design response spectra of NBCC (2010) for Toronto,
where c is the neutral axis distance, and εcu is the con-crete ultimate compressive strain taken as 0.0035. If the wall rotational capacity was insufficient at the plastic hinge region, a special confinement reinforcement of the wall boundary elements has to be used.
Regardless of the ductility level used, the safety of members that are not part of the seismic force resist-ing system has to be ensured. The safety of gravity load resisting system was checked for each case against the seismically induced deformations according to Cl. 21.11
of CSA-A23.3-14 (2014). For each of the studied cases,
the shear wall design aimed that the building deforma-tions due to seismic loads would not change the design of gravity columns when moderately ductile or ductile walls were used.
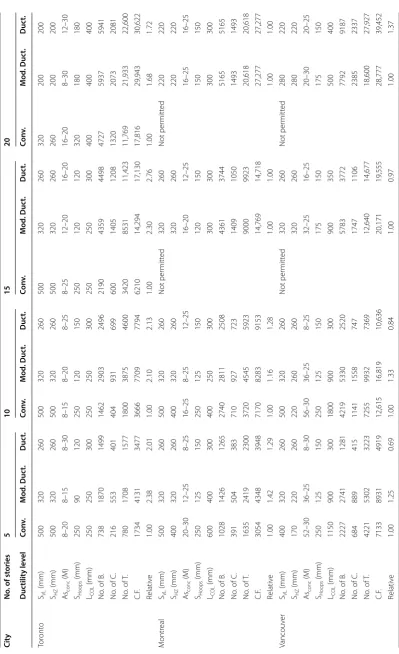
3.3 Analysis Results
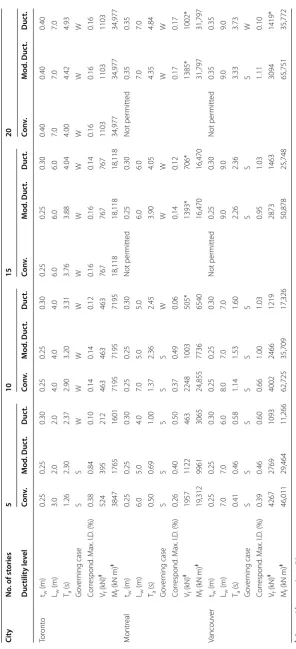
Table 1 shows the results of the static and dynamic
anal-yses for the 32 studied cases. The modal analysis of the studied buildings showed that the fundamental period of
vibration (Ta) for the 5-storey buildings ranged between
0.41 and 2.37 s, for the 10-storey buildings between 1.36 and 3.31 s, for the 15-storey buildings between 2.26
and 4.05 s, and for the 20-storey buildings, Ta ranged
between 3.33 and 4.93 s. Ta from the modal analysis
was compared to the empirical expression presented in
NBCC (2010), and the fundamental period to be used in
the ESP was chosen for each case. For shear wall
build-ings, Ta used in the ESP cannot be greater than twice the
empirical expression of NBCC (2010). The upper limit for
Ta used in the ESP was 0.76, 1.28, 1.74, and 2.16 s for the
5-, 10-, 15- and 20-storey buildings, respectively. The
val-ues of Ta from the modal analysis of the studied buildings
are shown in Table 1.
The table shows the load case that governed the design of shear walls, denoted as (S) for the cases governed by seismic loads, and (W) for the cases governed by wind loads. The table also shows the maximum I.D. ratio of the building due to the governing case of loading. From the analyses, the maximum I.D. ratio due to unfactored seismic loads was 1.17% for the 20-storey ductile build-ing in Vancouver which is less than the 2.5% limit of the code. The maximum I.D. ratio due to unfactored wind loads was 0.17% which is less than the 0.2% limit of the
code. The factored shear force, Vf, and factored
bend-ing moment, Mf, at the wall base were also given in
Table 1. The building base shear due to seismic actions
ranged between 0.004 and 0.039 Wt for buildings in
Toronto, 0.011–0.14 Wt in Montreal, and 0.024–0.30 Wt
(3)
θic= εcuℓw
2c −0.002 ≤ 0.025
in Vancouver, where Wt is the total seismic weight of the
building.
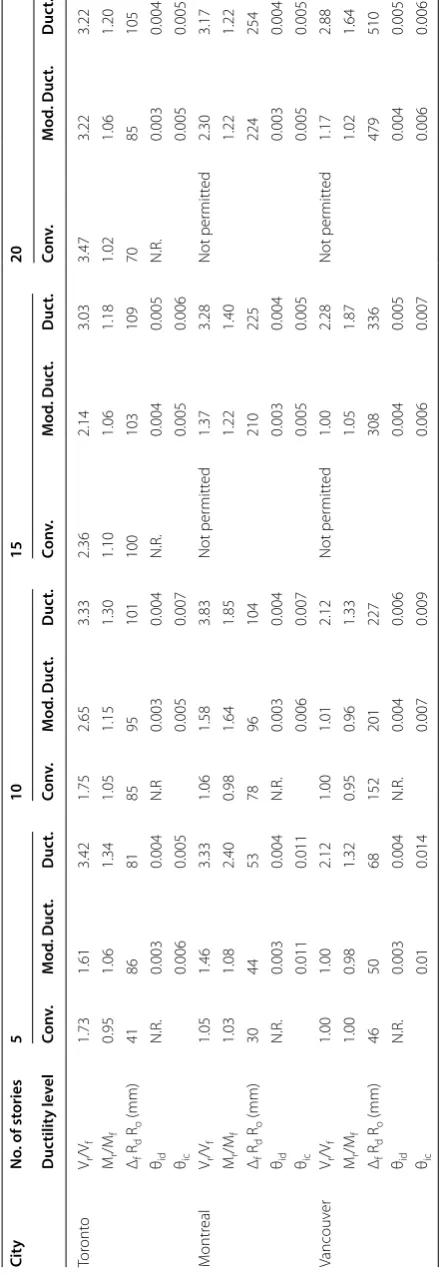
Table 2 shows the overstrength ratios for shear force,
Vr/Vf, and bending moment, Mr/Mf, calculated at the
base of the walls, where Vr and Mr are the factored shear
and moment resistance of the wall at the base. The shear force overstrength ratio at the wall base ranged between 1.00 and 3.83, while the bending moment overstrength ratio at the wall base ranged between 0.95 and 2.40. The high shear force and bending moment overstrength ratios for some cases were due to the increased dimen-sions of the walls in order to limit the building’s drift for the safety of gravity columns under seismic loads. It can
be noted that the wall nonlinear deformation ( fRdRo )
increases as the wall ductility level increases, even for the same wall dimensions and seismic hazard. This can
be attributed to the stiffness reduction factor αw given by
CSA A23.3 (2014) in equation (1) which is a function of
the value of Rd. Table 2 also shows the wall inelastic
rota-tional demand due to factored seismic loads, θid, and the
inelastic rotational capacity of the wall, θic, calculated at
the wall plastic hinge region. To ensure a ductile
behav-iour as required by CSA A23.3-14 (2014), the wall
ine-lastic rotational capacity (calculated using εcu= 0.0035)
must exceed the wall inelastic rotational demand. Oth-erwise, special concrete confinement reinforcement is to be used at the wall boundary elements. In this study, no special confinement reinforcement was required for the studied buildings. The table gives the wall design
dis-placement, fRdRo , that is used for the calculation of θid
and the wall global drift ( �fRdRo/hw).
4 Ductility and Material Quantities
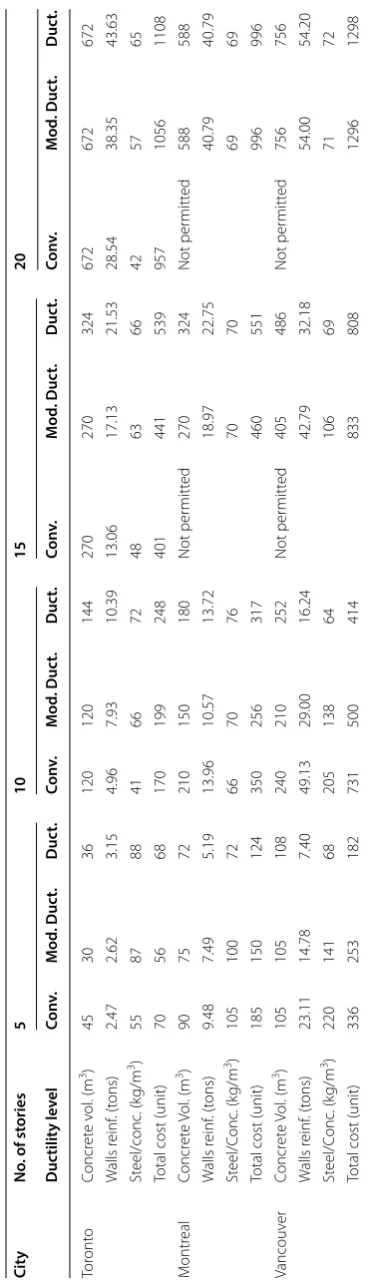
The total amount of concrete and steel reinforcement material used in the walls construction for each building
was calculated and shown in Table 3. The steel
reinforce-ment weight per unit volume of concrete for shear wall
construction ranged between 41 and 88 kg/m3 for
build-ings in low seismic zones (Toronto), 66–105 kg/m3 for
medium seismic zones (Montreal), and 64–220 kg/m3 for
high seismic zones (Vancouver). The table shows that the shear walls designed in high seismic hazard zones had a high steel-to-concrete ratio when designed as conven-tional construction or moderately ductile systems. This is due to the high seismic hazard and the wall design that aimed to minimize the wall section so that the minimum seismic force would be attracted to the building. There-fore, more reinforcement is required for the wall to with-stand the high moment and shear demands.
Table 3 also shows the total material cost estimate
Table
2
Details of the designed shear w
alls f
or the 32 studied c
Table 3 Q uan tities of c oncr et e and st eel r einf or cemen t ma terial f
or the 32 studied c
ases . Ci ty No . of st ories 5 10 15 20 D uc tilit y le vel Co nv . M od . D uc t. D uc t. Co nv . M od . D uc t. D uc t. Co nv . M od . D uc t. D uc t. Co nv . M od . D uc t. D uc t. Tor ont o Concr et e v ol
. (m
3) 45 30 36 120 120 144 270 270 324 672 672 672 W alls r einf . (t ons) 2.47 2.62 3.15 4.96 7.93 10.39 13.06 17.13 21.53 28.54 38.35 43.63 St eel/conc . (k g/m 3) 55 87 88 41 66 72 48 63 66 42 57 65
Total cost (unit)
70 56 68 170 199 248 401 441 539 957 1056 1108 M ontr eal Concr et e Vol
. (m
3) 90 75 72 210 150 180 Not per mitt ed 270 324 Not per mitt ed 588 588 W alls r einf . (t ons) 9.48 7.49 5.19 13.96 10.57 13.72 18.97 22.75 40.79 40.79 St eel/C onc . (k g/m 3) 105 100 72 66 70 76 70 70 69 69
Total cost (unit)
185 150 124 350 256 317 460 551 996 996 Vancouv er Concr et e Vol
. (m
3) 105 105 108 240 210 252 Not per mitt ed 405 486 Not per mitt ed 756 756 W alls r einf . (t ons) 23.11 14.78 7.40 49.13 29.00 16.24 42.79 32.18 54.00 54.20 St eel/C onc . (k g/m 3) 220 141 68 205 138 64 106 69 71 72
Total cost (unit)
assumed to be equal to the price of 10 m3 of concrete. This value was an average value that was selected based on current concrete and steel reinforcement prices in Canada. The unit used for the total material cost given in
the table represents the price of 1 m3 of concrete
mate-rial, i.e., the total cost of concrete and steel material used for the conventional walls of the 5-storey building in
Toronto is equal to 70 times the price of 1 m3 of concrete.
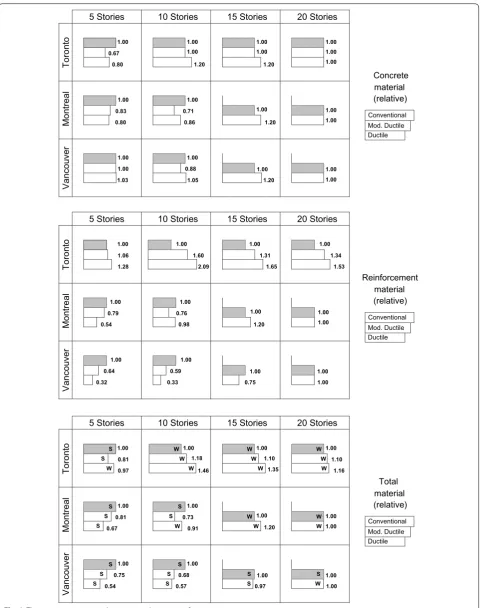
The quantities of concrete and steel material used for shear wall construction was compared to a reference case
and shown in Fig. 4. The reference case was chosen to be
the conventional construction for all buildings, except when conventional construction is not permitted by the code. In that case, the reference was the moderately duc-tile design.
From Fig. 4, it can be seen that for low seismic hazard
zones, designing the walls as moderately ductile required the least material cost for low-rise buildings (repre-sented by the 5-story building in this study). A saving of 19% of the construction cost was achieved when moder-ately ductile walls were used compared to conventional construction. For medium- and high-rise buildings, the conventional construction required the least material quantities. For these buildings, the ductile design led to an increase of the walls’ construction material by up to 20% more concrete and 109% more steel reinforcement. This is due to wind loads that governed the design of medium- and high-rise buildings in low seismic hazard zones, meanwhile imposing the stability and ductility requirements for ductile walls that are not required in this case.
In medium seismic hazard zones, designing the walls as ductile walls required the least material quantities for low-rise buildings. Designing the walls as ductile ones resulted in a saving of 33% in the material cost compared to the conventional construction, and 17% compared to the moderately ductile design. However, for medium- and high-rise buildings, the moderately ductile design led to the least material quantities due to the higher wind loads that governed the design in these cases. It should be noted that conventional construction is not permitted
by NBCC (2010) for RC shear wall buildings higher than
40 m located in medium seismic hazard zones.
For high seismic hazard zones, the figure shows that ductile wall design required the least material cost for all of the studied cases. The ductile wall design provided a saving up to 46% in the material cost compared to con-ventional construction. The saving associated with the use of a ductile system is more noticeable for low-rise buildings. Moreover, the moderately ductile shear walls are not permitted for RC shear wall buildings higher than 60 m (20 stories) located in high seismic zones.
It is worth noting that the concrete and steel reinforce-ment quantities of the foundation system are generally proportional to those of the building’s RC shear walls. The higher wall moment at the base would result in a big-ger wall foundation with more reinforcement. Moreover, the formwork used in the shear wall construction will be directly affected by the concrete volume (shown in
Table 3), i.e., the less amount of concrete used in the wall
construction would reduce the formwork-related cost.
5 Ductility and Rebar Constructability
In addition to the amount of concrete and steel reinforce-ment material used for RC shear wall construction, the rebar work is another factor that affects the economy and constructability of RC buildings. Rebar work accounts for about 30% of the entire reinforcing cost for RC
con-struction, and is also a time‐consuming element of the
construction process (Kang et al. 2013). Despite that
ductile wall design involves stricter requirements that may increase the rebar work compared to conventional construction, the reduced design forces in case of ductile walls can result in a smaller amount of steel
reinforce-ment (as was seen in Fig. 4), which could lead to less
rebar work.
Figure 5 shows a sample reinforcement details for the
10-storey wall located in Montreal when designed as conventional construction, moderately ductile, and
duc-tile systems. Table 4 shows the reinforcement details for
each shear wall design of the studied cases; including the spacing of the 10 M distributed vertical and
horizon-tal reinforcement, SVL and SHZ, the total amount of the
concentrated reinforcement at the end zones, Asconc, the
spacing of the 10 M hoops, SHoops, and the length of the
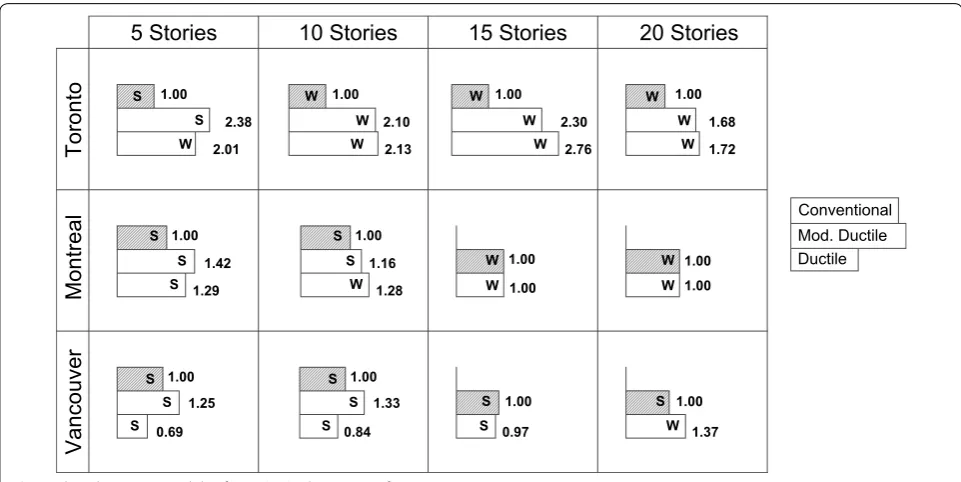
confined end zone, LCOL. In order to evaluate the rebar
work associated with each level of ductility, the total number of bar bends, B., bar cuts, C., and tie wraps, T., used in the construction of one wall were calculated for each of the studied cases. This number (noted as the rebar constructability factor, C.F.) can reflect the com-plexity of assembling the wall reinforcement cages which is one of the main factors affecting the constructability
of RC buildings (Kang et al. 2013). In the calculation of
the proposed C.F., the time and complexity of each of
the three procedures were assumed to be equal. Table 4
shows the data required for the calculation of the C.F. for each shear wall design. The C.F. for each ductility level was compared to a reference value, which is the con-ventional construction case, except when concon-ventional construction is not permitted by the code. In that case, the moderately ductile design was the reference case. The values of the C.F. compared to the reference case are
20 Stories
Toront
o 1.00
0.80 0.67
1.00
1.20
1.00
Montreal
1.00
0.86
0.71 1.00
1.20
1.00
Vancou
ve
r
1.00
1.05
1.00 1.20
1.00 1.00
0.80 0.83
1.00
1.03
1.00
15 Stories 10 Stories
5 Stories
20 Stories
Toront
o 1.00
1.28 1.06
1.00
2.09 1.60
1.00
1.65 1.31
1.00
1.53 1.34
Montreal
1.00 1.20
1.00
Vancou
ve
r
1.00
0.54 0.79
1.00
15 Stories 10 Stories
5 Stories
1.00 1.00 1.00
1.00
1.20 1.00
0.88 1.00
1.00
1.00
0.33
0.59 1.00
0.75
1.00 1.00 1.00
0.32 0.64
1.00
0.98 0.76
20 Stories
Toront
o 1.00
0.97 0.81
1.00
1.46 1.18
1.00
1.35 1.10
1.00
1.16 1.10
Montreal
1.00
0.91
0.73 1.00
1.20
1.00
Vancou
ve
r
1.00
0.57
0.68 1.00
0.97
1.00 1.00 1.00
0.67 0.81
1.00
0.54 0.75
1.00
15 Stories 10 Stories
5 Stories
Ductile Mod. Ductile Conventional
Total material (relative) W
S
W W
W
W W
W
W W W
W W W
W W
S S S
S S
S S
S S
S S
S S
S W S
Reinforcement material (relative) Concrete material (relative)
Ductile Mod. Ductile Conventional Ductile Mod. Ductile Conventional
From the figure, it can be seen that conventional con-struction design required the least rebar work for shear wall buildings located in low and medium seismic hazard zones when conventional construction design is allowed by the code. However, for high seismic hazard zones, the ductile wall design showed the least rebar work when the wall design is governed by the seismic loads.
The results of the current study can be used for the selection of the most suitable ductility level for RC shear wall buildings located in similar seismic hazard zones. According to the relative cost of construction mate-rial, formwork, and rebar work, the engineer can decide which ductility level would be the economic choice for a specific building height and location. However, the conclusions derived in this study would be applicable for buildings with similar dimensions and occupancies. In order to generalize the conclusions, more analyses
are to be conducted for other cases to account for the effect of soil condition, number and value of the build-ing spans, and the location of walls on the buildbuild-ing floor plan. The analyses in this study were conducted for build-ings located in three cities that represent three different seismic hazard zones in Canada. The conclusions derived from these analyses can be applicable for other locations or countries with similar seismic hazard and for shear wall buildings with seismic force reduction factors
simi-lar to those of the NBCC (2010).
6 Conclusions
Four multi-storey reinforced concrete (RC) shear wall buildings with different heights located in three dif-ferent cities in Canada were selected. The cities were selected to represent three different seismic hazard zones (low, medium and high). For each building height t = 250 mmw
L = 400 mmCOL
Conventional
Construction
250 mm
250 mm
Moderately
Ductile
> 5 tw
300 mm
Ductile
8-25M
10M@250 mm
10M@500 mm
10M@400 mm
4-20M
10M@125 mm 10M@320 mm
10M@260 mm 10M@150 mm
300 mm
4-25M
Table
4
Reinf
or
cemen
t details and r
ebar c onstr uc tabilit y of the analyz ed buildings . Ci ty No . of st ories 5 10 15 20 D uc tilit y le vel Co nv . M od . D uc t. D uc t. Co nv . M od . D uc t. D uc t. Co nv . M od . D uc t. D uc t. Co nv . M od . D uc t. D uc t. Tor ont o SVL (mm) 500 320 260 500 320 260 500 320 260 320 200 200 SHZ (mm) 500 320 260 500 320 260 500 320 260 260 200 200 Asconc (M) 8–20 8–15 8–30 8–15 8–20 8–25 8–25 12–20 16–20 16–20 8–30 12–30 SHoops (mm) 250 90 120 250 120 150 250 120 120 320 180 180 LCO L (mm) 250 250 300 250 250 300 250 250 300 400 400 400 No
. of B
. 738 1870 1499 1462 2903 2496 2190 4359 4498 4727 5937 5941 No
. of C.
216 553 401 404 931 699 600 1405 1208 1320 2073 2081 No
. of T
. 780 1708 1577 1800 3875 4600 3420 8531 11,423 11,769 21,933 22,600 C.F . 1734 4131 3477 3666 7709 7794 6210 14,294 17,130 17,816 29,943 30,622 Relativ e 1.00 2.38 2.01 1.00 2.10 2.13 1.00 2.30 2.76 1.00 1.68 1.72 M ontr eal SVL (mm) 500 320 260 500 320 260 Not per mitt ed 320 260 Not per mitt ed 220 220 SHZ (mm) 400 320 260 400 320 260 320 260 220 220 Asconc (M) 20–30 12–25 8–25 16–25 8–25 12–25 16–20 12–25 16–25 16–25 SHoops (mm) 250 125 150 250 125 150 120 150 150 150 LCO L (mm) 600 400 300 400 250 300 300 300 300 300 No
. of B
. 1028 1426 1265 2740 2811 2508 4361 3744 5165 5165 No
. of C.
391 504 383 710 927 723 1409 1050 1493 1493 No
. of T
. 1635 2419 2300 3720 4545 5923 9000 9923 20,618 20,618 C.F . 3054 4348 3948 7170 8283 9153 14,769 14,718 27,277 27,277 Relativ e 1.00 1.42 1.29 1.00 1.16 1.28 1.00 1.00 1.00 1.00 Vancouv er SVL (mm) 400 320 260 500 320 260 Not per mitt ed 320 260 Not per mitt ed 280 220 SHZ (mm) 170 220 260 220 260 260 320 260 280 220 Asconc (M) 52–30 36–25 8–30 56–30 36–25 8–25 32–25 16–25 20–30 20–25 SHoops (mm) 250 125 150 250 125 150 175 150 175 150 LCO L (mm) 1150 900 300 1800 900 300 900 350 500 400 No
. of B
. 2227 2741 1281 4219 5330 2520 5783 3772 7792 9187 No
. of C.
684 889 415 1141 1558 747 1747 1106 2385 2337 No
. of T
and location, the shear walls were designed as ductile, moderately ductile, or conventionally constructed sys-tems. In low seismic hazard zones, it was found that conventional construction design required the least construction material quantities for medium- and high-rise shear wall buildings (10-storey high or more). How-ever, for low-rise buildings (represented by the 5-storey building), a saving of 19% in the construction material cost was achieved when moderately ductile walls were used. In medium seismic hazard zones, the moderately ductile design required the least material quantities for medium- and high-rise shear wall buildings, while for the low-rise buildings, a saving of 33% in the material cost was achieved when ductile design was applied. In high seismic hazard zones, the ductile wall design required the least material cost for all building heights. They provided a saving up to 46% of the total material cost compared to the conventional construction.
The analyses and design results showed that conven-tional construction design required the least rebar work for RC shear wall buildings located in low and medium seismic hazard zones when conventional construction design is permitted by the code. However, for high seis-mic hazard zones, the ductile wall design showed the least rebar work. Given the material quantity estimate and the rebar work associated with each ductility level for a certain building height and location, the structural engineer can decide the most economical and construct-ible design for RC shear wall buildings at the conceptual design stage.
Authors’ contributions
HE carried out the numerical and analytical studies, and drafted the manu‑ script. KG participated in the paper interface and reviewed the manuscript drafts. Both authors read and approved the final manuscript.
Author details
1 Department of Building, Civil and Environmental Engineering, Concordia University, 1515 St. Catherine West, Montreal H3G 2W1, Canada. 2 Department of Structural Engineering, Ain Shams University, 1 ElSarayat Street, El‑Abba‑ seya, Cairo 11517, Egypt.
Acknowledgements
The financial support of the Natural Science and Engineering Research Council of Canada (NSERC) is highly appreciated. The authors also would like to thank Stantec for their support through this research project.
Publisher’s Note
Springer Nature remains neutral with regard to jurisdictional claims in pub‑ lished maps and institutional ailiations.
Received: 10 March 2017 Accepted: 16 April 2018
References
Adebar, P., Bazargani, P., Mutrie, J., & Mitchell, D. (2010). Safety of gravity‑load columns in shear wall buildings designed to Canadian standard CSA A23.3. Canadian Journal of Civil Engineering,37(11), 1451–1461. Adebar, P., & Ibrahim, A. (2002). Simple nonlinear flexural stiffness model for
concrete structural walls. Journal of Earthquake Spectra,18(3), 407–426. Adebar, P., Mutrie, J. De Vall, R., and Mitchell, D. (2014). Seismic design of
concrete buildings: The 2015 Canadian building code. In Proceedings of the 10th U.S. National Conference on Earthquake Engineering, Earthquake Engineering Research Institute, Anchorage, AK.
Adebar, P., Mutrie, J., & DeVall, R. (2005). Ductility of concrete walls: The Cana‑ dian seismic design provisions 1984 to 2004. Canadian Journal of Civil Engineering,32(6), 1124–1137.
20 Stories
Toront
o
1.002.01 2.38
1.00
1.72 1.68
Montreal
1.00 1.00
1.00
Vancouve
r
1.00 0.97
1.00 1.37 1.00
1.29 1.42
1.00
0.69 1.25
1.00
15 Stories
10 Stories
5 Stories
Ductile Mod. Ductile Conventional W
S W
W W
W
W W W
W S
S S
S S S
S S
S W
S 1.00
2.13 2.10 W W
W 1.00
2.76 2.30 W W
1.00
1.28 1.16 S
S W
1.00
0.84 1.33 S
S S
Boivin, Y., & Paultre, P. (2010). Seismic performance of a 12‑storey ductile con‑ crete shear wall system designed according to the 2005 National Building Code of Canada and the 2004 Canadian Standard Association Standard A23.3. Canadian Journal of Civil Engineering,37(1), 1–16.
Canadian Standards Association CSA. (2004). Design of concrete structures A23.3‑04, Mississauga, Ontario, Canada.
Canadian Standards Association CSA. (2014). Design of concrete structures A23.3‑14, Mississauga, Ontario, Canada.
Choopool, N., & Boonyapinyo, V. (2011). Seismic performance evaluation of reinforced concrete moment resisting frames with various ductility in low seismic zone. American Journal of Engineering and Applied Sciences,4(1), 17–36.
CSA CAN/CSA‑A23.3‑04 (2005). Concrete design handbook. Ottawa (Ontario): Canadian Portland Cement Association.
CSI. (2013). Analysis reference manual for SAP2000, ETABS, and SAFE. California: Computers and Structures Inc.
Filiatrault, A., Lachapelle, E., & Lamontagne, P. (1998). Seismic performance of ductile and nominally ductile reinforced concrete moment resisting frames. I. Experimental study. Canadian Journal of Civil Engineering,25(2), 331–341.
Galal, K., & El‑Sokkary, H. (2008). Analytical evaluation of seismic performance of RC frames rehabilitated using FRP for increased ductility of members. Journal of Performance of Constructed Facilities (ASCE),22(5), 276–288. Heidebrecht, A., & Naumoski, N. (1999). Seismic performance of ductile
medium height reinforced concrete frame buildings design in accord‑ ance with the provisions of the 1995 National Building Code of Canada. Canadian Journal of Civil Engineering,26(5), 606–617.
Hutchison, D., & Van Geldermalsen, T. (1983). Optimum design of reinforced concrete shear walls. Bulletin of the New Zealand National Society for Earthquake Engineering,17(3), 185–197.
NBCC (2010). National Building Code of Canada. Associate Committee on the National Building Code, National Research Council of Canada, Ottawa, Ontario.
Paulay, T., Priestley, M., & Synge, A. (1982). Ductility in earthquake resisting squat shear walls. ACI Journal,79(4), 257–269.
Priestley, M., & Park, R. (1987). Strength and ductility of concrete bridge col‑ umns under seismic loading. ACI Structural Journal,84(1), 61–76. Pullmann, T., Skolicki, Z., Freischlad, M., Arciszewski, T., De Jong, K., Schnellen‑
bachHeld, M. (2003). Structural design of reinforced concrete tall build‑ ings: Evolutionary computation approach using fuzzy sets. In Proceedings of the 10th International Workshop of the European group for intelligent computing engineering, Delft, Netherlands, pp. 53–61.
Sadjadi, R., Kianoush, M., & Talebi, S. (2007). Seismic performance of rein‑ forced concrete moment resisting frames. Engineering Structures,29(9), 2365–2380.
Wallace, J. (1994). New methodology for seismic design of RC shear walls. Journal of Structural Engineering,120(3), 863–884.
S‑Frame Software Inc. (2015). S‑concrete: Concrete section design, version 11.00.31. Maycrest Way, Richmond, B.C., Canada.