www.wjpmr.com 40
PHYSICAL PARAMETERS OPTIMIZATION FOR ENHANCEMENT OF PRODIGIOSIN
PRODUCTION BY USING
SERRATIA SPP
.
1*
Phatake Y. B. and 2Dharmadhikari S.M.
1Department of Microbiology, Vidya Pratishthan School of Biotechnology, Baramati, Maharashtra.
2
Department of Microbiology, Government Institute of Science, Aurangabad.
Article Received on 21/08/2016 Article Revised on 10/09/2016 Article Accepted on 30/09/2016
INTRODUCTION
From old days humans have traditionally preferred natural sources to add colors to food, clothing, cosmetics and medicinal product. Microbes have advantages of versatility and productivity over higher forms of life in the industrial-scale production of natural pigments and dyes. Microbial pigments have two meaningful advantages over artificial and inorganic colors. One relates to fermentation, which is an inherently faster and more productive production compared to any other chemical process. The other enduring strength of microbes is their relatively large and easily manipulated strands of genes (Canizares, V. R. O. et al., 1998).
Nearly for all living organisms crucial environmental signals for regulating development and physiological
process are light, temperature, pH, humidity etc. Consequently, the capacity of organism to sense light signal and respond to it is extensive present in kingdoms, from archaea and fungi to humans (Arden, G. B. et al., 1996 and Babitha, S. et al., 2008). Several studies on the factors influencing the formation of the red pigment prodigiosin by Serratia spp. have been made. In general, such studies have included the influence of carbon source, nitrogen source, pH of the medium, time of incubation etc.
Light has a crucial influence on microorganisms due to its capability of inducing morphological and behavioral changes (Casas-Flores, et al., 2006 and Soumya, K. et al., 2014). The effect of different wavelength of light on pigment production in fungi was
ISSN 2455-3301
WJPMR
AND MEDICAL RESEARCH
www.wjpmr.com*Corresponding Author: Phatake Y. B.
Department of Microbiology, Vidya Pratishthan School of Biotechnology, Baramati, Maharashtra.
ABSTRACT
The nutrients require for the growth of the microorganisms is mainly classified as macro nutrients like carbon, nitrogen etc. and micronutrients like iron, calcium etc. The macro nutrients seriously affect growth of the microorganism and yield of the secondary metabolite. Light play important role in the life of animal and plant but microorganisms also show morphological and behavioral changes in presence of different wavelength of the light. So it is necessary to optimize the production process with respect to growth condition and nutrient level to get maximum yield of the product. In this study effect of different physical parameters including light on prodigiosin production was determined and process were further optimized by using classical approach. The study reveal the effect of pH of the medium, time of incubation, temperature of incubation, speed of agitation and different wavelength of light on the red pigment prodigiosin production and on the yield of biomass. As well as stability of produced pigment to the pH. Maximum yield of pigment was obtained in unit/ cell when producer organisms were
inoculated in peanut broth of pH 7, incubated at 100rpm in 28ºC temperature for 72hrs. In this study effect of
spectrum of light on pigment and biomass production was also determined. Maximum pigment production in unit/ cell was observed when inoculated broth were subjected to white light followed by yellow light and blue light. The incubation in red and green light reduces the yield of pigment but they did not completely inhibit the synthesis of it. Increased pigment production was observed in total white light as compared to the flasks completely exposed to darkness. The visual comparison of the extracted pigment exhibited varied shades of color to different wavelengths of light. Broth exposed to white light incubation yielded a deep red colored pigment whereas yellow light incubation yielded a light red to orange colored pigment. The yield of biomass also changes according to pigment yield, white, blue and yellow light give high yield of biomass, whereas red light and green light reduced the cell growth. The stability of the pigment to pH was also determined. At extremely acidic pH, the red colour pigment appeared as pink (1 to 5).While in highly basic condition, the pigment was almost decolorized (9 to 13).
www.wjpmr.com 41 well studied. Researcher had found that production of
colour compounds in fungi significantly affect by intensity of light and its wavelength.
The researcher has found that light is also a very important factor which affects production of pigment and biomass not only in bacteria but also in Actinomycets (Pearce, G. W. and Streeter, I. R. 1931).The capacity to sense and respond to light is wide spread in animals, plants, fungi and bacteria. Electrical signals have been detected in response to light excitation of the bacteria Serratia marcescens. These signals are related to the wavelength and intensity of the stimulus and the growth stage of the bacteria. (Babitha, S. et. al., 2008).
In the last decade, there has been a great increase in utilization of natural pigments in the food industries, replacing the implementation of artificial coloring agents, in order to provide a healthier food for consumers. However, in comparison with the natural coloring agents, the artificial coloring agents show greater resistance and stability when exposed to oxidation, changes in temperature, pH and other factors (Francis, 1989; Hong and Wrolstad 1990; She, et al., 1992; Fabre, et al., 1993, Laleh, et al., 2006).
In this study effect of pH of the medium, time of incubation, temperature of incubation, speed of agitation and different wavelength of light on the red pigment production and on the biomass yield of producer organism were studied. As well as stability of produced pigment to the pH were also determined by exposing crude pigment to various pH.
MATERIAL AND METHOD
For the present study bacterial strains of Serratia marcescens (YP 2, YP 10, YP 14 and YP16) previously isolated from soil and water samples and characterized
by using Bergey’s Manual of Determinative
Bacteriology (Holt, et al., 1989) and Benson’s
Microbiological Applications, Laboratory Manual in General Microbiology (Brown, 2007), (Nageswaran, N. et al., 2014) was used (Phatake, Y. B. et al., 2015). Strains were lyophilized and also maintained on nutrient agar slant at 4ºC and stored at microbial culture collection unit of Vidya Pratishthan. School of Biotechnology, Baramati, Maharashtra, India. Inoculum was prepared in peanut broth (g/L): peanut powder 25, pH 7 by transferring a loop of the bacteria from stock culture and incubated at 37oC, for 24 hr.
Optimization of Production Process
In order to determine the optimum condition for production of prodigiosin, selected strains of Serratia marcescens were grown in Peanut broth. For optimization of the pH, bacterium were inoculated in peanut broth having different pH viz. 5, 5.5, 6, 6.5, 7, 7.5, 8, 8.5, and 9, for optimization of time of incubation organism was incubated for different time interval viz. 24, 48, 72 and 96 h. and then for optimization of
temperatures organism were incubated in temperatures Viz. 25oC, 28oC, 31oC, 34oC and 37oC for 72h. To check the effect of agitation on the yield of prodigiosin all four isolates were inoculated in the peanut broth and incubated at 28oC for 72 hours at different rpm viz. 00, 25, 50, 75, 100, 125.
All the experiments were carried out in triplicates and m ean yield and standard error was calculated for each obse rvation. Pigment yield in unit /Cell was calculated by using following formula (Mekhael R. and Yousif S.Y. 2009).
Prodigiosin Unit/cell =
[OD. 499 - (1.381 x OD 620)] x 1000
OD 620 OD 499: Pigment absorbance.
OD 620: Bacterial cell absorbance. 1.381: Constant
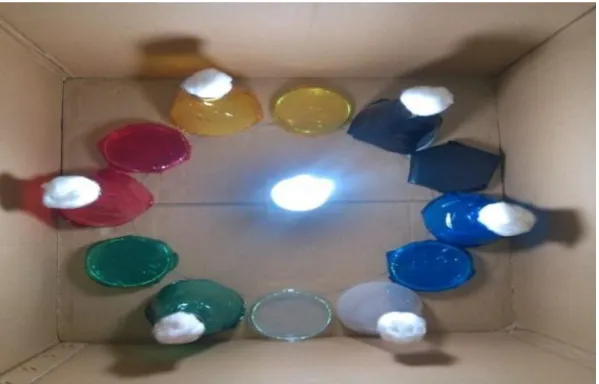
Effect of light spectrum on prodigiosin production. On the basis of optimization studies, single potent pigment producing strain of serratia (YP 2) was cultured in 100 ml of Peanut Broth, to study the effect of different wavelengths of light on biomass and pigment production. For this experiment, instead of using different wavelengths of light, different colored gelatin papers were used. Because colored paper allow only selected wavelength of light to pass through it, whereas it filters out all other wavelengths. The flasks were wrapped in gelatin papers of red, blue, green and yellow colors. One flask was covered with black art paper to completely cut off the light and one flask was kept as control which was exposed to white light. All the flasks (Fig.No.2) were placed at equidistant (15cm) from the illuminated light source (Philips CFL 25 watts) after inoculation (0.1 ml) of selected strain of bacteria (Soumya, K. et al., 2014).
www.wjpmr.com 42 Effect of light spectrum on biomass.
After regular time interval cell mass was separated from the broth by centrifugation and filtration. The separated cell mass was washed thrice with distilled water and concentrated in hot air oven at 80oC and the concentrated biomass was weighed in a pre-weighed beaker to estimate dry weight.
Stability of pigments to different pH.
The extracted red colour pigment prodigiosin was tested for its stability to pH ranging from extremely acidic (1) to highly basic (13). For this, pigment dissolve in methanol was distributed in seven tubes and pH of each vial was adjusted with the help of 0.1N HCL and NaOH. The observation in the form of change in colour and change in lambda max value was recorded.
RESULT AND DISSCUTION Optimization of production process. Effect of pH of the medium on prodigiosin production.
The pH plays a vital role in maintaining the acidic or basic condition in the medium. The pH provides an environment for the microorganism to grow luxuriantly.
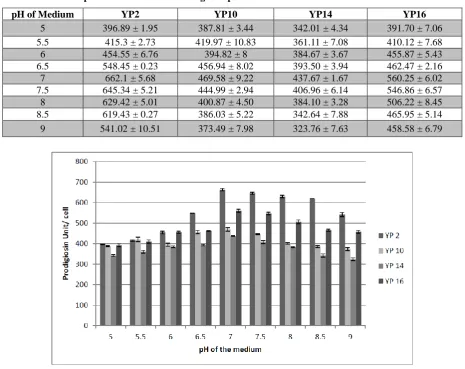
Effect of different pH viz. 5, 5.5, 6, 6.5, 7, 7.5, 8, 8.5, and 9 was tested on production of prodigiosin. After incubation pigment was extracted and the concentration was estimated. The maximum yield of pigment in unit/cell (662.1), was obtained in the peanut broth with pH 7 when inoculated with YP 2. Followed by YP 16, YP 10 and YP 14. Further increase in pH resulted in decreased in prodigiosin production. Pryce, L. H. et al., (2000) reported that, more prodigiosin was produced at pH 7. Davaraj, N. et al., (2009) have used trypticase soya broth for the production of prodigiosin. They have tested pH 4 to 10 for the optimized prodigiosin production. They found that pH 7 and pH 8 shows maximum prodigiosin production. Sundaramoorthy, et al., (2009) was found that, prodigiosin production was maximum at pH 7.0. Our result also in agreement with result obtained by Chandni, et al.,(2012). Previous studies also reveal that the glucose decreased the yield of pigment when present in the medium due to lowering the pH (Solo, et al., 1997).
Table No.1: Effect of pH of the medium on Prodigiosin production.
pH of Medium YP2 YP10 YP14 YP16
5 396.89 ± 1.95 387.81 ± 3.44 342.01 ± 4.34 391.70 ± 7.06
5.5 415.3 ± 2.73 419.97 ± 10.83 361.11 ± 7.08 410.12 ± 7.68
6 454.55 ± 6.76 394.82 ± 8 384.67 ± 3.67 455.87 ± 5.43
6.5 548.45 ± 0.23 456.94 ± 8.02 393.50 ± 3.94 462.47 ± 2.16
7 662.1 ± 5.68 469.58 ± 9.22 437.67 ± 1.67 560.25 ± 6.02
7.5 645.34 ± 5.21 444.99 ± 2.94 406.96 ± 6.14 546.86 ± 6.57
8 629.42 ± 5.01 400.87 ± 4.50 384.10 ± 3.28 506.22 ± 8.45
8.5 619.43 ± 0.27 386.03 ± 5.22 342.64 ± 7.88 465.95 ± 5.14
9 541.02 ± 10.51 373.49 ± 7.98 323.76 ± 7.63 458.58 ± 6.79
www.wjpmr.com 43 Effect of time of incubation on prodigiosin
production.
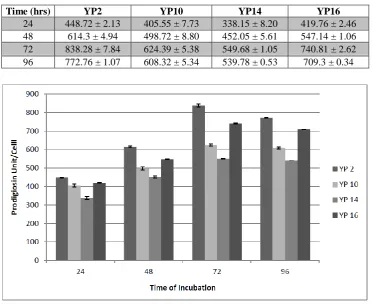
Effect of different incubation time viz. 24, 48, 72 and 96 hr. on production of prodigiosin were tested. After equal
time interval pigment was extracted and the
concentration was estimated. The maximum yield (838.28) of pigment in unit/cell was obtained after 72 hr. incubation when inoculated with YP 2. Followed by YP 16, YP 10 and YP 14. Further increase in incubation time do not showed notable effect on pigment yield.
Davaraj, N. et al., (2009) has reported maximum
pigment production on fifth and seventh day of incubation whereas the pigment production completely reduces after seventh day of incubation. Samrot, et al., (2011) reported that, more prodigiosin was produced after incubation of 72hr. After 72 hr. the rate of prodigiosin production was reduced. The observation suggests that producer organism produced pigment in stationary phase of growth.
Table No. 2: Effect of time of incubation on Prodigiosin production.
Time (hrs) YP2 YP10 YP14 YP16
24 448.72 ± 2.13 405.55 ± 7.73 338.15 ± 8.20 419.76 ± 2.46
48 614.3 ± 4.94 498.72 ± 8.80 452.05 ± 5.61 547.14 ± 1.06
72 838.28 ± 7.84 624.39 ± 5.38 549.68 ± 1.05 740.81 ± 2.62
96 772.76 ± 1.07 608.32 ± 5.34 539.78 ± 0.53 709.3 ± 0.34
Fig. No. 2: Effect of Time of Incubation on Prodigiosin Production.
Effect of temperature of incubation on prodigiosin production.
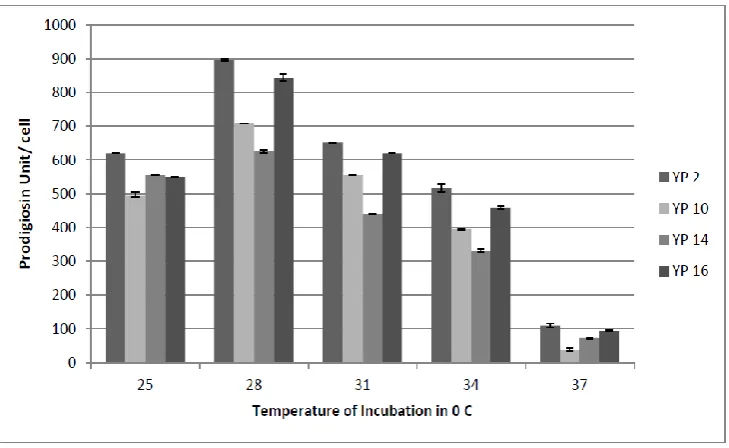
Effect of incubation temperature viz. 25, 28, 31, 34 and 37oC on production of prodigiosin was studied. After incubation, pigment was extracted and the concentration was estimated. The maximum yield (895.90) of pigment in unit/cell was obtained in 280C.when inoculated with YP 2. Followed by YP 16, YP 10 and YP 14. It was also found that with increase in incubation temperature, there was a decrease in the yield of prodigiosin.
According to Samrot, et al., (2011) prodigiosin not produced above 37oC, but as temperature decreases rate of production increases. The organism was found to produce more prodigiosin at 28oC at 72 hr. Williams & Hussain Quadri (1980) reported that, no prodigiosin was produced when cultures were incubated at 38oC, however pigment production was observed when the temperature was shifted to 25oC -30oC.
Table No. 3: Effect of incubation temperatures on Prodigiosin production.
Temperatures oC YP2 YP10 YP14 YP16
25 619.34 ± 0.32 495.59 ± 6.94 554.5 ± 0.60 549.86 ± 0.92
28 895.90 ± 3.38 708.41 ± 0.53 625.10 ± 5.42 843.91 ± 9.39
31 651.21 ± 0.31 554.46 ± 0.60 439.62 ± 1.39 619.01 ± 00
34 515.63 ± 11.86 394.91 ± 2.96 331.45 ± 4.08 458.49 ± 3.00
www.wjpmr.com 44 Fig. No. 3: Effect of incubation temperatures on Prodigiosin production.
Effect of agitation on prodigiosin production.
Effect of speed of agitation (viz. 0, 25, 50, 75, 100 and 125 rpm) on production of prodigiosin was determined by incubating inoculated peanut broth at various rpm. After production of prodigiosin it was extracted and the
concentration was estimated. The maximum yield (930.74) of pigment was obtained in flask agitated at 100 rpm when inoculated with YP 2. With the increase in the speed of the agitation above 100 rpm, a decrease in the yield of prodigiosin was observed.
Table No. 4: Effect of speed agitation on Prodigiosin production.
rpm YP2 YP10 YP14 YP16
0 305.12 ± 4.48 197.22 ± 5.80 149.73 ± 7.64 256.85 ± 10.11
25 456.94 ± 8.02 401.88 ± 6.25 287.42 ± 5.31 412.14 ± 1.61
50 608.22 ± 5.88 473.26 ± 6.60 408.81± 1.70 498.24 ± 8.77
75 713.29 ± 5.16 514.27 ± 0.75 449.5 ± 8.89 560.8 ± 8.42
100 930.74 ± 4.49 825.4 ± 1.41 713.62 ± 4.97 824.39 ± 0.60
125 916.35 ± 1.55 740.10 ± 0.80 636.44 ± 0.55 838.28 ± 7.84
www.wjpmr.com 45 Effect of light spectrum on prodigiosin production.
Fig. No. 5: Experimental setup to check effect of light spectrum on production process.
Table No. 5: Effect of Light Spectrum on Prodigiosin Production.
Time (hrs.) Black Blue Green Yellow Red White
24 331 ± 40.0 257 ±5.57 158 ± 11.7 240 ± 41.5 200 ± 43.8 392 ±4.7
48 470 ± 8.7 549 ± 30.4 279 ± 32.3 427 ± 35.25 338 ± 5.8 534 ± 23.1
72 602 ± 9.4 650 ± 9.2 607 ± 5.6 624 ± 4.9 521 ± 27.7 816 ± 9.8
96 560 ± 5.8 624 ± 5.5 549 ± 6.1 581 ± 19.5 478 ± 5.4 599 ±10
120 514 ±13 360 ±7.3 284 ±21.6 540 ±40.3 258 ±4.5 556 ± 5.5
Effect of light spectrum on pigment production (unit / cell).
Fig. No. 6: Effect of Light Spectrum on Pigment Production.
Effect of light spectrum on biomass production (g / L).
Table No. 6: Effect of Light Spectrum on Biomass Production.
Time (hrs.) Black Blue Green Yellow Red White
24 3.23 ± 0.14 4.73 ± 0.14 4.76 ± 0.14 3.73 ± 0.14 4.03 ± 0.08 5.63 ± 0.08
48 6.23 ± 0.14 6.76 ± 0.14 7.23 ± 0.37 6.8 ± 0.15 7.13 ± 0.27 9.03 ± 0.26
72 9.1 ± 0.20 11.26 ± 0.50 9.86 ± 0.18 10.23 ± 0.31 10.1 ± 0.09 12.76 ± 0.14
96 7.13 ± 0.08 8.26 ± 0.09 8.63 ± 0.08 8.23 ± 0.14 8 ± 0.11 10.5 ± 0.05
www.wjpmr.com 46 Fig. No. 7: Effect of Light Spectrum on Biomass Production.
The results show that production of pigment and biomass in Serratia spp. is highly depends on the intensity and wavelengths of light. Here, the culture under submerged condition was exposed to different colors and thus different wavelengths of light (Blue, Green, Yellow, Red, White and Darkness). Maximum pigment production was observed in white light 816 ± 9.8 unit/cell followed by blue light (650 ± 9.2 unit/cell) and yellow light (624 ± 4.9 unit/cell) (Fig. No.6), though incubation of organism in black, red and green light gives comparatively less yield, it was not completely inhibited. Increased pigment production was observed in total white light as compared to the flasks completely exposed to darkness. The visual comparison of the extracted pigment exhibited varied shades of color to different wavelengths of light. The white light incubation yielded a deep red colored pigment whereas yellow light
incubation yielded a light red to orange colored pigment. In relation with the above observation white, blue and yellow light give high yield of biomass (12.76 ± 0.14, 11.26 ± 0.50 and 10.23 ± 0.31 respectively), whereas in red and green light biomass yield was decreases (Fig.7). The growth was also monitored on solid media to determined effect on colony diameter and morphology. Colony exposed to White light exhibited highest radial growth and red light showed the least diameter on the solid media. No notable effect of other lights on the said character was observed.
The effect of light source on the pH of the medium was also determined and it was found that as time of incubation increases pH of the medium also increase from neutral to basic in all flasks.
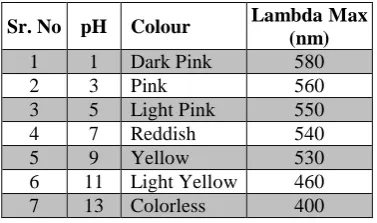
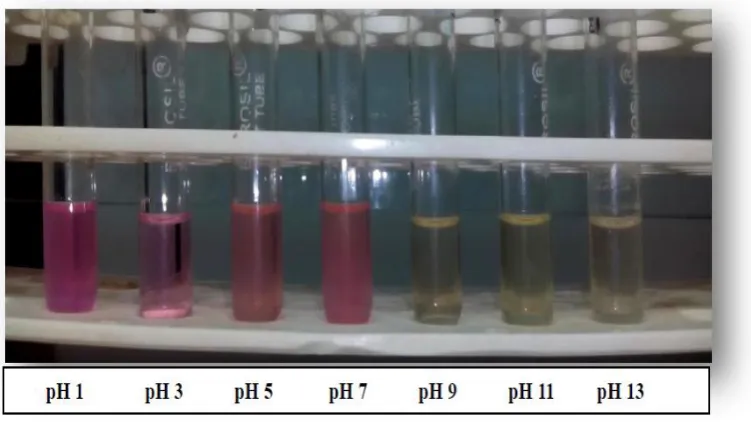
Stability of pigments to different pH.
Table No.7: Stability of Prodigiosin to pH.
Sr. No pH Colour Lambda Max (nm)
1 1 Dark Pink 580
2 3 Pink 560
3 5 Light Pink 550
4 7 Reddish 540
5 9 Yellow 530
6 11 Light Yellow 460
www.wjpmr.com 47 Fig. No. 8: Stability of Prodigiosin to pH.
At extremely acidic pH (1 to 5), the red colour pigment appeared as pink probably due to protonation of pyroll ring nitrogen fecilated by high concentration of H+ ions in the solution. While in highly basic pH (9 to 13), the pigment was almost decolorized. The decrease in color intensity in basic condition can be attributed to the deprotonation of nitrogen from the three conjugated rings of pigment structure that give it stability (Komzen, et al., 2006). The U V visible analysis of each tube gives maximum absorption peak (ʎmax). For this methanol was used as blank.
It was found that absorption maxima changes with pH. The primary reason for stronger absorption of pigment at lower wavelength was the electron conjugation effect or delocalization of electrons, which is substantiated by Mohan, et al., 2007.
CONCLUSION
In the present study it was concluded that peanut seed medium was a good medium for prodigiosin production. Out of selected four strain of Serratia spp. YP 2 was found as potent pigment producer when inoculated in the medium with pH 7, time of incubation 72hr. and temperature of incubation 28oC. It was also found that agitation of the medium can significantly affect production process. The study also reveal the effect of different wavelength of light on pigment and biomass producing ability of Serratia spp. It shows that white light is best for pigment and biomass production followed by blue and yellow light. The red and green light showing inhibitory effect on the pigment production. As pH of the medium increases linearly with the time, indicating that, at the time of growth and production process of the pigment, producer organism does not produce acids in the medium. The stability of produced pigment to the pH was also check, which shows that pigments coloration pattern is very much sensitive to change in the pH of the medium.
From the result obtained it was concluded that production of pigment and biomass in Serratia spp. is greatly depend upon type of light. The effect of intensity of light spectrum on the red pigment production can be a topic of interest in future for the researcher working in this area. The color of the pigment and its lambda max value changes with change in pH, suggest that pigment prodigiosin is very much sensitive to pH change and it can be used as pH indicator.
AKNOWLEDGMENT
The authors are thankful to Vidya Pratishthan School of Biotechnology, Baramati, Maharashtra, India for providing infrastructure facilities for this study. Authors are grateful to Dr. Sushama Chaphalkar, former Director of Vidya Pratishthan School of Biotechnology for her constant encouragement to completing this work and we would also like to express our special thanks and deepest appreciation to Mr. Ashish Koli for his constant support during this work.
REFERRENCES
1. Antony V, Chandana K, Senthilkumar P. Optimized
Production of Prodigiosin from Serratia marcescens SU-10 Grown as Batch Culture and Evaluation of Bioactivity of Produced Prodigiosin. International Journal of Medico biological, 2011; 1(3): 145-150.
2. Arden GB, Ikeda H, Siegal IM. New components of
the mammalian receptor potential and their relation to visual photochemistry. Vision Res, 1996; 6: 373– 384.
3. Babitha S, Carvahlo JC, Soccol CR, Pandey A.
www.wjpmr.com 48 4. Bunting MI. A description of some color variants
produced by Serratia marcescens, strain 274.J. Bacteriol, 1939; 40: 57-68.
5. Canizares VR, Rios O, Olvera LE, Ponce NT,
Marquez RF. Microbial sources of pigments. Rev. Latinoam. Microbiol, 1998; 40: 87–107.
6. Casullo de Araujo HW, Fukushima K, Campos
Takaki GM. Prodigiosin production by Serratia
marcescens ucp 1549 using renewable-resources as a low cost substrate. Molecules, 2010; 15: 6931-6940.
7. Chen MH, Johns MR. The effect of pH in nitrogen
source on pigment production by Monascus
purpureus. Applied Microbiology and Biotechnology, 1993; 40: 132-138.
8. Davaraj NR, Dhanasekaran D, Thajuddin N.
Production of Prodigiosin from Serratia marcescens and its Cytotoxicity activity. Journal of Pharmacy Research, 2009; 2(4): 590-593.
9. Giri AV, Anandkumar N. Muthukumaran G.
Pennathur G. A novel médium for the enhanced cell growth and production of Prodigiosin from Serratia marcescensis isolated from soil. BMC Microbiology, 2004; 4: 11.
10. Fabre CE, Santeri AL, Lorete MO, Baberian R,
Pareilleux A, Goma G, Blanc PJ. Production and food applications of the red pigments of Monascus rubber. J. Food Sci, 1993; 58: 1099-1111.
11. Francis F. Food colourants: Anthocyanins. Critical Reviews in Food Science and Nutrition. 1989; 28: 273- 314.
12. Hong V. Wrolstad R. Characterization of
anthocyanin-containing colorant and fruit juices by HPLC/photodioded array detection. J. Agri. Food Chem, 1990; 38: 698-708.
13. Kamble KD, Hiwarale VD. Prodigiosin production
from Serratia marcescens strains obtained from farm soil. International journal of environmental sciences, 2012; 3: (1).
14. Khanafari A, Assadi MM, Fakhr FA. Review of
prodigiosin, pigmentation in Serratia marcescens. Online journal of biological sciences, 2006; 6(1): 1-13.
15. Laleh GH, Frydoonfar H, Heidary R, Jameei R, Zare
S. The Effect of Light, Temperature, pH and Species
on Stability of Anthocyanin Pigments in
Four Berberis Species. Pakistan Journal of Nutrition, 2006; 5(1): 90-92.
16. Mekhael R, Yosif SY. The role of red pigment produced by Serratia marcescens as antibacterial and plasmid curing agent. Journal of Duhok, 2009; 12(1): 268-274.
17. Natasha Nageswaran. Isolation, Optimization and
Application of Prodigiosin from Environmental Isolates of Serratia marcescens. 2014. Ph. D thesis. 18. Pandey R, Chander R, Sainis K. Effect of light on
growth, pigment production and culture morphology of Monascus purpureusin solid-state fermentation. World j microbial biotechnol, 2007; 24: 2671–2675.
19. Piringer A, Heintze H. Effect of light on the formation of a pigment in the Tomato fruit cuticle American society of plant biologists, 1954.
20. Phatake YB and Dharmadhikari SM. Isolation and screening of prodigiosin producing bacteria and characterization of produced pigment. Int. J. of science and nature, 2016; 7(1): 202-209.
21. She Z, Bassa IA, Gabriel SL, Francis FJ.
Anthocyanin pigments of sweet potatoes – Ipomoea batatas. J. Food Sci., 199; 57: 755-757.
22. Sole M, Francia A, Rius N, Loren JG. The role of pH in the ‘glucose effect’ on prodigiosin production
by non-proliferating cells of Serratia
marcescens. Letters in applied microbiology, 1997; 25: 81-84.
23. Song MJ, Bae J, Lee DS, Kim CH, Kim JS, Kim SW, Hong SI. Purification and Characterization of Prodigiosin Produced by Integrated Bioreactor from Serratia sp. KH-95. J. Biosci. Bioeng, 2006; 101: 157-161.
24. Soumya K, Swathi L, Sreelatha G, Sharmila T. Light
influences pigment, biomass and morphology in Chaetomiumcupreum -ss02 -a photoresponse study. Int. j. curr. microbiol. app. sci, 2014; 3(4): 53-64.
25. Sundaramoorthy N, Yogesh P, Dhandapani R.
Production of Prodigiosin from Serratia
marcescensis isolated from soil. Indian Journal of Science and Technology, 2009; 2(10): 35-37.
26. Williams RP, Quadri SM. The pigment of serratia in
the genus Serratia. Boca Raton FL: CRC press lnc. 1980; 31-75.
27. Venil CK, Lakshmanaperumalsamy P. An insightful