ISSN Online: 2156-8278 ISSN Print: 2156-8251
DOI: 10.4236/ajac.2019.105013 May 10, 2019 143 American Journal of Analytical Chemistry
Global Optimization of Norris Derivative
Filtering with Application for Near-Infrared
Analysis of Serum Urea Nitrogen
Yihui Yang, Tao Pan, Jing Zhang
*Department of Optoelectronic Engineering, Jinan University, Guangzhou, China
Abstract
Near-infrared (NIR) spectroscopy combined with chemometrics methods was applied to the rapid and reagent-free analysis of serum urea nitrogen (SUN). The mul-partitions modeling was performed to achieve parameter stability. A large-scale parameter cyclic and global optimization platform for Norris derivative filter (NDF) of three parameters (the derivative order: d, the number of smoothing points: s and the number of differential gaps: g) was developed with PLS regression. Meantime, the parameters’ adaptive analysis of NDF algorithm was also given, and achieved a significantly better model-ing effect than one without spectral pre-processmodel-ing. After eliminatmodel-ing the in-terference wavebands of saturated absorption, the modeling performance was further improved. In validation, the root mean square error (SEP), correla-tion coefficient (RP) for prediction and the ratio of performance to deviation (RPD) were 1.66 mmol∙L−1, 0.966 and 4.7, respectively. The results showed that the high-precision analysis of SUN was feasibility based on NIR spec-troscopy and Norris-PLS. The global optimization method of NDF is also ex-pected to be applied to other analysis objects.
Keywords
Near-Infrared Spectral Analysis, Serum Urea Nitrogen, Norris Derivative Filter, Norris-Partial Least Squares, Global Optimization
1. Introduction
As we know, near-infrared (NIR) spectroscopy primarily reflects the absorption of overtones and combinations of vibrations of X-H functional groups (such as C–H, O–H and N–H), has obvious advantages in rapid and reagent-free analys-How to cite this paper: Yang, Y.H., Pan,
T. and Zhang, J. (2019) Global Optimiza-tion of Norris Derivative Filtering with Application for Near-Infrared Analysis of Serum Urea Nitrogen. American Journal of Analytical Chemistry, 10, 143-152. https://doi.org/10.4236/ajac.2019.105013
Received: April 15, 2019 Accepted: May 7, 2019 Published: May 10, 2019
Copyright © 2019 by author(s) and Scientific Research Publishing Inc. This work is licensed under the Creative Commons Attribution International License (CC BY 4.0).
DOI: 10.4236/ajac.2019.105013 144 American Journal of Analytical Chemistry es, and has been effectively used in agriculture [1] [2] [3] [4], food [5] [6] [7] [8], environment [9] [10], biomedicine and other fields [11]-[16]. NIR spectroscopy of most sample types can usually be measured directly without physically or chemically treating. It is possible to directly measure complex liquid samples containing multiple components (e.g. blood, milk, etc.) by transmission. How-ever, its spectrum contains both instrumental noise and interference caused by other unknown components. Thus spectral pretreatment of high signal-to-noise ratio is significantly necessary to solve this problem.
In spectral preprocessing, appropriate smoothing and derivative can effec-tively eliminate noises. The famous Norris derivative filter (NDF) includes two steps: the moving average smoothing and differential derivation. It uses three parameters: the derivative order (d), the number of smoothing points (s) and the number of differential gaps (g). NDF is an algorithm group with various para-meters and modes, which is often used in the NIR analysis [17] [18]. The appro-priate Norris modes should be chosen according to the analytical objects. It is necessary to make large-scale optimization selections for Norris modes. Due to the heavy workload, such work has not been reported yet.
Serum urea nitrogen (SUN) is an important indicator for clinical evaluation of renal function and protein metabolism. It plays an important role in the diagno-sis of renal diseases in acute myocardial infarction [19] and acute heart failure [20]. And it is also an adjunct predictor of acute pancreatitis [21], hypertension and depression. The normal value of SUN is 2.9 to 7.5 mmol∙L−1. The conven-tional analytical methods for SUN include gas chromatography, ion conductivity and urease methods. These methods require chemical reagents and complex op-erations, which are inconvenient for rapid and daily screening of large popula-tion. Therefore, the development of simple and rapid analytical method for SUN in the routine testing is of great significance.
In fact, the serum urea nitrogen (CO(NH2)2) contains the hydrogen-containing group (-NH2), which has characteristic absorption in the NIR region. There-fore, in molecular level, the NIR spectrum has the possibility to quantita-tively analyze urea nitrogen. There have been some researches and develop-ments in this area, such as using NIR spectroscopy to analyze the urea nitro-gen content in serum simulated solution or urine [15] [16]. Recently, silver mirror enhanced NIR diffuse reflectance spectroscopy has been proposed for the analysis of SUN [22]. However, the existing analytical accuracy did not meet the requirements of clinical application, further innovation in methods is very necessary. And it is also crucial to conduct chemometric studies for model optimization.
DOI:10.4236/ajac.2019.105013 145 American Journal of Analytical Chemistry
2. Methods and Materials
2.1. Experimental Materials, Instruments
and Measurement Methods
A total of 210 serum samples were collected from a hospital, the clinical actual values of serum urea nitrogen of the samples were obtained. The SUN values ranged from 2.1 to 41.6 (mmol∙L−1), and the mean and standard deviation (SD) were 8.0 and 7.0 (mmol∙L−1), respectively. Since the serum samples were col-lected and used in this study, the informed consent of all individual participants was obtained. The experiment was carried out according to relevant laws and in-stitutional guidelines and approved by local medical institutions, which obtained the informed consent of all participants.
The instrument was an XDS Rapid Content™ Liquid Grating Spectrometer (FOSS, Denmark) equipped with a 2 mm. The spectra spanned 780 to 2498 nm with a 2 nm wavelength gap, including the overall NIR region. The detectors on wavebands of 780 - 1100 and 1100 - 2498 nm were Si and PbS detectors, respec-tively. Every sample was measured thrice. And the average spectrum of each sample was calculated and used for modeling. The spectra were measured at 25˚C ± 1˚C and 46% ± 1% relative humidity.
2.2. Mul-Partition Modeling
The 75 samples were randomly selected from 210 samples as independent vali-dation set (not involved in modeling). The remaining 135 samples were used as the modeling set, which was further divided into calibration (80 samples) and prediction (55 samples) sets for 10 times to achieve the parameter stability. The root-mean-square errors (SEP) and correlation coefficients (RP) for prediction were determined for each partition. The mean values (SEPAve, RP,Ave) and standard deviations (SEPSD, RP,SD) for all the partitions were further determined, respec-tively. The comprehensive indicator SEP+ = SEP
Ave + SEPSD was used to select the parameters with stability. The SEP+ takes the modeling prediction accuracy (SE-PAve) and stability (SEPSD) both into account. The selected models were validated using the validation set. The corresponding SEP, RP, and ratio of performance to deviation (RPD) were further determined, respectively. RPD CSD
SEP
= , where CSD
was SD of actual values for the 75 samples (Mean: 8.6 mmol∙L−1; SD: 7.8 mmol∙L−1).
2.3. Norris Derivative Filter Algorithm
The NDF algorithm uses the symmetrical window of wavelengths to perform moving average smoothing on spectra firstly. The number of wavelengths in the smoothing-window is called the number of smoothing points (s, odd), which is set to s=1,3, , S; S can take the maximum odd number of the total number
DOI: 10.4236/ajac.2019.105013 146 American Journal of Analytical Chemistry cannot be performed for that the original spectra were not pretreated.
The absorbance of the kth wavelength was x
k. And the absorbance of the
smoothing-window center xk were xi, i k s21,k s21
− −
∈ − +
. The smoothing
value of xk was as follows:
1 2 1 2 s k i s i k k x x s − + − = − =
∑
(1)It’s worth noting that for the leftmost 1
2
s−
and rightmost wavelengths, the symmetrically smoothing cannot be performed. Based on an idea of data conti-nuity, for the leftmost 1
2
s−
wavelengths, the smoothing values of the absor-bance xk were as follows:
1 2
1 , 1,2, , 1
1 2 2 s k i i k x s
x s k
k − + = − = = − +
∑
(2)
For the rightmost 1
2
s−
wavelengths, the smoothing method was similar and omitted.
Difference derivation: The spectra pretreated by moving average smoothing were then used for derivation. The 1st derivative of absorbance was calculated using the center difference method. Since the NIR spectra are relatively flat and the spectral resolution of different objects is usually different, the original spec-tral data gap is not necessarily suitable for the differential gap of derivative. The Norris derivative uses variable number of wavelength gaps as the number of dif-ferential gaps (g) for the derivative, g 1,2, ,= G. Large g is unreasonable due to the correlation is low. In this study, the upper limit G was set as 50.
For xk, the 1st derivative of absorbance was calculated using the following cen-ter difference:
D
2 k g k g k
x x
x
g
+ − −
=
(3)
Similarly, for the leftmost and the rightmost g wavelengths respectively, the center difference cannot be performed. Based on the idea of data continuity, for the g leftmost wavelengths, the 1st derivative value of the absorbance was calcu-lated by the forward difference method as follows:
D k g k , 1,2, , k
x x
x k g
g + −
= = (4)
For the rightmost g wavelengths, the calculation method for 1st derivative val-ue of the absorbance was similar and omitted.
DOI:10.4236/ajac.2019.105013 147 American Journal of Analytical Chemistry above 1st derivative value, and the process was not described again.
Optimization: Considering that the absolute value of the derivative of the 3rd or more is small and the spectral information is low, it is generally not recom-mended to use the derivative of the 3rd or more. In this study, the derivative or-der is set as d = 0, 1, 2. In particular, when d = 0, only the previous moving av-erage smoothing was required.
As above, based on parameters combinations (d, s, g), d = 0, 1, 2; s =1,3, ,99 ;
1,2, ,50
g= , a total of 5050 NDF modes were obtained. They were used to
pretreat the sample spectra separately. The corrected spectra were then used to establish PLS models, named Norris-PLS models. Finally, according to the pre-dicted effect, the optimal parameters were preferred as follows:
{ } { } { }
(
)
0,1,2 1,3, ,99 1,2, ,50SEP min SEP , ,
d s g
d s g
+ ∗ ∈ ∈ ∈ = (5)
The s and the g are both important parameters of NDF. When d = 0, there is only one variable parameter s. The corresponding prediction error is SEP+(0, s),
1,3, ,99
s = . When d = 1, 2, there are two variable parameters (s, g). The cor-responding single-parameter local optimal models were as follows:
( )
{1,2, ,50}(
)
SEP , min SEP , , , 1,2; 1,3, ,99
g
d s d s g d s
+ +
∈
= = =
(6)
(
)
{1,3, ,99}(
)
SEP , min SEP , , , 1,2; 1,2, ,50
s
d g d s g d g
+ +
∈
= = =
(7)
3. Results and Discussion
3.1. Direct PLS Model without Pretreatment
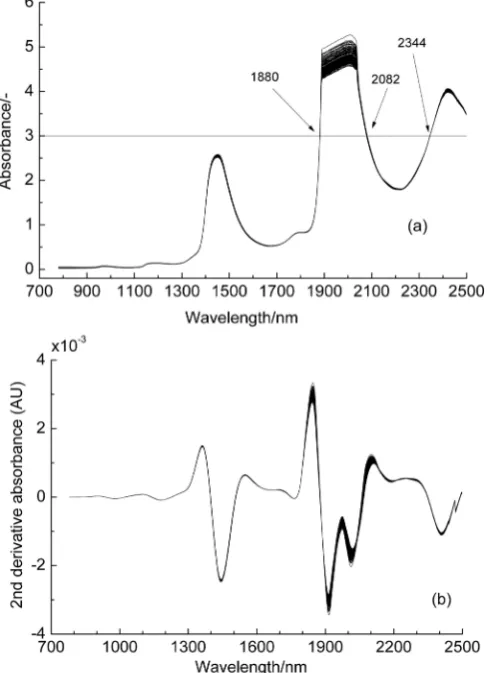
The NIR spectra of the 210 serum samples in the entire scanning region (780 - 2498 nm) are illustrated in “Figure 1(a)”. As comparison, the PLS model in the whole region (780 - 2498 nm) without spectral pretreatment was established. The modeling effect (SEPAve, RP,Ave, SEPSD, RP,SD, and SEP+) are summarized in “Table 1”. The results showed that high prediction error (SEP+ = 7.07 mmol∙L−1) and low correlation (RP = 0.535).
3.2. Norris-PLS Models
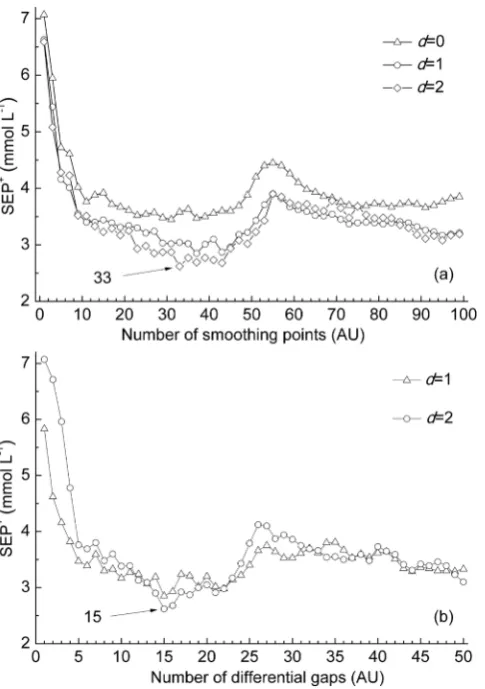
All Norris-PLS models corresponding to 5050 NDF modes also were established. For different derivative order, the optimal SEP+ corresponding to each sin-gle-parameter (number of smoothing points s or number of differential gaps g) are shown in “Figure 2”. It can be observed that the global optimal NDF mode was 2nd derivative, 33 smoothing points and 15 differential gaps (d = 2, s = 33 and g = 15). The corresponding SEP+ and R
DOI: 10.4236/ajac.2019.105013 148 American Journal of Analytical Chemistry
Figure 1. NIR spectra of 210 serum samples (a) raw spectra and (b) NDF spectra (d = 2, s = 33, g = 15).
Table 1. Prediction effects of modelling for the analysis of SUN (mmol∙L−1).
Methods Wavelengths (nm) LV SEPAve SEPSD RP,Ave RP,SD SEP+
PLS 780 - 2498 12 6.14 0.90 0.527 0.133 7.05
Norris-PLS 780 - 2498 11 2.47 0.15 0.930 0.009 2.62
780 - 1880 & 2082 - 2344 11 1.71 0.16 0.966 0.007 1.87
better modeling performance. The prediction effects of the global optimal Nor-ris-PLS model are also summarized in “Table 1”. The spectra used the optimal NDF mode (d = 2, s = 33, g = 15) are shown in “Figure 1(b)”.
In fact, there was significant saturate absorbance around 1900nm and 2400 nm in raw spectra, see in “Figure 1(a)”. They introduce noise and have an im-pact on modeling. Therefore, the absorbance higher than 3 (corresponded 99.9% absorption rate) was further excluded, and the remaining was 780 - 1880 & 2082 - 2344 nm. On the basis of the NDF spectra, the PLS model was established in the unsaturated region (780 - 1880 & 2082 - 2344 nm). The modeling effect is also summarized in Table 1. The SEP+ and was R
[image:6.595.204.538.475.549.2]DOI:10.4236/ajac.2019.105013 149 American Journal of Analytical Chemistry
Figure 2. SEP+ of the local optimal Norris-PLS models for SUN corresponding to each
single-parameter: (a) Numbers of smoothing points and (b) Numbers of differential gaps.
Therefore, eliminating the interference waveband with high-absorption does help to improve the modeling effect.
3.3. Models Validation
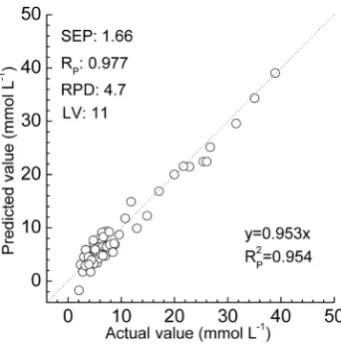
The 75 validation samples not incorporated in modeling were used to evaluate the Norris-PLS model that were established in the unsaturated region (780 - 1880 & 2082 - 2344 nm) with the optimal NDF mode. The PLS regression coeffi-cients were determined using the spectra and actual SUN values of all modeling samples. The predicted values were then determined using the resulting regres-sion coefficients and the spectra of the validation samples.
DOI: 10.4236/ajac.2019.105013 150 American Journal of Analytical Chemistry
Figure 3. Relationship between the predicted and actual SUN values based on the optimal models.
4. Conclusions
NDF algorithm is a well-performed spectral preprocessing method. The appro-priate Norris modes should be chosen according to the analytical objects. It is necessary to make global optimization selection for Norris modes to achieve op-timal modeling performance.
Serum urea nitrogen is an important blood clinical screening index and has clinical reference value for the diagnosis and treatment of many major diseases. The use of NIR spectroscopy to establish a rapid and reagent-free detection me-thod for serum urea nitrogen can provide new technical support for related health screening of large populations. Using the optimal Norris-PLS model for SUN, the modelling prediction error (SEP+) further decreased to 2.62 mmol∙L−1 (decline rate 63%). Then, the saturated wavebands with high absorption were removed, and the SEP+ then decreased to 1.87 mmol∙L−1 (decline rate 29%). Therefore, the good performance of the global optimization of NFD algorithm was indicated.
This study developed a large-scale parameter cyclic and global optimization platform for NDF algorithm and successfully used to SUN analysis. Meantime, the well-posed study of parameters in Norris-PLS method was given. We be-lieved that the above promotion has such significance and can provide valuable reference for the NIR analysis of complex objects.
Acknowledgements
This work was supported by the Science and Technology Project of Guangdong Province of China (No. 2014A020213016, No. 2014A020212445) and the Uni-versity-Enterprise Joint Research Project “Intelligent detection network tech-nology joint research centre” (No. 40115031).
Conflicts of Interest
DOI:10.4236/ajac.2019.105013 151 American Journal of Analytical Chemistry paper.
References
[1] Pan, T., Li, M.M. and Chen, J.M. (2014) Selection Method of Quasi-Continuous Wavelength Combination with Applications to the Near-Infrared Spectroscopic Analysis of Soil Organic Matter. Applied Spectroscopy, 68, 263-271.
https://doi.org/10.1366/13-07088
[2] Chen, J.Y., Zhang, H. and Matsunaga, R. (2006) Rapid Determination of the Main Organic Acid Composition of Raw Japanese Apricot Fruit Juices Using Near-Infrared Spectroscopy. Journal of Agricultural and Food Chemistry, 54, 9652-9657.
https://doi.org/10.1021/jf061461s
[3] Liu, Z.Y., Liu, B., Pan, T. and Yang, J.D. (2013) Determination of Amino Acid Ni-trogen in Tuber Mustard Using Near-Infrared Spectroscopy with Waveband Selec-tion Stability. Spectrochimica Acta Part A: Molecular and Biomolecular Spectros-copy, 102, 269-274. https://doi.org/10.1016/j.saa.2012.10.006
[4] Guo, H.S., Chen, J.M., Pan, T., Wang, J.H. and Cao, G. (2014) Vis-NIR Wavelength Selection for Non-Destructive Discriminant Analysis of Breed Screening of Trans-genic Sugarcane. Analytical Methods,6, 8810-8816.
https://doi.org/10.1039/C4AY01833H
[5] Lyu, N., Chen, J.M., Pan, T., Yao, L.J., Han, Y. and Yu, J. (2016) Near-Infrared Spectroscopy Combined with Equidistant Combination Partial Least Squares Applied to Multi-Index Analysis of Corn. Infrared Physics & Technology, 76, 648-654. https://doi.org/10.1016/j.infrared.2016.01.022
[6] Sousa, C., Lucio, M.M.L., Neto, M.O.F.B., Marcone, G.P.S., Pereira, A.F.C., Dantas, E.O., Fragoso, W.D. and Araujo, M.C.U. (2007) A Method for Determination of COD in a Domestic Wastewater Treatment Plant by Using Near-Infrared Reflectance Spectrometry of Seston. Analytica Chimica Acta, 588, 231-236.
https://doi.org/10.1016/j.aca.2007.02.022
[7] Pan, T., Chen, Z.H., Chen, J.M. and Liu, Z.Y. (2012) Near-Infrared Spectroscopy with Waveband Selection Stability for the Determination of COD in Sugar Refinery Wastewater. Analytical Methods, 4, 1046-1052.https://doi.org/10.1039/c2ay05856a [8] Jiang, J.H., Berry, R.J., Siesler, H.W. and Ozaki, Y. (2002) Wavelength Interval
Selection in Multicomponent Spectral Analysis by Moving Window Partial Least-Squares Regression with Applications to Mid-Infrared and Near-Infrared Spectroscopic Data. Analytical Chemistry, 74, 3555-3565.
https://doi.org/10.1021/ac011177u
[9] Du, Y.P., Liang, Y.Z., Jiang, J.H., Berry, R.J. and Ozaki, Y. (2004) Spectral Regions Selection to Improve Prediction Ability of PLS Models by Changeable Size Moving Window Partial Least Squares and Searching Combination Moving Window Partial Least Squares. Analytica Chimica Acta, 501, 183-191.
https://doi.org/10.1016/j.aca.2003.09.041
[10] Pan, T., Xie, J., Chen, J.M. and Chen, H.Z., et al. (2010) Joint Optimization of Savitzky-Golay Smoothing Modes and PLS Factors Was Applied to Near Infrared Spectral Analysis of Serum Cholesterol. 2010 4th International Conference on Bio-informatics and Biomedical Engineering, Chengdu, China, 18-20 June 2010, 1-4. https://doi.org/10.1109/ICBBE.2010.5514789
DOI: 10.4236/ajac.2019.105013 152 American Journal of Analytical Chemistry https://doi.org/10.1039/c3ay40732b
[12] Han, Y., Chen, J.M., Pan, T. and Liu, G.S. (2015) Determination of Glycated Hemoglobin Using Near-Infrared Spectroscopy Combined with Equidistant Combination Partial Least Squares. Chemometrics and Intelligent Laboratory Sys-tems, 145, 84-92. https://doi.org/10.1016/j.chemolab.2015.04.015
[13] Yao, L.J., Lv, N., Chen, J.M., Pan, T. and Yu, J. (2016) Joint Analyses Model for Total Cholesterol and Triglyceride in Human Serum with Near-Infrared Spectroscopy. Spectrochimica Acta Part A: Molecular and Biomolecular Spectroscopy, 159, 53-59. https://doi.org/10.1016/j.saa.2016.01.022
[14] Yao, L.J., Xu, W.Q., Pan, T. and Chen, J.M. (2017) Moving-Window Bis-Correlation Coefficients Method for Visible and Near-Infrared Spectral Discriminant Analysis with Applications. Journal of Innovative Optical Health Sciences, 11, 195-203. https://doi.org/10.1142/S1793545818500050
[15] Kang, N., Kasemsumran, S., Woo, Y., Kim, H. and Ozaki, Y. (2006) Optimization of Informative Spectral Regions for the Quantification of Cholesterol, Glucose and Urea in Control Serum Solutions Using Searching Combination Moving Window Partial Least Squares Regression Method with Near Infrared Spectroscopy. Che-mometrics and Intelligent Laboratory Systems, 82, 90-96.
https://doi.org/10.1016/j.chemolab.2005.08.015
[16] Suzuki, I., Ogawa, M., Seion, K., Nogawa, M., Naito, H., Yamakoshi, K. and Tanaka, S. (2018) Reagentless Estimation of Urea and Creatinine Concentrations Using Near-Infrared Spectroscopy for Spot Urine Test of Urea-to-Creatinine Ratio. Ad-vanced Biomedical Engineering, 7, 72-81.
[17] Yang, F., Xie, C.W., Liu, D.S., Yu, P.Q. and Li, Z.Y. (2010) Analysis and Estimate of Corn CNCPS Component by Near Ifrared Reflectance (NIR) Spectroscoy. Spec-troscopy and Spectral Analysis, 30, 348-352.
[18] Zhu, Z.H., Wang, Q.H., Wang, S.C., Dai, M.Y. and Mai, M.H. (2012) The Detection of Hatching Eggs Prior to Incubation by the Near InfraredSpectrum. Spectroscopy and Spectral Analysis, 32, 962-965.
[19] D.Z. and Ge, M. (2018) The Spatial Distribution of BUN Reference Values of Chi-nese Healthy Adults: A Cross-Section Study. International Journal of Biometeorol-ogy, 62, 2099-2107. https://doi.org/10.1007/s00484-018-1585-4
[20] Llauger, L., Jacob, J. and Miró, Ò. (2018) Renal Function and Acute Heart Failure Outcome. Medicina Clinica,151, 281-290.
https://doi.org/10.1016/j.medcle.2018.08.005
[21] Cozzolino, D. and Moron, A. (2006) Potential of Near-Infrared Reflectance Spec-troscopy and Chemometrics to Predict Soil Organic Carbon Fractions. Soil & Til-lage Research, 85, 78-85.https://doi.org/10.1016/j.still.2004.12.006