Author for correspondence:
Volume-6 Issue-2
International Journal of Intellectual Advancements
and Research in Engineering Computations
Using smart city data in 5G network
C.Hariram
Assistant Professor of Computer Science Department, Saveetha University, Chennai
ABSTRACT
Smart Cities and self-organizing networking techniques for fifth-generation (5G) cellular systems has been one-sided: a Smart City relies on 5G to support massive machine -to-machine (M2M) communications, but the actual net-work is unaware of the information flowing through it. However, a greater synergy between the two would make the relation-ship mutual, since the insights provided by the massive amount of data gathered by sensors can be exploited to improve the communication performance. In this paper, we concentrate on self -organization techniques to improve handover efficiency using vehicular traffic d ata gathered in London. Our algorithms exploit mobility patterns between cell coverage areas and road traffic congestion levels to optimize the handover bias in heterogeneous networks and dynamically manage mobility management entity (MME) loads to reduce handover completion times.
INTRODUCTION
THE FIFTH generation (5G) of mobile networks is forecasted to rely on virtualization and self-organization techniques to deal with the extreme complexity and het-erogeneity of the network and with the massive number of connected devices [2]. The rise of Internet-capable sensors and monitoring devices is one of the major drivers of such com-plexity, due to the volume of information they generate [3]; however, this information can also be a valuable resource in the network decision-making process.
According to the Smart City paradigm, these data can be leveraged to provide innovative services to citizens and to help administrators define smarter policies. However, since they must be transmitted and aggregated by the network in order to be processed [4], there is no reason why the network itself should not benefit from them. For example, traffic data can be used to predict mobility patterns and future cell load with higher accuracy, enabling anticipatory techniques [5]. Cellular network operators would be incentivized to sup-port the deployment of Smart Cities given the possibility of increased
efficiency and lower operating costs, improving both the carrier network and the sensors’ pervasiveness.
Building upon the “Symbio City” concept proposed in [6], in this paper we exploit the traffic data from the transport for London (TfL) urban traffic control (UTC) net-work [7] in order to dynamically optimize network parameters, such as: 1) the handover range expansion bias for Heterogeneous Networks (HetNets) and 2) the number of virtualized Mobility Management Entities (MMEs) deployed city-wide. Since handovers will be one of the major issues in 5G ultra dense networks, the techniques we propose will reduce the handover completion time and the well-known Ping-Pong effect [8], [9] without losing the benefits of microcell offloading. The ability to choose the point in the tradeoff between handover frequency and offloading capability is going to be a key element in the design of self-organizing 5G networks.
The rest of this paper is organized as follows. Section II presents an overview of state of the art techniques in traffic data analysis, self-organizing networks (SONs), and handover management, while Section III describes the London traffic sensor
Copyrights © International Journal of Intellectual Advancements and Research in Engineering Computations, network, the available data and our analysis of the
vehicular mobility patterns. We provide the details on the two previously mentioned optimization techniques in Section IV, along with an example application of both, using the London traffic data. Finally, in Section V we make our final remarks and suggest some possibilities for future research.
RELATED WORK
The emerging Smart City paradigm is getting significant attention from researchers, companies, and city officials all over the world. A Smart City enables a wide array of services, from environmental monitoring to traffic control and smart parking [10]. These services build upon data generated by a plethora of sensors, and collected by means of possibly different technologies that collectively concur to the shaping of the so-called Internet of Things (IoT) [11]. The data these services need are gathered by millions of distributed sensors [12] and aggregated through a modular event-driven architecture [13]. These devices communicate using either dedicated low power networks (e.g., LoraWAN, SigFox, and IEEE 802.15.4) [14] or standard cellular networks. Both these solutions have their advantages and drawbacks; using and it is possible to adapt the bias based on the user mobility to reduce the handover delay problem caused by the TTT. Kitagawa et al.
[34] presented a heuristic that reacts to late or early handovers and adapts the bias for each pair of neigh-boring cells. Another work jointly adapts the TTT and bias in a reactive manner [35]. It is even possible to skip handovers entirely, avoiding connections to very small cells while moving at high speed [36].
Virtual MME
One of the main architectural trends in the evolution toward 5G is network function virtualization (NFV): instead of using specialized and costly hardware in both the core and the access network, most of the processing is virtualized and run on general-purpose machines in the cloud [2].
This allows a larger flexibility and adaptability to the instantaneous load of the control and user planes. The initialization cost of a new virtual machine is orders of magnitude smaller than the cost of the equivalent worst-case dimensioned hardware. A broad overview of the issues and other potential benefits of NFV is presented in [37]. Although this research is still ongoing, preliminary results [38] show that it is possible to increase the energy efficiency of the network without significant performance losses.
In the second part of this paper, we focus on handover management in virtualized MMEs (vMMEs). A first model of the performance of the different virtualized core network (CN) functions is presented in [39], and the MME is identified as a critical element for scalability of control plane functionalities. Virtualization can also enable distributed MME designs [40].
An optimized design of a virtualized MME is given in [41], where the number of vMME instances is adapted to the traffic load in an M2M scenario, using a traffic model for CN-related events.
DATA GATHERING AND ANALYSIS
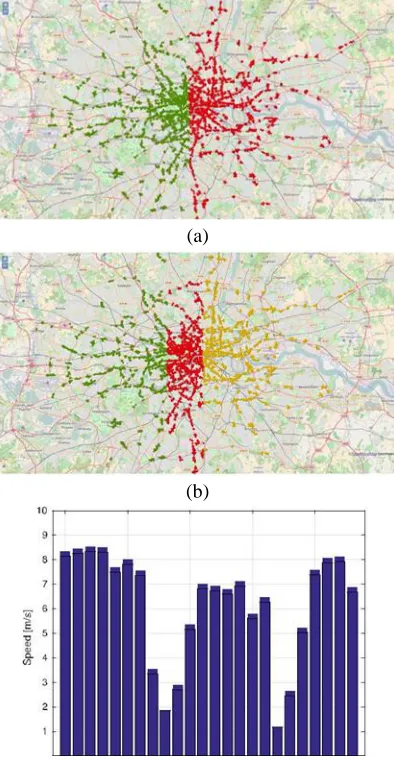
The TfL UTC network is composed of more than 10 000 road sensors placed at all critical crossings around the city. The Split Cycle Offset Optimization Technique (SCOOT) optimizer uses the traffic flow data from the sensors to adapt the traffic light times to the traffic situation in real time. TfL released the raw sensor data of the first three months of 2015 for the North and Central regions of London, and we use those data in our optimization.
Copyrights © International Journal of Intellectual Advancements and Research in Engineering Computations, (a)
(b)
Fig. 2. Hourly average speed for January 23, 2015 at the intersection between Homerton High St. and Daubeney Rd.
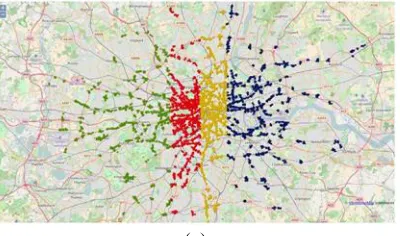
Copyrights © International Journal of Intellectual Advancements and Research in Engineering Computations, (c)
Fig. 4. Partition for a different number N of vMMEs. The colors indicate the areas controlled by each vMME. (a) N = 2. (b) N = 3. (c) N = 4.
In this paper, we extract two kinds of information from the TfL dataset: 1) the average vehicular speed at any single crossing in London and 2) the number of handovers between Macro eNBs over the whole city. These values are not directly provided by TfL. However, they can be roughly estimated using the binary signals generated by the detectors. Indeed, when a vehicle of length L moving at speed passes over a sensor, the detector will generate a run of about n = (L/vTs) ones, followed by a few zeros corresponding to the inter vehicle spacing. It is then possible to estimate the speed by counting n and assuming a reference vehicle length of L = 4 m
= L --- (1) nTs
Fig. 2 shows the evolution of the average speed measured by a single sensor over a whole day (namely, January 23, 2015): as expected, the speed of the vehicles is higher at night because of the lighter traffic, while during rush hour (from 8 A.M. to 9 A.M. and from 5 P.M. to 6 P.M.) the average speed drastically decreases. The spatial distribution of traffic is shown in Fig. 3.
For the second part of our data analysis, we assume that the Macro eNBs are placed using a standard regular hexagonal tiling, with sides of 100 m. We associate the detection of a car by a sensor in a cell with a handover, and, given a time interval Tper equal
to 1 h, we estimate the number of handovers Hm as the total number of detections from the different sensors in cell m during Tper. (c) Fig. 4. Partition for a different number N of vMMEs. The colors indicate the areas controlled by each vMME. (a) N = 2. (b) N = 3. (c) N = 4.
Copyrights © International Journal of Intellectual Advancements and Research in Engineering Computations,
Parameters Used in the Simulation
Table I
Fig. 5. UE trajectory in the considered scenario
of this is shown in Fig. 4, which reports the partitions for ∈ {2, 3, 4}. We define Ii as the total number of handovers for vMME i, and Si,j as the number of handovers from vMME i to vMME j. Iiis given by
Ii=Hm (2)
m∈Ai
where Ai is the set of cells controlled by vMME i. Si,j can be approximated with this formula:
Si,j =
Hm
em,n (3) 6
m∈Ai n∈Aj
Where the variable em,n ∈ {0, 1} indicates the number of sides that cells m and n have in common.
SMART CITY APPLICATIONS
The information processed as described in Section III can be used to perform data-driven optimization of several param-eters in a cellular network. In this paper, we use vehicular speed to dimension the handover range expansion bias in a HetNet and the number of handovers over time to find the number of vMME instances that minimize the handover completion time.
Asymmetrical Handover Bias Optimization in
HetNets
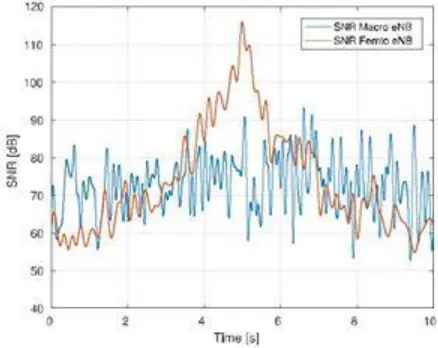
Copyrights © International Journal of Intellectual Advancements and Research in Engineering Computations, Fig. 6. γM(t) and γF(t) with a UE speed of 10 m/s. Multipath fading is not considered in this figure for visual
clarity.
MeNB with transmission power PMTX and an FeNB with trans-mission power PFTX placed at a distance
dMF from each other. The two tiers transmit at different carrier frequencies (off-band HetNets) to avoid cross-tier interference [42]: f0M for the MeNB and f0F for the FeNB. Both tiers use the same band-with B. All the parameters of the simulations are summarized in Table I and are taken from [43]. We consider a channel model with Friis path loss and log-normal shadowing. Let PHRX be the received power at the UE side from the HeNB, with
H ∈ {M, F}, and PHTX the transmission power of the
HeNB. Then
PRXH(t) = PTXH(t) SHα(t)h(f0, β, d) (4)
Where SH is the shadowing gain, which is distributed as N (0, σ ) when measured in dB, and α(t) is the multipath fad-ing gain. The channel gain h(f0, β, d) accounts for the path loss attenuation with exponent β, and is given by
h(f0, β, d) = A
c 2 d −β
(5) 4πf0 d0
Where c is the speed of light, d0 is the reference distance of the far field model [44], and A is a constant. Finally, γH (t) denotes the signal to noise ratio (SNR) at time t for the HeNB and is given by
PH
γH (t) = RX H ∈{M, F} (6)
N0B
Where N0 = −143.82 dBW/MHz is the noise power spectral density.
For the sake of simplicity, we assume that one UE is attached in the MeNB, moving as in Fig. 5 with constant speed . The UE speed at any time is derived from the TfL data as explained in Section III; the average speed over the whole day is shown in Fig. 2. We consider the UE to move at the average speed of the traffic around it.
The SNR at the UE while moving depends on its distance from the MeNBs and FeNBs. As we can see in Fig. 6, the SNR from the FeNB is higher than that from the MeNB when the UE is close to the FeNB. The coverage area of the FeNB is defined as the area in which its SNR is higher than that of any other cell. In this scenario, the UE has to start a handover procedure toward the FeNB when the condition
PRXF(t) + γth > PRXM(t) (7)
Copyrights © International Journal of Intellectual Advancements and Research in Engineering Computations, log2(1 + γ ) when the UE speed is too high. This is
because a fast-moving UE exploits the advantages of the FeNB for just a short time, while it remains in the FeNB for TTT seconds after the condition (7) is reversed. To make sure that the UE starts the handover toward the FeNB as soon as (7) is verified, an asymmetrical handover bias can be applied to PRXF. When the handover is toward the FeNB, the bias needs to be positive to anticipate the beginning of the procedure, while when the handover is from the FeNB to the MeNB, the bias must be negative. We define the SNR difference in position x along the trajectory as
(x) = γ¯F (x) − γ¯M (x) (8)
Where γ¯F (x) and γ¯M (x) are the average SNRs from the two eNBs when the UE is in position x. Moreover, the trajectory of the UE draws a chord within the coverage area of the FeNB, with linear coordinates −r and r with respect to the central point of the chord, as shown in Fig. 5. The optimal value of the bias is then given by
B1 = (−r − TTT) (9) B2 = − (r − TTT). (10)
If the FeNB uses the optimal bias, the handover will be performed exactly at the edge of its coverage area. By applying B1 and B2 to PRXF, (7) becomes
PRXF (t) + B1 > PRXM(t) (11)
While the condition to leave the FeNB is
M F
PRX(t)+ B2> PRX(t). (12)
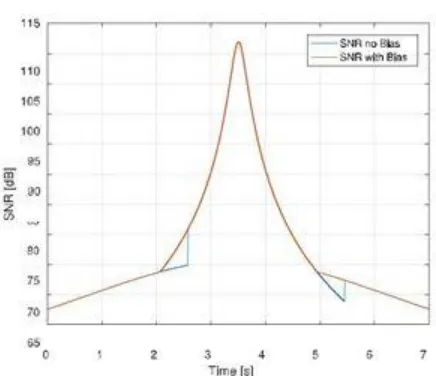
The difference between γ¯ (x) with or without bias can be viewed in Fig. 7. Since the theoretical spectral efficiency ν depends logarithmically on γ¯ (x), using this asymmetrical handover bias will increase ν, fully exploiting the FeNB. However, the bias from (9) and (10) does not take shad- owing and fading into account: while this is optimal in an ideal situation, real channels often experience deep fading, and a bias value tailored to the path loss difference between the two base stations does not protect the UE from them. In order to avoid resetting the timer every time the fading envelope exceeds the path loss-based bias, we can add an
Fig. 7. γM (t) and γF (t) with a UE speed of 16 m/s. Multipath fading and shadowing are not considered in this figure for visual clarity.
additional bias term Bf , which does not depend on the speed
of the UE
Copyrights © International Journal of Intellectual Advancements and Research in Engineering Computations,
ψ
F
α
F
(13)
B1= B1+ Bf
(14)
B2 = B2 + Bf .
(15)
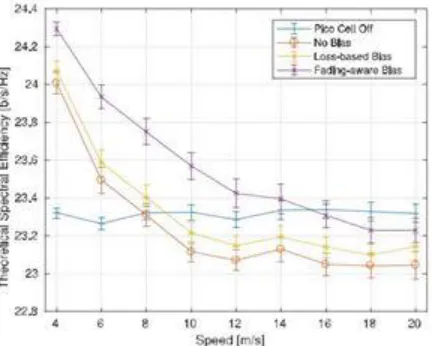
The parameter pthr in (13) represents the amount of protection against deep fading offered by the extra bias term Bf : a higher value of pthr will reset the TTT timer less often, but a higher bias will lead to stronger ping-pong effects. For this reason, we limit the total handover bias B , I ∈ { 1, 2} to a maximum I of 7 dB. The value of Bf is shown in Table II for different pthr, Which correspond to different percentiles. In the performance evaluation we used pthr = 0.68, which is equivalent to one standard deviation in the normal approximation. The improvement obtained by setting an asymmetric handover bias can be seen in Fig. 8. This figure is obtained calculating the average ν over 100 Monte Carlo simulations with independent
shadowing and fading for a UE speed from 4 m/s to 20 m/s.
In the simplest case, in which there is no FeNB and the UE is always attached to the MeNB, νMeNB is essentially independent of the UE speed. The second case is a legacy handover with no bias: as the plot shows, νnoBias decreases drastically as speed increases, as the delay in the handover caused by the TTT wastes most of the performance improvement from the FeNB. If the UE speed is higher than 6 m/s, the handover is so late that the UE would do better to disregard the existence of the FeNB completely: as soon as the UE finishes the handover process, it has to start it again since it has already moved outside of the FeNB coverage area. The improvement
Fig. 8. Theoretical spectral efficiency as a function o f the vehicular traffic speed
Table III: Effect of errors in the speed estimate on the system performance. σˆ is the standard deviation of ν across independent channel realizations
Given by the fading-aware bias is clear: the FeNB can be exploited if the speed is lower than 16 m/s, and there is a clear performance gain compared to the legacy scheme. The path loss-based bias shows a smaller performance improve-ment with respect to the legacy scheme, and handing over to the FeNB
Copyrights © International Journal of Intellectual Advancements and Research in Engineering Computations, FeNB is always fully exploited. Note that the effect
of the 7 dB cap is only relevant at a speed of 20 m/s.
The presence of the FeNB is detrimental to vehicular UEs in the legacy scenario (no handover bias) if the speed of traffic exceeds 6 m/s, since νnoBias ≤ νMeNB. However, setting the optimal asymmetrical handover bias allows network operators to keep the FeNB switched on until the speed reaches 16 m/s, benefiting both pedestrian and vehicular UEs, since νBias ≥ νMeNB.
We also performed a sensitivity analysis by adding a nor-mally distributed error with standard deviation σ to the velocity estimate used to determine the bias and performing multiple
independent simulations. The metric we consider is the maximum value ν of the difference in the spectral effi-ciency for all the considered velocities. As shown in Table III, the effects of the errors in the speed estimation are negligible when compared to the randomness of the channel (represented by the standard deviation σˆ in the table). This makes the sys-tem robust to small variations of the speed of the flow of traffic, as well as protecting it from imprecisions due to vehicles of different lengths [i.e., the parameter L in (1)].
The optimal asymmetrical handover bias over the course of a day for a specific intersection can be calculated from the TfL
Fig. 9. Optimal handover bias throughout the day for January 23, 2015
Data as explained in Section III; the speed evolution shown in Fig. 2 results in the bias shown in Fig. 9. As expected, the handover bias is higher at nighttime, as the average speed of traffic is far higher than during the day. For this reason we can fix a threshold for the handover bias beyond which FeNB can be shut down in order to save energy, leaving all traffic to the MeNB. If we fix this threshold to 3 dB, then the FeNB will only turn off in the middle of the night, when the load on the MeNB is very light.
Adaptive vMME Allocation
As already mentionded in Section II, NFV allows to dynam-ically allocate the resources needed by a cellular network. In traditional mobile networks a single dedicated MME is typi-cally used to manage millions of end users, such as those in the London metropolitan area [41]. With
the NFV approach, instead, it is possible to change the number of vMME instances on the fly, adapting to the number of handovers that are expected to happen in a certain interval.
Copyrights © International Journal of Intellectual Advancements and Research in Engineering Computations, consider the duration of a handover procedure as
the interval from the instant in which the source eNB (SeNB) trig-gers the handover to the instant
in which SeNB receives the
RELEASE_RESOURCES command. During this period the UE first experiences a degraded channel, and then receives packets with an increased latency, thus the quality of service perceived by the final user decreases. The goal of this application is to minimize the duration of these intervals, while using as few vMME instances as possible.
Where ttx = 5 ms is a factor that models the time spent in mid-dleboxes and tPROP = dN(A,B)/ f is the propagation delay, given by the ratio of the distance between the two devices and the speed of light inside optical fibers2 (i.e., f = 2 · 10
8 m/s).
The dependence on the number of vMMEs N is in the dis-tance dN (A, B) between two network
elements, that changes according to the allocation of eNBs to the vMMEs. Instead, tTe−Seis the latency between two adjacent eNBs and does not depend on the relative position between the eNBs and the MMEs, therefore, as in [47], it is modeled as a constant latency tTe−Se= 2.5 ms. tHRis the duration of the interval from when the UE actually disconnects from the SeNB to when it con-nects to the Target eNB. In [48], tHR is estimated to be in the order of 50 ms.
Finally, τ (Ii) is the time that a vMME takes to pro-cess the received command. In [41] the process of handover requests is modeled as a Markov process. We adopt the same approach and in particular we model the vMME as an M/D/1 queue, assuming a Poisson arrival process with
arrival rate
λ = Ii/Tper and a deterministic service time Ts. Given these assumptions, it is possible to compute the value of τ as the system time of an M/D/1 queue
τ = 1 + ρ (19)
μ 2 · μ · (1 − ρ)
Where μ = 1/Ts and ρ = λT are the service rate and the loading factor of the vMME. The study in [39] uses the value Ts = 110 μs as service time of a vMME, requiring consider-able computational
resources. Since this paper only considers vehicular UEs, and the adaptive nature of our system, overdi-mensioning each vMME would be a waste of resources: a number of slow vMMEs can provide the same performance
N N
JT
per(N)= Ii −Si,j tHOX2(N, Ii)
i=1 j=1
N
j=i N
+ Si,jtHO S1
N, Ii, Ij + C(N)(20)
i=1 j=1
j=i
Where the sums consider all the handovers in a time slot Tper of one hour, and C(N) is a penalty function representing the operational cost of N
vMMEs. We consider it to be a linear function of the number of vMMEs N, i.e., C(N) = kN.
The optimization problem uses the vehicular traffic data pro-cessed as in Section III to compute the value of Ii, Si,j and λ(Ii) = Ii/Tperfor each vMME
i, j ∈{1, . . . , N}and computes
N min J Tper
(N)
(21) opt = N
For each interval Tper during a certain day.
Copyrights © International Journal of Intellectual Advancements and Research in Engineering Computations, Fig. 11. Average service time τ for different N, during January 23, 2015.
Fig. 12. Objective function J(N), for N∈ {1, 2, 3, 4}, during January 23, 2015.
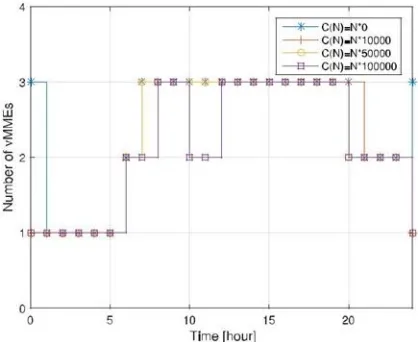
Fig. 13. Noptfor different costs C(N), during January 23, 2015.
vMME instances are not enough to handle the load during the day. Fig. 12, instead, shows the
Copyrights © International Journal of Intellectual Advancements and Research in Engineering Computations, case, one vMME instance is enough only from
midnight to 5 A.M., and more instances (up to 3) must be allocated during the day to meet the vehicular handover traffic load.
CONCLUSION
In this paper, we presented two optimization methods that exploit road traffic data to adapt several parameters in a cel-lular network. Our focus was mostly on handovers, and we showed that a knowledge of the traffic on each road and its speed can help improve the handover performance. A tighter integration between the smart city and the cellular network that serves it might be one of the most promising approaches toward SONs.
In particular, we exploited our knowledge of the speed of the traffic at any intersection to adapt the femtocell range expan-sion bias and mitigate the inefficiency caused by the TTT without incurring in the ping pong effect. Since the calcu-lation is simple, this can be easily implemented in real time. We also use the traffic flow data to adaptively provision virtual resources and add or remove virtual MMEs, reducing operat-ing costs
without impacting the performance with respect to a worst-case dimensioned system. The performance benefits of the scheme can further increase as the integration of smart city data in the network optimization progresses: for example, data about public transport networks, such as buses and the subway system can be exploited to provide a more accurate estimation of the metrics we considered. Moreover, periodic or forecastable events (i.e., holidays and changes in the weather conditions) that impact mobility patterns can be added to the model in order to improve its accuracy.
The two techniques we used in this paper are just two examples of the possible benefits that smart city data can provide to cellular networks: in the future, we plan to sys-tematize this approach and integrate existing and new SON techniques, studying and optimizing their interactions using data from both the cellular network itself and the smart city around it. Another challenge for future systems of this kind is the integration with novel technologies, such as mmWave, which requires intelligent mobility management.
REFERENCES
[1]. M. Dalla Cia et al., “Mobility-aware handover strategies in smart cities,” in Proc. Int. Symp. Wireless Commun. Syst. (ISWCS), 2017, 438–443.
[2]. P. K. Agyapong, M. Iwamura, D. Staehle, W. Kiess, and A. Benjebbour, “Design considerations for a 5G network architecture,” IEEE Commun.Mag., 52(11), 2014, 65–75.
[3]. Mobility Report—On The Pulse of The Networked Society,Ericsson, Stockholm, Sweden, 2016. Available: https://www.ericsson.com/mobility-report
[4]. C. Perera, A. Zaslavsky, P. Christen, and D. Georgakopoulos, “Sensing as a service model for smart cities supported by Internet of Things,” Trans. Emerg. Telecommun. Technol. (ETT), 25(1), 2014, 81–93. [5]. N. Bui et al., “A survey of anticipatory mobile networking: Context-based classification, prediction
methodologies, and optimization tech-niques,” IEEE Commun. Surveys Tuts., 19(3), 2017¸1790–1821, 3rd Quart.
[6]. F. Chiariotti, M. Condoluci, T. Mahmoodi, and A. Zanella, “SymbioCity: Smart cities for smarter networks,”
Trans. Emerg.Telecommun. Technol., 2017, Art. no. e3206. [Online]. Available: http://onlinelibrary.wiley.com/doi/10.1002/ett.3206/full
[7]. P. Hunt, D. Robertson, R. Bretherton, and M. C. Royle, “The SCOOT on-line traffic signal optimisation technique,” Traffic Eng. Control, 23(4), 1982, 190–192.
[8]. P. Muñoz, R. Barco, and I. de la Bandera, “On the potential of handover parameter optimization for self-organizing networks,” IEEE Trans. Veh.Technol., 62(5), 2013, 1895–1905.
[9]. F. Guidolin, I. Pappalardo, A. Zanella, and M. Zorzi, “Context-aware handover policies in HetNets,” IEEE Trans. Wireless Commun., 15(3), 2016, 1895–1906.
Copyrights © International Journal of Intellectual Advancements and Research in Engineering Computations, [11]. A. Zanella, N. Bui, A. Castellani, L. Vangelista, and M. Zorzi, “Internet of Things for smart cities,” IEEE
Internet Things J., 1(1), 2014, 22–32.
[12]. C. H. Liu, J. Fan, J. W. Branch, and K. K. Leung, “Toward QoI and energy-efficiency in Internet-of-Things sensory environments,” IEEETrans. Emerg. Topics Comput., 2(4), 2014, 473–487.
[13]. L. Filipponi et al., “Smart city: An event driven architecture for mon-itoring public spaces with heterogeneous
sensors,” in Proc. IEEE 4thInt. Conf. Sensor Technol. Appl. (SENSORCOMM), Venice, Italy, 2010, 281–286. [14]. M. Centenaro, L. Vangelista, A. Zanella, and M. Zorzi, “Long-range communications in unlicensed bands: The
rising stars in the IoT and smart city scenarios,” IEEE Wireless Commun., 23(5), 2016, 60–67.
[15]. A. Biral, M. Centenaro, A. Zanella, L. Vangelista, and M. Zorzi, “The challenges of M2M massive access in wireless cellular networks,” Digit.Commun. Netw., 1(1), 2015, 1–19.
[16]. M. Polese, M. Centenaro, A. Zanella, and M. Zorzi, “M2M massive access in LTE: RACH performance evaluation in a smart city scenario,” in Proc. IEEE Int. Conf. Commun. (ICC), 2016, 1–6.
[17]. K. Zheng et al., “Big data-driven optimization for mobile networks toward 5G,” IEEE Netw., 30(1), 2016, 44– 51.
[18]. A. Imran, A. Zoha, and A. Abu-Dayya, “Challenges in 5G: How to empower SON with big data for enabling 5G,” IEEE Netw., 28(6), 2014, 27–33.
[19]. F. Bonomi, R. Milito, J. Zhu, and S. Addepalli, “Fog computing and its role in the Internet of Things,” in Proc. ACM 1st MCC WorkshopMobile Cloud Comput., Helsinki, Finland, 2012, 13–16.
[20]. M. Zorzi, A. Zanella, A. Testolin, M. D. F. De Grazia, and M. Zorzi, “Cognition-based networks: A new perspective on network optimiza-tion using learning and distributed intelligence,” IEEE Access, 3, 2015, 1512– 1530.
[21]. P. I. Bratanov and E. Bonek, “Mobility model of vehicle-borne terminals in urban cellular systems,” IEEE Trans. Veh. Technol., 52(4), 2003, 947–952.
[22]. A. S. Hassani, A. R. Momen, and P. Azmi, “Mobility model of vehicular terminals in cellular networks,” in
Proc. 2nd Int. Conf. Inf. Commun.Technol., Damascus, Syria, 2, 2006, 2434–2437.