RESEARCH
Within sub-Saharan Africa, HIV infection has become a common comorbidity among children with severe acute malnutrition (SAM) and some evidence of its effect on survival of children with SAM has begun to emerge.[1-3] Some observational studies conducted in Africa have shown that children with SAM who are HIV-positive are more at risk of dying compared with their HIV-negative counterparts,[4-6] especially if they are marasmic.[3,7] In some cases of SAM, HIV is comorbid with other conditions such as lower respiratory tract infections (LRTIs) and tuberculosis.[8] According to Heikens,[9] these comorbidities have led to an epidemic of secondary SAM, which is more frequently associated with poor outcomes than primary SAM due to food shortage and non-HIV/ TB-related infections.
However, the evidence of the effect of HIV infection and other baseline comorbidities on nutritional recovery among children with SAM who are <5 years of age, remains sparse and inconclusive. The differential effect of the World Health Organization (WHO) clinical stages of HIV on nutrition recovery has not been sufficiently, if at all, explored; inconsistent findings have been reported in a limited number of studies. For example, some studies in resource-poor sub-Saharan countries have shown that although HIV-positive, severely malnourished children can achieve normal nutritional status when treated according to specific treatment guidelines, the recovery is slower when compared with HIV-negative children.[2,5,10] Fergusson and colleagues, on the other hand, have reported similar nutritional recovery (mean 8.9 v. 8.0 g/kg/day) among HIV-positive and HIV-negative severely malnourished children who survived.[11]
Further to this, the relationship between the rate of weight gain (RWG) and duration of refeeding and treatment (DRT), comparing HIV-positive
and -negative SAM patients, remains unclear. Initial observations from two hospitals in which this study was conducted revealed that in some instances children were being discharged without due regard to whether they had gained weight sufficiently during the rehabilitation phase. This was partly because the healthcare workers were not sure as to how long the child needed to be in care to achieve optimal weight gain. An enquiry into this aspect of care was important, particularly because of the insufficient resources available to provide prolonged care in the study setting. There was also some speculation among healthcare workers that HIV-positive children would not gain weight at the same rate as their HIV-negative counterparts, no matter how well and for how long the WHO 10-step guidelines were used to treat them. This anecdote is partly supported by the recent WHO update on the WHO 10-step guidelines for management of SAM[12] which highlighted the existing gap in knowledge regarding nutritional recovery among children with SAM who are HIV-positive and are treated according to the current WHO treatment modality.
This study sought to assess whether there was a relationship between the RWG and the DRT in a sample of children with SAM who survived, and were discharged, following treatment using the WHO 10-step treatment guidelines for management of severe malnutrition. The study also assessed whether this relationship was affected by baseline clinical characteristics, specifically investigating HIV co-infection, HIV disease stage, and SAM syndromic manifestation. Lastly, the study looked at HIV-negative SAM patients as well as HIV-positive SAM patients, at different HIV disease stages, to estimate how long it took for them to achieve a certain number of units of the RWG.
As the nature of this study was operational, assessing these relationships was important not only to promote practices that would ultimately lead Background. Evidence of the effects of HIV infection and clinical stage on the duration of refeeding and treatment (DRT) and the rate of weight gain (RWG) in severely malnourished children remains inconclusive.
Objectives. To determine whether the RWG and DRT differ by baseline clinical characteristics, and to assess the effect of HIV status and disease stage on the relationship between these two clinical outcomes.
Methods. This was a retrospective record review of 346 patiens discharged between 2009 and 2013 following treatment for severe acute malnutrition (SAM) at two rural hospitals in South Africa.
Results. A third of the sample was HIV-positive, the RWG (measured as g/kg/day) was significantly slower in HIV-positive patients compared with HIV-negative cases (mean 5.2, 95% confidence interval (CI) 4.47 - 5.93 v. mean 8.51; CI 7.98 - 9.05; p<0.0001) and cases at stage IV of HIV infection had a significantly slower RWG (mean 3.97; CI 2.33 - 5.61) compared with those at stages I (mean 7.64; CI 6.21 - 9.07) (p<0.0001) and II (mean 5.87; CI 4.74 - 6.99). The mean DRT was longer in HIV-positive cases and those at advanced stages of HIV infection. HIV-positive cases were renourished and treated for almost 3.5 times longer than their HIV-negative counterparts to achieve a moderate RWG (5 - 10 g/kg/day). Conclusion. This study highlights the need to reconsider energy requirements for HIV-positive cases at different clinical stages, for more rapid nutritional recovery in under-resourced settings where prolonged hospitalisation may be a challenge.
S Afr J Child Health 2017;11(2):86-92. DOI:10.7196/SAJCH.2017.v11i2.1194
The impact of HIV infection and disease stage on
the rate of weight gain and duration of refeeding
and treatment in severely malnourished children in
rural South African hospitals
M Muzigaba,
1,2PhD, MPH, MPhil, BSc; B Sartorius,
3PhD, EPIET, MSc, BSc (Hons), BSc;
T Puoane,
2Dr PH, MPH, BCur, BA SocSci; B van Wyk,
2DPhil, MSc, BSc; D Sanders,
2MB ChB, DCH, MRCP, DTPH, DSc
1 School of Clinical Medicine, College of Health Sciences, University of KwaZulu-Natal, Durban, South Africa2 Faculty of Community and Health Sciences, School of Public Health, University of the Western Cape, Bellville, South Africa 3 Discipline of Public Health Medicine, School of Nursing and Public Health, University of KwaZulu-Natal, Durban, South Africa
Corresponding author: M Muzigaba ([email protected])
RESEARCH
to better nutritional recovery at ward level, but also to enable the hospital administrators and the clinical teams to make informed decisions regarding resource allocation based on the patient’s clinical condition at baseline.
Methods
Study design
This study was approved by the University of the Western Cape Research Ethics Committee (ref. no. 12/10/37). The study consisted of a retrospective review of medical treatment records of children admitted with SAM in the study setting who survived and were discharged following treatment.
Setting
This study was conducted in two rural district hospitals in the Eastern Cape Province (EC), South Africa (SA). The hospitals were located in the former Transkei, an apartheid-era homeland and one of the most under-resourced regions in SA.[13] These hospitals were selected based on the fact that they had participated in the initial province-wide intervention to improve the management of SAM in the EC. They were also found to have implemented the WHO 10-step guidelines more effectively than other hospitals in the region.[13] Throughout the study period - January 2009 to May 2013 - monthly SAM admissions in both hospitals constituted an average of 50% of the total paediatric ward admissions. The hospitals also served a catchment area with high HIV prevalence, with a monthly average HIV co-infection rate of 45% among children admitted with SAM.
Participants
Eligibility and selection
The unit of analysis in this study was the patient’s medical treatment record. The treatment records were purposefully selected by one researcher (MM) during regular visits to each hospital, based on a set of eligibility criteria. In total, 346 medical records were reviewed over the study period. The research team reviewed updated medical records at 3-month intervals during hospital visits. Medical records were eligible for review if they belonged to children aged between 6 and 60 months, who were admitted at any of the two hospitals with SAM between January 2009 and May 2013, and were discharged following treatment. Children were discharged if they: (i) completed the transition to catch up and were eating well; (ii) they had no oedema; (iii) had completed antibiotic treatment; (iv) had received electrolytes and micronutrients for at least 2 weeks; (v) their immunisation was up-to-date; and (vi) their road-to-health card had been updated. The exclusion of patients that died was logical, as most of these patients died during the first three days of admission or earlier before the stabilisation phase. Thus, their RWG could not be determined. Other inclusion criteria included having patient treatment records with clearly defined SAM syndromic classifications based on the Wellcome classification system,[14] having records showing HIV test results and HIV clinical stage for HIV-positive patients, and having had a complete treatment record while in the hospital. A comprehensive written medical examination by a doctor, and the discharge criteria followed for patients who did not die while on treatment, were also used as eligibility criteria.
Patient management and follow-up
Treatment records were accumulated over the study period following standardised treatment of patients admitted with SAM. A patient with SAM brought to the hospital was seen by a doctor in the outpatient department, where the admitting doctor provided the diagnosis and the course of treatment to be followed based on the WHO 10-step guidelines. This information was recorded in standardised patient treatment charts as the basis for follow-up treatment and for record-keeping. For patients that were admitted to the ward, their caregivers were requested to provide consent for their children to take part in the study and also so that they would both be screened for HIV infection. Children who
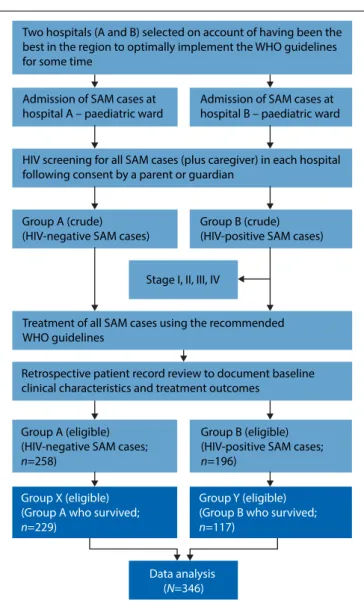
tested HIV-positive were identified and their treatment charts set aside for HIV disease staging by the doctor during follow-up ward rounds. Based on the screening results, two broad groups were formed: group A (HIV-negative patients) and group B (HIV-positive patients). Group B was further divided into four categories based on the clinical stage of HIV infection as defined by the WHO guidelines for staging infants and children.[15] The recruitment process is summarised in Fig. 1.
All SAM patients were treated at the hospital using the recommended WHO 10-steps guidelines for management of SAM.[16] Children with SAM and HIV co-infection were referred to an HIV clinic situated within the hospital premises for initial or follow-up treatment.
Variable definition and measurement
The outcome variables in this study were DRT and RWG. DRT was defined as the total number of days - from admission to discharge - during which a SAM patient was treated for SAM and other comorbidities as per the WHO treatment guidelines. This was computed from the admission and discharge dates in the patient treatment chart. The RWG was defined as the number of grams gained per kilogram of body weight per day (g/kg/day) during the rehabilitation phase. Patients with the RWG ≤0 g/kg/day were considered as those who lost or did not gain weight; whereas those with ≤5 g/kg/day had poor weight gain; 5 - 10 g/kg/day had moderate weight gain; and >10 g/kg/day had good weight gain. The data used to compute this measure were obtained from a standardised patient weight monitoring chart which was included in
Two hospitals (A and B) selected on account of having been the best in the region to optimally implement the WHO guidelines for some time
Admission of SAM cases at hospital A – paediatric ward
HIV screening for all SAM cases (plus caregiver) in each hospital following consent by a parent or guardian
Admission of SAM cases at hospital B – paediatric ward
Group B (crude) (HIV-positive SAM cases) Group A (crude)
(HIV-negative SAM cases)
Stage I, II, III, IV
Treatment of all SAM cases using the recommended WHO guidelines
Retrospective patient record review to document baseline clinical characteristics and treatment outcomes
Group A (eligible) (HIV-negative SAM cases;
n=258)
Group B (eligible) (HIV-positive SAM cases;
n=196)
Group X (eligible) (Group A who survived;
n=229)
Group Y (eligible) (Group B who survived;
n=117)
Data analysis (N=346)
RESEARCH
the patient treatment record. The weight-for-height z-scores were not considered as a measure of nutritional recovery as the height data were not always recorded in the patient treatment record.
Predictor variables and possible confounders included baseline clinical characteristics, such as SAM classification, oedema grade, dermatosis grade, presence of LRTIs, critical illness on admission, presence of other comorbidities, HIV status, and the WHO HIV/AIDS disease stage. Classification of SAM followed the Wellcome system,[14] primarily because there was evidence of inconsistent measurement of patients’ height/ length. HIV testing was done using the HIV polymerase chain reaction (PCR) test, following confidential and private counselling of the caregiver by a professionally trained nurse. HIV clinical staging was done by the admitting doctor as per the WHO guidelines.[15] Oedema and dermatosis were graded on admission as none, mild (+), moderate (++), and severe (+++).[17,18] The LRTIs was an umbrella term used for patients with comorbidities such as pneumonia, bronchitis and other infections below the larynx. Tuberculosis was not a common comorbidity in the treatment records, which may be a result of under-diagnosis or misdiagnosis of the condition in the study setting. Critical illness and other comorbidities were defined based on clinical diagnostic information in the patients’ medical records. Definition of cases as ‘critically ill’ was based on whether or not they were admitted with one or a combination of five clinical features, namely: (i) depressed conscious state (prostration or coma); (ii) bradycardia; (iii) evidence of shock with or without dehydration; (iv) hypoglycaemia and/ or (v) hypothermia, as defined by Maitland et al.[19] Other comorbidities, directly or indirectly related to SAM, were also noted, for example: lethargy, hyponatraemia and hypokalaemia, dehydration, deep acidotic breathing, anaemia and pyrexia, herbal intoxication, presence of diarrhoea, burns and other congenital dysfunctions commonly reported by the doctors in each hospital.
A structured and validated questionnaire developed by the International Malnutrition Taskforce and Muhimbili Hospital in Tanzania[20] was used for the extraction of all the data.
Data analysis
All the data were cleaned and analysed using Stata/IC 13.0 (StataCorp., Texas). Subjects’ baseline clinical characteristics were summarised using frequency tables. The RWG and DRT were firstly inspected for normality using the Shapiro-Wilk and Shapiro-Francia tests, which revealed that they were normally distributed. The distributions of these outcomes across all nine baseline clinical profile variables were displayed using Forest Plots with means and 95% confidence intervals (CIs). Inter-group mean differences were assessed using one-way analysis of variance and independent sample t-tests, as applicable. To assess whether there were significant differences between the two study sites in terms of RWG and DRT, an independent samples t-test was used.
Exploratory bivariate analyses were conducted using a linear regression model to explore the relationships between each outcome variable (RWG and DRT) and the nine baseline clinical characteristics as predictors. These relationships were further explored using multivariate regression analysis. The model estimates were plotted using the coefplot command in Stata 13.0 which displayed different levels of statistical significance for each predictor variable.
To assess the relationship between the RWG and DRT, and whether this was influenced by HIV status or HIV clinical stage, a non-parametric regression analysis using a locally weighted smoothing (LOWESS) technique was used. This technique generated a locally weighted regression of the dependant variable (RWG) on the independent variable (DRT) and two-way locally weighted scatterplot smooths stratified by different levels of HIV status and HIV clinical stages. This non-parametric method was preferred because the relationship between RWG and DRT did not appear to be linear during exploratory analysis. LOWESS was also used because it is known to generate a regression line which follows the data and, as such, provided a more accurate reflection of the relationship between the RWG and DRT.[21]
Results
Descriptive results
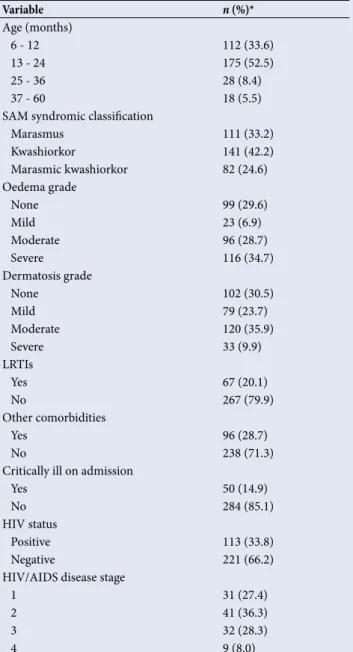
Approximately 88% of the study records for children who were discharged during the study period met the eligibility criteria and were included in this study. Subjects’ baseline clinical characteristics are presented in Table 1, which shows that 33.8% of SAM patients who survived and were discharged were HIV-positive, 15% were admitted in a critical condition, 28% had other comorbidities and 20% had LRTIs. A large proportion (86%) were younger than 25 months and 42% were admitted with kwashiorkor, whereas 33% were admitted with marasmus. It was noteworthy that 28% and 8% of patients were at stages III and IV of HIV infection, respectively.
Inferential results
The comparison of the two hospitals in terms of the distribution of the RWG revealed that there were no statistically significant differences (mean (standard deviation (SD)) 7.788 (3.121) v. 7.186 (3.421) g/kg/day; p=0.236). The means for DRT were also not statistically different (13.15
Table 1. Characterisation of SAM patients by baseline clinical profile (N=346)
Variable n (%)*
Age (months)
6 - 12 112 (33.6)
13 - 24 175 (52.5)
25 - 36 28 (8.4)
37 - 60 18 (5.5)
SAM syndromic classification
Marasmus 111 (33.2)
Kwashiorkor 141 (42.2)
Marasmic kwashiorkor 82 (24.6)
Oedema grade
None 99 (29.6)
Mild 23 (6.9)
Moderate 96 (28.7)
Severe 116 (34.7)
Dermatosis grade
None 102 (30.5)
Mild 79 (23.7)
Moderate 120 (35.9)
Severe 33 (9.9)
LRTIs
Yes 67 (20.1)
No 267 (79.9)
Other comorbidities
Yes 96 (28.7)
No 238 (71.3)
Critically ill on admission
Yes 50 (14.9)
No 284 (85.1)
HIV status
Positive 113 (33.8)
Negative 221 (66.2)
HIV/AIDS disease stage
1 31 (27.4)
2 41 (36.3)
3 32 (28.3)
4 9 (8.0)
RESEARCH
(3.794) v. 12.011 (3.324) days; p=0.052). Pooled analyses were therefore carried out to determine the distribution of each of the two outcome indicators across various clinical characteristics at baseline, as shown in Figs 2 and 3.
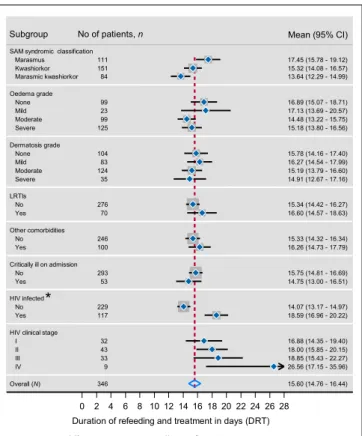
The mean RWG was slower with advanced HIV disease stage (p<0.0001), as shown in Fig. 2. Similarly, HIV-positive patients attained a much slower RWG compared with their HIV-negative counterparts (p<0.0001), as did marasmic patients compared with kwashiorkor and marasmic kwashiorkor, although this difference was not statistically significant (p=0.233). Patients who were admitted with other comorbidities, and those who were critically ill, attained a slower RWG than those who were not critically ill, but these differences were also not statistically significant (p=0.169 and p=0.102, respectively). The overall mean RWG was 7.38 g/kg/day (95% CI 6.91 - 7.84).
All inter-group differences were not statistically significant at 95% significance level except for HIV status (Fig. 3). HIV-positive patients were hospitalised for notably longer periods (mean 18.59 days; 95% CI 16.96 - 20.22) than their HIV-negative counterparts (mean 14.07 days; 95% CI 13.17 - 14.97). However, there were some patterns of differences in other predictor variables, which are worth noting despite the lack of statistical significance. Marasmic SAM patients who were discharged remained on treatment for longer periods compared with those who were classified as having kwashiorkor or marasmic kwashiorkor. Patients without or with mild oedema (+)stayed a little longer than those with moderate (++) and severe oedema (+++), but there were no notable statistically significant differences in respect of dermatosis grade. The average length of stay was also longer for SAM patients at stage IV of HIV infection compared with other clinical stages. The mean DRTs for all HIV clinical stages were higher than the overall mean DRT for the study sample, which was 15.6 days (95% CI 14.76 - 16.44).
Table 2 shows the bivariate relationship between patients’ baseline clinical profile and each of the two outcome variables in this study.
As shown in Table 2, the DRT was significantly different among SAM patients depending on their SAM syndromic classification. Marasmic patients stayed significantly longer in the hospital than kwashiorkor and marasmic kwashiorkor patients (p=0.032 and p=0.001, respectively). HIV-positive patients, most of whom were marasmic, stayed longer in the hospital by four daily units compared with their HIV-negative counterparts (p<0.0001), whereas HIV-positive patients who were at stage IV stayed longer by nine daily units compared with those who were at stage 1 (p=0.004). Other baseline clinical characteristics were not significantly associated with the DRT.
With regards to the RWG, HIV status and HIV clinical stages were the only clinical characteristics that were significantly associated with the RWG at the bivariate level. HIV-positive patients achieved a slower RWG by 3.3 units compared with HIV-negative patients (p<0.0001). Similarly, HIV-positive patients who were at stages IV, III and II attained a slower RWG by 3, 5 and 1 units, respectively, compared with those who were at stage 1; these results were statistically significant (p=0.006, p<0.0001, p=0.032, respectively).
The only predictors which had a statistically significant overall effect on DRT were SAM syndromic classification (F (2, 343); p=0.004) and HIV clinical stage (F (3, 113); p=0.035). The only predictor which had a statistically significant overall effect on RWG was HIV clinical stage (F (3, 113); p<0.000).
The multivariate model showed that HIV clinical stage was the only predictor of RWG and DRT at 95% level of statistical significance after adjusting for all other predictors in the model. The sum of all the predictor variables in the multivariate model explained 33% of variability of the RWG and 26% of variability in the DRT. The unexplained variance was most likely due to unmeasured confounders.
Since none of the predictors were significantly associated with the RWG and the DRT in a multivariable model, except for HIV disease stage, a multivariate LOWESS regression (MLOWESS) was not necessary HIV clinical stage
HIV infected Critically ill on admission Other comorbidities LRTIs Dermatosis grade Oedema grade SAM syndromic classification Subgroup
Overall (N) IV III II I Yes No Yes No Yes No Yes No Severe Moderate Mild None Severe Moderate Mild None Marasmic kwashiorkor Kwashiorkor Marasmus pts No. 341 9 33 43 32 117 224 53 288 99 242 69 272 33 12282 104 12198 23 99 83 147 111
Effect (95% CI)
7.38 (6.91 - 7.84) 3.97 (2.33 - 5.61) 2.30 (1.44 - 3.16) 5.87 (4.74 - 6.99) 7.64 (6.21 - 9.07) 5.20 (4.47 - 5.93) 8.51 (7.98 - 9.05) 7.17 (5.92 - 8.43) 7.41 (6.92 - 7.91) 7.01 (6.13 - 7.89) 7.52 (6.98 - 8.07) 7.43 (6.31 - 8.54) 7.36 (6.86 - 7.87) 7.45 (5.82 - 9.08) 6.94 (6.20 - 7.69) 8.10 (7.20 - 9.00) 7.29 (6.42 - 8.16) 7.45 (6.75 - 8.15) 7.78 (6.86 - 8.69) 7.74 (5.78 - 9.71) 6.80 (5.93 - 7.68) 7.63 (6.61 - 8.65) 7.46 (6.81 - 8.12) 7.07 (6.24 - 7.90) Mean (95% CI) Subgroup
...
No. of patients, ... n
*
*
0 1 2 3 4 5 6 7 8 9 10 11 12
Rate of weight gain (g/kg/day) *Inter-group differences were statistically significant (p<0.0001)
Fig. 2. Mean rate of weight gain (RWG) by HIV status, HIV disease stage and other baseline clinical characteristics: Pooled analysis based on patients who were discharged (2009 - 2013).
HIV clinical stage HIV infected Critically ill on admission Other comorbidities LRTIs Dermatosis grade Oedema grade SAM syndromic classification Subgroup
Overall (N) IV III II I Yes No Yes No Yes No Yes No Severe Moderate Mild None Severe Moderate Mild None Marasmic kwashiorkor Kwashiorkor Marasmus pts No. 346 9 33 43 32 117 229 53 293 100 246 70 276 35 12483 104 12599 23 99 84 151 111
Effect (95% CI)
15.60 (14.76 - 16.44) 26.56 (17.15 - 35.96) 18.85 (15.43 - 22.27) 18.00 (15.85 - 20.15) 16.88 (14.35 - 19.40) 18.59 (16.96 - 20.22) 14.07 (13.17 - 14.97) 14.75 (13.00 - 16.51) 15.75 (14.81 - 16.69) 16.26 (14.73 - 17.79) 15.33 (14.32 - 16.34) 16.60 (14.57 - 18.63) 15.34 (14.42 - 16.27) 14.91 (12.67 - 17.16) 15.19 (13.79 - 16.60) 16.27 (14.54 - 17.99) 15.78 (14.16 - 17.40) 15.18 (13.80 - 16.56) 14.48 (13.22 - 15.75) 17.13 (13.69 - 20.57) 16.89 (15.07 - 18.71) 13.64 (12.29 - 14.99) 15.32 (14.08 - 16.57) 17.45 (15.78 - 19.12) Mean (95% CI) Subgroup No of patients,
...
n*
0 2 4 6 8 1012 141618 202224 2628 Duration of refeeding and treatment in days (DRT)
*Inter-group differences were statistically significant (p<0.0001)
RESEARCH
to determine the adjusted relationship between the two outcome variables. Therefore, a bivariate LOWESS regression was used and the results are presented in Figs 4 and 5.
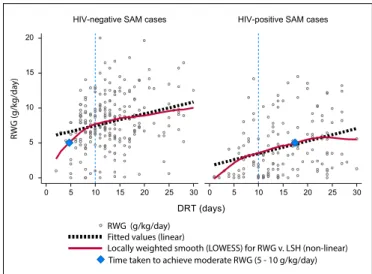
There were notable differences in the RWG between HIV-positive and HIV-negative SAM patients, as shown in Fig. 4. The locally weighted smooths predicted that, while HIV-negative patients who were on treatment for at least 10 days achieved a RWG of around 7.5 g/kg/day, those who were HIV-positive only attained a rate of 3.5 g/kg/day during the same time period (as shown by the vertical dotted lines in Fig. 4). For HIV-negative patients, a moderate RWG (5 - 10 g/kg/day) was achieved by patients who received refeeding and treatment for at least 5 days, whereas HIV-positive patients who attained the same RWG had to receive refeeding and treatment for at least 17 days. However, this analysis did not consider the SAM patients who had a negative RWG. There were 4 such patients from both facilities that were extreme outliers and distorted the position of the locally weighted smoothed lines significantly. It is also important to note that the RWG was consistently higher among HIV-negative patients compared with HIV-positive patients across all time intervals.
The locally weighted smoothed regression lines in Fig. 5 show that HIV-positive SAM patients who were at stage I achieved a faster RWG
in a relatively shorter period of refeeding and treatment compared with those who were at advanced stages of HIV infection.
Discussion
The results of the relationship between HIV status and the RWG both confirm and refute evidence from past research. The current study showed that on average, HIV-negative SAM patients recorded a better RWG than their HIV-positive counterparts. The results were similar in both hospitals. Savadogo et al.[22] also found similar relationships between HIV status and the RWG; however, unlike in the present study, they used the median RWG as a measure of the distribution of the RWG by HIV status. Their results revealed that HIV-positive SAM patients achieved a median of 4.64 g/kg/day v. 9.04 g/kg/day for HIV-negative patients. Several other studies[2,5,10] have also confirmed this relationship. However, Fergusson et al.[11] reported similar RWGs between HIV-positive and -negative SAM patients (mean 8.0 v. 8.9 g/kg/day, respectively). In the present study, the poorer nutritional recovery observed among HIV-positive SAM patients may, in part, be a result of metabolic changes associated with HIV infection, which impact on the nutritional status of the child. These changes include, Table 2. Relationship between baseline clinical characteristics of SAM cases and two outcomes (DRT (days) and RWG (g/kg/day)): Bivariate regression analysis
Outcomes
DRT (days) RWG (g/kg/day)
Factors β 95% CI p-value β 95% CI p-value
SAM syndromic classification
Marasmus Ref Ref
Kwashiorkor –2.126 –4.065 - –0.186 0.032 0.396 –0.681 - 1.473 0.470
Marasmic kwashiorkor –3.907 –6.051 - –1.564 0.001 0.559 –0.684 - 1.803 0.377
Oedema grade
None Ref Ref
Mild 0.241 –3.383 - 3.866 0.896 0.942 –1.039 - 2.924 0.350
Moderate –2.404 –4.630 - –0.177 0.134 0.974 –0.245 - 2.194 0.117
Severe –1.713 –3.820 - 0.394 0.111 0.647 –0.512 - 1.807 0.273
Dermatosis grade
None Ref Ref
Mild 0.486 –1.834 - 2.806 0.680 0.813 –0.449 - 2.075 0.206
Moderate –0.585 –2.681 - 1.519 0.583 -0.343 –1.484 - 0.797 0.554
Severe –0.864 –3.945 - 2.2162 0.581 0.161 –1.546 - 1.870 0.853
Presence of LRTIs
No Ref Ref
Yes 1.255 –0.847 - 3.358 0.241 0.065 –1.089 - 1.221 0.911
Other comorbidities
No Ref Ref
Yes 0.931 –0.934 - 2.795 0.327 –0.514 –1.53 - 0.506 0.322
Critically ill on admission
No Ref Ref
Yes –0.996 –3.344 - 1.352 0.405 –0.23 –1.517 - 1.043 0.716
HIV status
Negative Ref Ref
Positive 4.51 2.795 - 6.243 <0.001 –3.314 –4.225 - –2.403 <0.001
HIV clinical stage
I Ref Ref
II 1.125 –2.932 - 5.182 0.584 –1.773 –3.388 - –0.159 0.032
III 1.973 –2.338 - 6.285 0.366 –5.343 –7.059 - –3.627 <0.001
IV 9.680 3.123 - 16.238 0.004 –3.67 –6.282 - –1.063 0.006
RESEARCH
for example, hyper-metabolism of energy stores, nutrient losses and malabsorption as a result of inflammation of the gastrointestinal tract, reduced bioavailability of certain nutrients, and altered nutrient utilisation.[23] Poor appetite, which results in inadequate nutrient intake, has also been documented.[12] HIV-positive patients tend to present with severe oral and oesophageal candidiasis which undermine stherapeutic feeding efforts.[24] This finding begs a question as to whether a much more aggressive therapeutic feeding approach and treatment modality for HIV-positive SAM patients with associated comorbidities may be required to counteract these pathophysiological and metabolic challenges that HIV infection presents among SAM patients. The finding related to the relationship between DRT and HIV status agrees with results from a study by Madec et al.,[25] who showed that the duration of refeeding was much longer among HIV-positive patients (mean 22 days) than in HIV-negative patients (mean 12 days). However, these estimates were larger than those found in our study which recorded means of 14.07 and 18.59 days for HIV-negative and HIV-positive SAM patients, respectively. These differences may be related to the concomitant differences in discharge criteria set out in the study. The study by Madec et al.[25] seems to imply that the minimum number of days required to achieve good nutritional recovery is roughly 22 for positive SAM patients and 12 for HIV-negative patients. However, neither the present nor Madec’s study
were able to provide precise quantifiable targets, such as time taken to achieve weight-for-height z-scores, which are oedema-free. In the present study, weight-for-height z-scores were not used as the medical records did not always have data on patient length and height.
Perhaps the most important contribution to the literature from our study is the estimation of the relationship between HIV disease stage and the RWG. The study showed that the mean RWG became smaller with advanced HIV disease stage. The relationship between the RWG and HIV disease stage can be explained in light of the randomised controlled trial which demonstrated that half the children hospitalised for SAM developed oedema after starting antiretroviral therapy (ART).[26] Oedema may be associated with a slower RWG as children with oedema have to lose weight during the rehabilitation phase before they gain non-oedema-associated weight. Another possible explanation for this observation is that oedematous children are often more ill and unable to adequately metabolise nutrients. The evidence around this physiological process is still poorly understood.
Another key finding from this study was the estimation of the relationship between the RWG and DRT and how these variables can be influenced by HIV status and disease stage. The non-linear polynomial regression and scatter plot smooths estimated that the trajectory to better RWG was faster and consistently higher among HIV-negative SAM patients compared with their HIV-negative counterparts. To our knowledge, this finding has not been documented elsewhere in the literature and may need to be verified in future studies, within a variety of contexts. Nevertheless, against the backdrop of this study, where resources for prolonged management of SAM patients may be relatively fewer, the fact that HIV-positive SAM patients took longer to attain the same RWG as their HIV-negative counterparts may have some practical implications to consider. To optimise outcomes in respect of nutritional recovery, it may be important to prioritise resources for HIV-positive SAM patients, particularly the availability of hospital beds and therapeutic feeds, in addition to medication stock for SAM-related comorbidities.
Study limitations
The measurement of quality of care for SAM patients and its relationship with the outcome variables (RWG and DRT) was beyond the scope of this study and is encouraged in future research. However, it was encouraging to learn that there were no statistically significant differences between the two hospitals in terms of the distribution of the two outcomes and how they were related to the predictor variables. Furthermore, only 88% percent of the available medication records for children who were discharged during the entire study period met all the eligibility criteria for record review. It is not known what the remaining 12% would have contributed to the direction and strengths of the relationships presented in this study. There is also limited generalisability of the results presented here, as the study was conducted in purposefully selected facilities where the implementation of the WHO treatment modality for SAM was presumed optimal. Lastly, but not least, patient records did not always have an indication of whether the study subjects were already on ART at admission, and for how long they had been on treatment. This information could not be verified since the study involved a retrospective record review. This information would have constituted important variables to assess as potential confounders or predictors of the RWG and DRT. Given the design limitation of this study, the recommendations made in this article in relation to the WHO protocol should not be considered as definitive but rather suggestive.
Conclusions
The findings from this study suggest that nutritional recovery is, in part, a function of HIV status, HIV disease stage and the duration of refeeding. Our findings raise some important research topics to be explored in future research studies, including, for example, the determination of differential energy requirements among SAM patients depending on
0 5 10 15 20
0 5 10 15 20 25 30 0 5 10 15 20 25 30
HIV-negative SAM cases HIV-positive SAM cases
DRT (days)
RWG (g/kg/da
y)
RWG (g/kg/day) Fitted values (linear)
Locally weighted smooth (LOWESS) for RWG v. LSH (non-linear) Time taken to achieve moderate RWG (5 - 10 g/kg/day)
Fig. 4. Relationship between rate of weight gain (RWG) and duration of refeeding and treatment (DRT) by HIV status: Two-way scatter plot with locally weighted smoothed regression lines and a linear plot overlay.
0 5 10 15
0 5 10 15
0 5 10 15 20 25 30 0 5 10 15 20 25 30
Stage I Stage II
Stage III Stage IV
RWG Fitted values (Linear)
Locally weighted smooth (LOWESS) for RWG v. LSH (non-linear) DRT (days)
)y
ad/
gk/
g(
G
W
R
RESEARCH
their HIV status. Such studies can also explore the optimal choice of therapeutic feeds during the transition phase for HIV-positive SAM patients and how long it takes SAM patients, with or without HIV infection, to achieve specific targets for nutritional recovery in terms of the weight-for-height z-scores.
Acknowledgement. The staff at the two hospitals where this study was conducted are gratefully acknowledged.
Author contributions. DS and TP conceived the study, MM conducted the study and analysed the data. BS provided guidance for statistical analysis and commented on the initial drafts of the manuscript. MM prepared the manuscript for all co-authors (DS, TP and BS) to edit. Funding. This study was funded by the SA National Research Foundation (NRF) and in part by the SA Centre for Epidemiological Modelling and Analysis.
Conflict of interest. None.
1. Bachou H, Tylleskar T, Downing R, Tumwine JK. Severe malnutrition with and without HIV-1 infection in hospitalized children in Kampala, Uganda: Differences in clinical features, haematological findings and CD4+ cell count. Nutr J 2006;5(1):27. https://doi.org/10.1186/1475-2891-5-27
2. Ndekha MJ, Mnary MJ, Ashorn P, Briend A. Home based therapy with ready to use therapeutic food is of benefit to malnourished, HIV-infected Malawian children. Acta Paediatr 2005;94(2):222-225. https://doi. org/10.1111/j.1651-2227.2005.tb01895.x
3. Kessler L, Daley H, Malenga G, Graham S. The impact of the Human Immunodeficiency Virus type 1 on the management of severe malnutrition in Malawi. Ann Trop Paediatr 2000;20(1):50-56. https://doi. org/10.1080/02724930092075
4. Chinkhumba J, Tomkins A, Banda T, Mkangama C, Fergusson P. The impact of HIV on mortality during inpatient rehabilitation of severely malnourished children in Malawi. Trans R Soc Trop Med Hyg 2008;102(7):639-644. https:// doi.org/10.1016/j.trstmh.2008.04.028
5. Ticklay IM, Nathoo KJ, Siziya S, Brady JP. HIV infection in malnourished children in Harare, Zimbabwe. East Afr Med J 1997;74:217-220.
6. Mgone CS, Mhalu FS, Shao JF, et al. Prevalence of HIV-1 infection and symptomatology of AIDS in severely malnourished children in Dar Es Salaam, Tanzania. J Acquir Immune Defic Syndr 1991;4(9):910-913. https://doi. org/10.1097/00126334-199109000-00013
7. Prazuck T, Tall F, Nacro B, et al. HIV infection and severe malnutrition: A clinical and epidemiological study in Burkina Faso. AIDS 1993;7(1):103-108. https://doi.org/10.1097/00002030-199301000-00016
8. De Maayer T, Saloojee H. Clinical outcomes of severe malnutrition in a high tuberculosis and HIV setting. Arch Dis Child 2011;96(6):560-564. https://doi. org/10.1136/adc.2010.205039
9. Heikens GT. How can we improve the care of severely malnourished children in Africa? PLoSMed 2007;4(2):e45. https://doi.org/10.1371/journal. pmed.0040045
10. Sandige H, Ndekha MJ, Briend A, Ashorn P, Manary MJ. Home-based treatment of malnourished Malawian children with locally produced or imported ready-to-use food. J Pediatr Gastroenterol Nutr 2004;39(2):141-146. https://doi.org/10.1097/00005176-200408000-00003
11. Fergusson P, Tomkins A. HIV prevalence and mortality among children undergoing treatment for severe acute malnutrition in Sub-Saharan Africa: A systematic review and meta-analysis. Trans R Soc Trop Med Hyg 2009;103(6):541-548. https://doi.org/10.1016/j.trstmh.2008.10.029
12. World Health Organization. Guideline: Updates on the management of severe acute malnutrition in infants and children. WHO Library Cataloguing-in-Publication Data. Geneva: WHO, 2013. http://apps.who.int/iris/ bitstream/10665/95584/1/9789241506328_eng.pdf (accessed 16 May 2016). 13. Puoane T, Sanders D, Ashworth A, Ngumbela M. Training nurses to save
lives of malnourished children. Curationis 2006;29(1):73-78. https://doi. org/10.4102/curationis.v29i1.1055
14. Murgod R, Ahmed M. Instant nutrition assessment in children with protein energy undernutrition. Int J Appl Bio Pharma Tech 2015;6(1):171-177. 15. World Health Organization. Interim WHO clinical staging of HIV/AIDS and
HIV/AIDS case definitions for surveillance (African Region). Geneva: WHO, 2005. http://www.who.int/hiv/pub/guidelines/casedefinitions/en/index.html (accessed 15 May 2016).
16. World Health Organization. Management of severe malnutrition: A manual for physicians and other senior health workers. Geneva: WHO, 1999. http:// whqlibdoc.who.int/hq/1999/a57361.pdf (accessed 12 May 2016).
17. Latham MC. The dermatosis of kwashiorkor in young children. Semin Dermatol 1991;10(4):270-272.
18. World Health Organization. WHO child growth standards and the identification of severe acute malnutrition in infants and children. A joint statement by the World Health Organization and the United Nations Children’s Fund. Geneva: WHO, 2009. http://apps.who.int/iris/ bitstream/10665/44129/1/9789241598163_eng.pdf (accessed 10 May 2016). 19. Maitland K, Berkley JA, Shebbe M, Peshu N, English M, Newton CRJC.
Children with severe malnutrition: Can those at highest risk of death be identified with the WHO protocol? PLoS Med 2006;3(12):e500. https://doi. org/10.1371/journal.pmed.0030500
20. World Health Organization. Improving the Inpatient Management of Severe Acute Malnutrition: Toolkit to monitor current management of severe acute malnutrition. Geneva: WHO, 2010. http://www.cmamforum.org/Pool/Resources/ Toolkit-to-monitor-management- SAM-2010.pdf (accessed 12 May 2016). 21. Royston P. Lowess smoothing. Stata Technical Bulletin 1991;3:7-9. Reprinted
in Stata Technical Bulletin Reprints, vol. 1, pp. 41-44. College Station, TX: Stata Press, 1991.
22. Savadogo GL, Donnen P, Kouéta F, Kafando F, Hennart P, Dramaix M. Impact of HIV/AIDS on mortality and nutritional recovery among hospitalised severely malnourished children before starting antiretroviral treatment. Open J Pediatr 2013;3(4):340-345. https://dx.doi.org/10.4236/ojped.2013.34061 23. Mehta NM, Corkins MR, Lyman B, et al. Defining paediatric malnutrition: A
paradigm shift toward aetiology-related definitions. J Parenter Enteral Nutr 2013;37(4):460-481. https://dx.doi.org/10.1177/0148607113479972
24. Trehan I, O’Hare A, Phiri A, Heikens GT. Challenges in the management of HIV–infected malnourished children in Sub-Saharan Africa. AIDS Res Treat 2012;2012:1-8. https://dx.doi.org/10.1155/2012/790786
25. Madec Y, Germanaud D, Moya-Alvarez V, et al. HIV prevalence and impact on refeeding in children hospitalised for severe malnutrition in Niger: An argument for more systematic screening. PLoS ONE 2011;6(7):e22787. https:// dx.doi.org/10.1371/journal.pone.0022787