Mining Individual Behavior Pattern
Based on Semantic Knowledge
Discovery of Trajectory
Min Ren
1,2,3, Feng Yang
∗2, Guangchun Zhou
2and Haiping Wang
21Shandong Normal University, China
2Shandong University of Finance and Economics, China
3Shandong Provincial Key Laboratory for Distributed Computer Software Novel Technology, China
This paper attempts to mine the hidden individual behav-ior pattern from the raw users’ trajectory data. Based on DBSCAN, a novel spatio-temporal data clustering algo-rithm named Speed-based Clustering Algoalgo-rithm was put forward to find slow-speed subtrajectories(i.e., stops)of the single trajectory that the user stopped for a longer time. The algorithm used maximal speed and minimal stopping time to compute the stops and introduced the quantile function to estimate the value of the parame-ter, which showed more effectively and accurately than DBSCAN and certain improved DBSCAN algorithms in the experimental results. In addition, after the stops are connected with POIs that have the characteristic of an information presentation, the paper designed a POI-Behavior Mapping Table to analyze the user’s activities according to the stopping time and visiting frequency, on the basis of which the user’s daily regular behavior pattern can be mined from the history trajectories. In the end, LBS operators are able to provide intelligent and personalized services so as to achieve precise marketing in terms of the characteristics of the individual behavior.
Keywords: spatiotemporal data, semantic trajectory, clustering, knowledge discovery
1. Introduction
Due to the rapid development and wide applica-tion of such technologies as GPS, GSM, wire-less sensors, etc., people can easily collect a large amount of users’ real-time location data, which keep a record of their latitude and longi-tude coordinates at a certain time. And all those locations of the user, sorted in accordance with the time, constitute the user’s behavior trajec-tory. Trajectory data, the real records of a user’s
offline activities, often imply rich information of the spatial structure and his behavior, which can reflect his personal intentions, interests and hobbies and behavior patterns. This constitutes the research foundation of Location-based Ser-vice(LBS). Therefore, it has gradually become a hot research topic to mine the valuable infor-mation contained in individual trajectories. Human history trajectories recorded the move-ment processes of their activities that tended to have a certain purpose and often showed a high degree of temporal and spatial regularity [1]. Deep research on trajectory data can contribute to not only analyzing users’ activity patterns in a certain area [2], moving patterns[3,4] (such as walking, cycling, driving), etc., but also to determining daily life habits and behavior pat-terns of the individual and common features of the user groups[5,6], and even to predicting the behavior of the moving object in the following period of time [7,8] and understanding social relations of user groups[9,10], which has great significance for personalized recommendations
[11,12]and precision marketing.
Knowledge discovery of users’ activities, how-ever, is highly challenging, due to the difficulty in directly finding users’ behavior from their history trajectories. This is so mainly because the trajectory is represented by spatial coordi-nates with timestamps, the latitude and longi-tude coordinates in a particular reference coor-dinate system. The specific application usually does not focus on the coordinate values, but on the geographical positions that imply certain
mantic information and can be associated with the things related to them when mentioned. The current major relevant research analyzes the tra-jectory coordinates sequence by means of tradi-tional data mining technology. But the spatial location data lack the wealth of useful infor-mation found in common databases, such as geographical background knowledge, applica-tion semantic knowledge, etc. Thus, the exist-ing research cannot effectively extract implicit knowledge of the trajectory because of the lack of information.
The authors’ contributions are as follows. Firs-tly, a Speed-based Clustering Algorithm was designed to mine a user’s stops in a single tra-jectory accurately, which was not affected by noises and acnodes. Secondly, considering the user’s characteristics and his movement envi-ronment, a POI-Behavior Mapping Table was created with the help of knowledge database
(POI database) and on the basis of statistics of mass questionnaires to extract knowledge from the large-scale trajectory data in order to mine a more clear, accurate and lucid individ-ual behavior pattern. At present, the research that combines knowledge discovery of trajec-tory and data mining of moving objects is quite limited.
In addition, related works are discussed in Sec-tion 2, and the following secSec-tion defines rele-vant terms of the research problem. Then, the authors propose a Speed-based Clustering Al-gorithm and design a POI-Behavior Mapping Table in Section 4. In order to validate the re-search methods, Section 5 conducts some exper-iments by using data set Geolife13 and analyzes results in detail. Finally, the authors conclude the research work and discuss the future work in Section 6.
2. Related Works
2.1. Trajectory Data Clustering
The basis of research on trajectory is to deter-mine users’ significant areas from the trajectory data by using the clustering algorithm, which has drawn more and more attention. Ashbrook and Starner [7] used K-means clustering algo-rithm to find important places in trajectories. Its key limitation is the number of clusters that must be given a priori, but this number is often unknown in the problem. At the same time, the
noise and acnode have great influence on the clustering results. The density-based cluster-ing algorithm was used more commonly, com-pared with others. DBSCAN[14], a representa-tive and popular density-based algorithm, was widely used due to its outstanding advantage that it can discover clusters of arbitrary shape, disregarding the noise. Karli et al. [15] elimi-nated high speed movement data, and then used DBSCAN algorithm to extract important places from trajectories with slow speed only. But DBSCAN algorithm is very sensitive to the in-put parameters Eps and MinPts, which repre-sent the radius and the minimum number of points. Therefore, some researchers improved DBSCAN algorithm in many aspects. For ex-ample, Zhou et al. [16] put forward a density and join-based clustering algorithm named DJ-Cluster for the extraction of important places from spatio-temporal trajectory data. The main idea was that if the number of a point’s neigh-bors within distance Eps was less than MinPts, it was labeled noise. Otherwise, if any neighbor belonged to an existing cluster, it and its other neighbors joined in and if not, all points formed a new cluster. The method improves the effi-ciency and saves much memory. Palma et al.
Therefore, it is essential to design a cluster-ing algorithm with high performance and good scalability. Certain location devices like GPS are unable to capture moving objects in a sealed space(such as elevators, buildings)which leads to the loss of signals and a blank in the trajec-tory[15, 22]. For this reason, objects’ activities were seemingly not reflected in trajectory ef-fect. Moreover, these activities were often sig-nificant for understanding of the characteristics of users’ behavior, but they were overlooked in the above-mentioned studies. For users’ stops, this paper took into account both dense and dis-appeared sample points in a trajectory, and at the same time emphasized the integrity of a tra-jectory when analyzing it, which avoided the interference of the noise data.
2.2. User’s Behavior Mining
Individual behavior pattern mining is important research into knowledge discovery of trajectory. Currently the related research is few and dis-persed. Liao et al.[2] built an Activity Model, based on the Relational Markov Network, to label the user’s activities such as staying at home, working, shopping, dining out, visiting, and so on. Hu et al. [23] used Web Ontology Language(OWL)to understand buddies’ rela-tionships, locations and activity for automatic context-aware presence management. Yang et al.[22]proposed mining individual life patterns and routines from individual trajectory infor-mation and developed a mining framework of life patterns. However, this study only offered the idea and process of trajectory data mining, but did not give the specific and detailed mining method. Kirmse et al.[20]explained the seman-tic of daily occupied areas of users, combining with the characteristics of time. For example, users stopped longest in their working place dur-ing the day while at home in the evendur-ing. But they did not associate the occupied area with a significant place. Ying et al.[24]made full use of space information to assist the interpretations of their research results. At first, users’ daily occupied places, obtained by clustering, were related to their neighboring points of interest; e.g., the park, school, bank, hotel, and so on, and then sorted according to users’ trajectories like “home-school-company-home” to realize the semantic interpretation. Li et al. [25] sta-tistically analyzed hot spots in which the user stayed in accordance with the period to find a user’s repetitive periodic behavior. But this
analysis could only deal with a single periodic model of the behavior and failed to solve multi-ple periodic models and group periodic model, etc.
To sum up, there are few systematic guidance and research schemes for knowledge discov-ery in trajectory data sets of moving objects. This paper established a POI-Behavior Mapping Table through questionnaires, based on which users’ behavior patterns in POIs were analyzed and semantics of the trajectory were interpreted more clearly and accurately.
3. Problem Definitions
Trajectory data mining can help us to obtain ef-fective, potentially useful, and understandable information from abundant spatio-temporal data. In this section, some definitions of the relevant research are presented in detail.
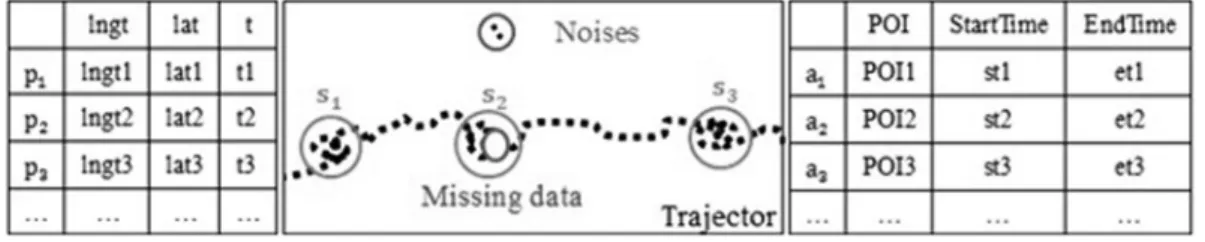
Definition 1. Trajectory: Trajectory is a dis-crete sequence based on the time, made up of a series of spatio-temporal sample points; i.e.,
T = {p1,p2, . . . ,pn}, where pi (i = 1, . . . ,n) is a real-time coordinate point recorded by the GPS device after each sampling time, usually represented by a triple (lngt, lat, t), which means the location coordinates(lngtis the lon-gitude and lat is the latitude) of a person at timet.
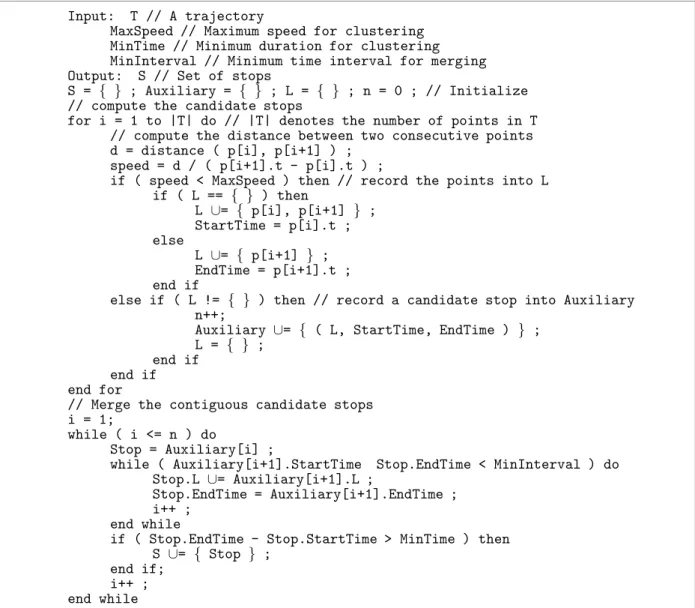
A trajectory is often obtained with the help of the GPS device. However, when a user is in a relatively sealed space such as an elevator or basement, the device tends to produce erroneous data called noise(sample points in the blue cir-cle)because of inaccurate location, as shown in Figure 1, or it loses parts of data without cap-turing the mobile object, leading to a blank in a trajectory (sample points in the red oval), as shown in Figure 1. This means that the sam-pling point disappears for a period of time t
at time t, and after the limited time t, it will reappear.
Figure 1.Research framework.
Definition 2. Stop: Stop is a triple (L, Start
-Time,EndTime), whereL={pi,pi+1,· · ·,pm} is a subtrajectory ofT, which is a geometry clus-ter of trajectory sampling points. StartTime=
pi.tis the start time of the stop andEndTime=
pm.t is the end time. Stops of specific appli-cations are valuable only when the duration
MinTimeis sufficient, that is
StartTime−EndTime≥MinTime
Stops are divided into two types. The first, denoted by Stop I, is a subtrajectory made up of dense sample points, in which the speed of any two contiguous trajectory sampling points is less than the normal walking speed and even approximately equals zero. For example,S1and
S3 in Figure 1. The second, named Stop II, is a subtrajectory with lost signals, such as S2 in Figure 1.
Stops are semantically important parts of a tra-jectory. A stop often means that a user stayed in a geographical area for a certain amount of time. If a user stayed there for a long period of time, it is reasonable to believe that he was very interested and might have visited or been engaged in an activity. Moreover, a stop of-ten corresponds to a specific significant place, such as park, cinema, supermarket, etc., which is called Point of Interest(POI).
Definition 3. POI: POI refers to a specific place, usually denoted by(id, name, category,
loc), where it is a unique number, and loc is its location that can be described by the coordinates
(longitude and latitude)of the center position; i.e.,loc= (longitude,latitude).
Trajectory has no semantic geographical infor-mation, while the most important characteristic of POI is its informative presentation. When a user’s activity associates with a specific POI, which increases the space and semantic charac-teristics of the location, his behavior in the area can be understood.
Definition 4. Activity: Activity is a stop of a user in a POI, denoted by a tuple (POI,
StartTime, EndTime). In the end, a user’s trajectory is converted to the sequence of his activities in POIs. An activity sequence is a set of activities in accordance with the chronolog-ical order, represented by Activities= {a1,a2,
. . . ,an}, where ai (i = 1, . . . ,n) is an activity in the sequence.
4. Research Methods
4.1. Speed-based Clustering Algorithm
In the real world, individual activity is often pur-poseful and usually indicated by stops, which helps to understand a user’s behavior much better. According to Definition 2, this paper proposes a Speed-based Clustering Algorithm
(SBC for short) to find out two kinds of stops in the trajectory.
4.1.1. Pseudo Code
Trajectory data of mobile objects have a strong spatio-temporal correlation. Considering the continuity of the two adjacent trajectory points at a particular time, the algorithm initially started clustering based on the speed to obtain all pos-sible candidate stops, and then merged two ad-jacent candidate stops according to their time interval in order to avoid dropping without satis-factory conditions due to abnormal data(namely noise)produced by the GPS equipment that lo-cated falsely.
This algorithm is determined by density-based algorithm, but integrates some additional differ-ent concepts.
Definition 5. Neighborhood of a point: Let
distance(pi,pi+1)/(pi+1·t−pi·t)≤MaxSpeed
(1) Given that the Earth is spherical, the distance between two pointsPiandPi+1is calculated by the following formulas:
distance(pi,pi+1) =2rsin−1(√) (2) and
=sin2
1
2(pi.lat−pi+1.lat) + 1
2cos(pi.lat)· ·cos(pi+1.lat)sin2(pi.lngt−pi+1.lngt)
(3)
whereris the radius of the Earth.
IfPiandPi+1are neighbors andqis the neigh-bor of Pi+1, q is also the neighbor of Pi. The
neighborhood of a pointPiis the maximal set of its neighbors (the neighborhood is ordered by time). Each point in a neighborhood is called core point.
Definition 6. Cluster: Let{pk,pk+1, . . . ,pm} be points of a neighborhood. If satisfying
pm.t−pk.t ≥ MinTime, the neighborhood is a cluster with respect toMaxSpeedandMinTime.
Definition 7. Noise: Let{pk,pk+1, . . . ,pm}be a cluster. If Pi does not belong to this cluster wherek ≤i≤m, it is defined as a noise. The pseudo code of this algorithm is shown in Figure 2.
There are four main merits of SBC for clus-tering trajectory data compared with DBSCAN
[15]and CB-SMoT[17]:
Input: T // A trajectory
MaxSpeed // Maximum speed for clustering MinTime // Minimum duration for clustering MinInterval // Minimum time interval for merging Output: S // Set of stops
S = { } ; Auxiliary = { } ; L = { } ; n = 0 ; // Initialize // compute the candidate stops
for i = 1 to |T| do // |T| denotes the number of points in T // compute the distance between two consecutive points d = distance ( p[i], p[i+1] ) ;
speed = d / ( p[i+1].t - p[i].t ) ;
if ( speed < MaxSpeed ) then // record the points into L if ( L == { } ) then
L ∪= { p[i], p[i+1] } ; StartTime = p[i].t ; else
L ∪= { p[i+1] } ; EndTime = p[i+1].t ; end if
else if ( L != { } ) then // record a candidate stop into Auxiliary n++;
Auxiliary ∪= { ( L, StartTime, EndTime ) } ; L = { } ;
end if end if end for
// Merge the contiguous candidate stops i = 1;
while ( i <= n ) do
Stop = Auxiliary[i] ;
while ( Auxiliary[i+1].StartTime Stop.EndTime < MinInterval ) do Stop.L ∪= Auxiliary[i+1].L ;
Stop.EndTime = Auxiliary[i+1].EndTime ; i++ ;
end while
if ( Stop.EndTime - Stop.StartTime > MinTime ) then S ∪= { Stop } ;
end if; i++ ; end while
(i) The speedMaxSpeedbetween two consec-utive sampling points is used for clustering instead of the density of sampling points, mainly because many sampling points in a trajectory are lost easily in some area where sampling points are relatively sparse while the speed is still slow due to the location equipment and the activity types of moving objects.
(ii) The minimal timeMinTimereplaces a min-imal amount of points MinPts in a neigh-borhood, which can avoid problems such as the absence of points because of some equipment failure and time differences in the sample rate.
(iii)The algorithm uses quantile function to cal-culate the relative parameterMaxSpeed re-lated to the mean and standard deviations instead of an absolute, fixed value given manually.
(iv)Two neighboring clusters are merged ac-cording to the given thresholdMinInterval, which can reduce the loss of some stops that are split into many clusters due to noises of error location, but the durations of some clusters are less thanMinTime.
4.1.2. Parameters Estimation
This algorithm includes four parameters that are the trajectory dataT, maximum speed threshold
MaxSpeed, the minimum stopping time thresh-old MinTime, and the minimum time interval thresholdMinInterval, respectively.
MaxSpeed represents the maximal speed
be-tween two consecutive points, which is used to identify the lower speed parts of a trajectory, corresponding to POI. If a moving object uses different vehicles in a trajectory, its speed obvi-ously changes. For example, when a user is on a motor vehicle, his average speed might reach 30-50 m/s in urban areas, but it might fall to 0-5 m/s in traffic jams. And when he walks the normal walking speed is usually 2-3 m/s. There-fore, if the MinSpeed value is set to be 3 m/s, traffic jam can become a stop by mistake. We calculate this parameter according to [17]. For a trajectory T, we calculate the speed between two consecutive sample points, and then we de-termine the mean and the standard deviation of these speeds. Through the two parameters a
Gauss curve can be drawn accordingly. On the basis of the curve, the value ofMaxSpeedis able to be determined by using the quantile function:
[0,1] → R, an inverse cumulative distribution function. The quantile function is defined as:
F−1(p,,) = +√2f−1(2p−1) (4)
where
f−1(x) =
∞
k=0
ck 2k+1
√
2 x
2k+1
(5)
ck = k−1
m=0
cmck−1−m
(m+1)(2m+1) (6)
andc0 =1.
According to the formulas above, theMaxSpeed
value is lower than the mean, usually in the in-terval of[0, −].
MinTimeis not an absolute time setting. But in general, if an object stayed in an area for more than 30 minutes[9, 17], it can be inferred that there are related activities of the object in the area.
MinInterval can be set according to the sam-pling interval.
4.2. POI-Behavior Mapping Table
The research on users’ behavior focused on the semantic that represented the matching of tra-jectories and POIs and on a certain amount of stopping time. Users’ behavior is closely re-lated to the classification of POIs that are based on map data of LBS operators and quite different from each other. In the previous research [26], we used a two-stage classification and divided POIs into 15 categories and 150 subcategories, according to the BAIDU Map.
POI Category POI Sub-category Behavior Minimal Duration Maximal Duration
Catering
Chinese Restaurant
delivery 15 minutes 45 minutes
eating 1 hours 4 hours
working 3 hours 10 hours
Chinese Fast Food Restaurant
take-out 5 minutes 30 minutes delivery 15 minutes 45 minutes eating 30 minutes 1 hours
working 3 hours 10 hours
. . . . . . . . . . . .
Leisure & Entertainment Cinema
watching films 1 hours 3 hours
working 4 hours 8 hours
. . . . . . . . . . . .
Table 1.Parts of POI-Behavior mapping table.
5. Experiments and Results
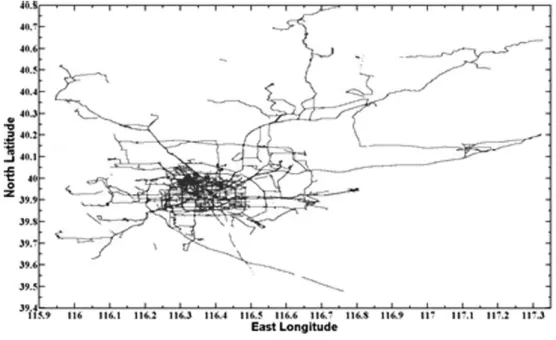
The experimental dataset chosen for calcula-tion in this paper is GeoLife Trajectories Vi-sion 1.3, collected by Microsoft Research Asia, including 18,670 trajectories of 182 users in 11,129 effective days, and with the total dis-tance up to 1,292,951 kilometers. Altogether 2,255,871 trajectory sampling points of 31 users living in Beijing urban areas and the surround-ing areas were compiled over the course of 325 days(with decimal coordinates of north latitude 39.47◦∼40.79◦ and east longitude 115.94◦∼
117.33◦). Their trajectories are shown in Fig-ure 3, from which we can see that users’ activ-ities are mainly concentrated in the main urban districts, with the most intensive amount of sam-ple points being in Haidian district where most volunteers of GeoLife project live or work. The thick lines imply the routes that users walked along more often. Trajectory ID, latitude, lon-gitude and sampling time are selected in our experiments for data analysis.
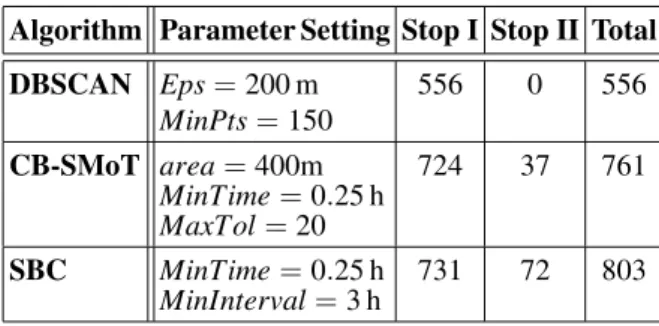
In Table 2, the clustering result of using SBC on the experimental dataset in this paper is compared with those using DBSCAN and
SmoT, which illustrates that the clustering effect of SBC is better than the other two algorithms, for it can obtain more Stop I, and especially more Stop II that includes the absent sampling points.
Algorithm Parameter Setting Stop I Stop II Total
DBSCAN Eps=200 m
MinPts=150
556 0 556
CB-SMoT area=400m
MinTime=0.25 h MaxTol=20
724 37 761
SBC MinTime=0.25 h
MinInterval=3 h 731 72 803
Table 2.Clustering results.
In order to better understand users’ consump-tion behavior, in this paper clustering results were mapped to Baidu Map and finally 428 POIs were matched. Table 3 describes the statistics of consumer behavior in some sub-categories of “food” and “leisure” POI categories, such as the number of matched POIs of different sub-categories, users’ average durations in POIs for the consumption and users’ total visit times. After comprehensively investigating a user’s be-havior over many days, it could be eventually concluded that in the past month he had visited Wal-Mart 20% of the days. Moreover, in 90% of the visiting days, he arrived between 9:00 to 9:30 and stayed for about 1.5 hours, and in
50% of the visiting days, he took this route: 52 Zhichun Road (Home) → Yonghe King( Chi-nese Fast Food Restaurant) → Wal-Mart ( Su-permarket).
Therefore, local merchants can infer consum-ing places that users often visited and their con-sumption trends according to their behavior pat-tern, and at specific times, purposefully empha-size advertisings for products or services users are interested in given their location and be-havior in order to improve the precision of the marketing.
6. Conclusion
Aiming to determine individual behavior char-acteristics and living habits from users’ raw tra-jectory data, the Speed-based Clustering Algo-rithm, an improved DBSCAN, was designed to extract stops in a single trajectory without the influence of noises and acnodes. Next, based on the authors’ preliminary research, a POI-Behavior Mapping Table was built through the questionnaires and actual investigations so as to recognize the activities in the POIs users being engaged. With the analysis of users’ activities over a long period of time, daily regular behav-ior pattern of users can be determined, which will help merchants to enhance their under-standing of the potential consumer trends, pro-mote personalized information for vaious po-tential consumers, and improve the precision of
POI Category POI Sub-category Number Average Duration (h) Visit Times
Catering
Chinese Restaurant 39 1.8290 44
Chinese Fast Food Restaurant 9 0.6189 19
Western Restaurant 2 1.7181 2
Western Fast Food Restaurant 6 0.8048 17
Leisure Catering 4 1.0814 5
Leisure & Entertainment
Cinema 9 2.8668 10
Tourist Resort 10 2.3657 13
Library 3 2.2823 3
KTV 6 3.9063 7
Shopping Shopping Center 7 2.1583 16
Supermarket 12 1.0396 22
Total 107 1.8792 158
marketing. In their future work, the authors will conduct experiments with the trajectory dataset collected by them and verify the accuracy of the method. Furthermore, trajectories of user groups will be chosen as the research object to analyze group behavior characteristics.
Acknowledgements
This research is supported by National Natu-ral Science Foundation of China(NSFC)Grant No. 71172046, MOE(Ministry of Education in China) Youth Fund Project of Humanities and Social Sciences (No. 13YJC630162), Natural Science Foundation of Shandong Province(No. ZR2011GL018), Project of Shandong Province Higher Educational Science and Tech-nology Program(No. J11LG11)and Social Sci-ences Youth Project of Shandong Province
(No. 13DGLJ04).
References
[1] M. C. GONZ´ALEZ, C. A. HIDALGO, A-L. BARABASI,´ Understanding Individual Human Mobility Patterns, Nature, 2008.453(7196): 779–782.
[2] L. LIAO, D. J. PATTERSON, D. FOX, H. KAUTZ, Build-ing Personal Maps from GPS Data, Annals of the New York Academy of Sciences, 2006.1093(12): 249–256.
[3] F. CALABRESE, M. DIAO, G. DILORENZO, J. FER-REIRA, C. RATTI, Understanding Individual Mobility Patterns from Urban Sensing Data: A Mobile Phone Trace Example, Transportation Research Part C, 2013.26: 301–313.
[4] K. ZHENG, Y. ZHENG, N. J. YUAN, S. SHANG, On Discovery of Gathering Patterns from Trajectories, Proceedings of the 29th IEEE International Confer-ence on Data Engineering, 2013: 242–253.
[5] Y. ZHENG, L. ZHANG, X. XIE, W-Y. MA, Mining Correlation between Locations Using Human Loca-tion History,Proceedings of the 17th ACM SIGSPA-TIAL Conference on Advances in Geographical Information Systems, 2009: 472–475.
[6] Y. ZHENG, X. XIE, Learning Location Correlation from GPS Trajectories,Proceedings of the 11th Int. Conf. Mobile Data Management, 2010: 27–32.
[7] D. ASHBROOK, T. STARNER, Using GPS to Learn Significant Locations and Predict Movement across Multiple Users,Personal and Ubiquitous Comput-ing, 2003.7(5):275–286.
[8] J. KRUMM, E. HORVITZ, Predestination: Inferring Destinations from Partial Trajectories,Proceedings of the 8th ACM Conference on Ubiquitous Comput-ing, 2006: 243–260.
[9] X. XIAO, Y. ZHENG, Q. LUO, X. XIE, Finding Sim-ilar Users Using Category-Based Location History, Proceedings of the 18th ACM SIGSPATIAL Inter-national Symposium on Advances in Geographic Information Systems, 2010: 442–445.
[10] Y. ZHENG, L. ZHANG, Z. MA, X. XIE, W-Y. MA, Recommending Friends and Locations Based on Individual Location History, ACM Transaction on the Web, 2011.5(1): 1–44.
[11] M. YE, P. YIN, W-C. LEE, Location Recommenda-tion for LocaRecommenda-tion-Based Social Networks, Proceed-ings of the 18th ACM SIGSPATIAL International Conference on Advances in Geographic Information Systems, 2010: 458–461.
[12] J. BAO, Y. ZHENG, M. F. MOKBEL, Location-based and Preference-Aware Recommendation Us-ing Sparse Geo-Social NetworkUs-ing Data, Proceed-ings of the 20th ACM SIGSPATIAL International Conference on Advances in Geographic Information Systems, 2012: 199–208.
[13] http://research.microsoft.com/en-us/ projects/geolife/default.aspx
[14] M. ESTER, H-P. KRIEGEL, J. SANDER, X. XU, A Density-Based Algorithm for Discovering Clusters in Large Spatial Databases with Noise,Proceedings of the 2nd International Conference on Knowledge Discovery and Data Mining, 1996: 226–231.
[15] S. KARLIS, Y. SAYGIN, Mining Periodic Patterns in Spatio-Temporal Sequences at Different Time Granularities,Journal of Intelligent Data Analysis, 2009.13(2): 301–335.
[16] C. ZHOU, D. FRANKOWSKI, P. LUDFORD, S. SHEKHAR, L. TERVEEN, Discovering Personal Gazetteers: an Interactive Clustering Approach, Proceedings of the 12th ACM International Sym-posium on Advances in Geographic Information Systems, 2004: 266–273.
[17] A. T. PALMA, V. BOGORNY, B. KUIJPERS, L. O. AL-VARES, A Clustering-Based Approach for Discover-ing InterestDiscover-ing Places in Trajectories,Proceedings of the 2008 ACM Symposium on Applied Computing, 2008: 863–868.
[18] M. ZIMMERMANN, T. KIRSTE, M. SPILIOPOULOU, Finding Stops in Error-Prone Trajectories of Moving Objects with Time-Based Clustering,Proceedings of the 2009 International Conference on Intelli-gent Interactive Assistance and Mobile Multimedia Computing, 2009: 275–286.
[19] Z. XIULI, X. WEIXIANG, Clustering Spatio-Temporal Trajectories Based on Compression of Interesting Places,Journal of Beijing Jiaotong Uni-versity, 2011.35(3): 53–57.
[21] W. HU, X. LI, G. TIAN, S. MAYBANK, Z. ZHANG, An Incremental DPMM-Based Method for Trajectory Clustering, Modeling, and Retrieval,IEEE Transac-tions on Pattern Analysis and Machine Intelligence, 2013.35(5): 1051–1065.
[22] Y. YE, Y. ZHENG, Y. CHEN, J. FENG, X. XIE, Mining Individual Life Pattern Based on Location History, Proceedings of the 10th International Conference on Mobile Data Management, 2009: 1–10.
[23] D. H. HU, C-L. WANG, GPS-Based Location Extrac-tion and Presence Management for Mobile Instant Messenger,Proceedings of the International Feder-ation for InformFeder-ation Processing, 2007: 309–320.
[24] J. JIA-CHINGYING, W-C. LEE, T-C. WENG, V. S. TSENG, Semantic Trajectory Mining for Location Prediction,Proceedings of the 19th ACM SIGSPA-TIAL International Conference on Advances in Geographic Information Systems, 2011: 34–43.
[25] Z. LI, B. DING, J. HAN, R. KAYS, P. NYE, Mining Periodic Behaviors for Moving Objects, Proceed-ings of the 16th ACM International Conference on Knowledge Discovery and Data Mining, 2010: 1099–1108.
[26] M. REN, G. ZHOU, G. GU, H. WANG, Statistical Analysis of User Check-in Behavior and Its Ap-plication in O2O Marketing, Pakistan Journal of Statistics, 2013.29(6): 973–988.
Received:December, 2014
Revised:April, 2015
Accepted:April, 2015
Contact addresses:
Min Ren School of Information Science and Engineering Shandong Normal University Jinan, 250014 China e-mail:rm [email protected]
Feng Yang School of Computer Science & Technology Shandong University of Finance and Economics Jinan, 250014 China e-mail:[email protected]
Guangchun Zhou School of Computer Science & Technology Shandong University of Finance and Economics Jinan, 250014 China Haiping Wang School of Computer Science & Technology Shandong University of Finance and Economics Jinan, 250014 China
MINRENis a Phd student at Shandong Normal University and an asso-ciate professor at Shandong University of Finance and Economics. Her research interests are location service and data mining.
FENGYANGis an associate professor and Master tutor at Shandong Uni-versity of Finance and Economics. His research interests are electronic commerce and trajectory mining.
GUANGCHUNZHOUis a lecturer at Shandong University of Finance and Economics. His research interest is social network.