HOW DO CHANGES TO MEDICARE AND MEDICAID AFFECT HEALTHCARE COMPANY VALUATIONS?
Jack G. Amoroso
An honors thesis submitted to the faculty of the Kenan-Flagler Business School at the University of North Carolina at Chapel Hill
Chapel Hill 2019
ABSTRACT
Jack G. Amoroso
How do changes to Medicare and Medicaid affect healthcare company valuations? (Under the Direction of Bradley Staats)
ACKNOWLEDGEMENTS
I am fortunate to have had the opportunity to work on an Honors Senior Thesis over the past year. I’ve gained a passion for healthcare and an appreciation of its
complexities and challenges. This research would not have been possible without the help of a few key individuals.
Dr. Bradley Staats – Thank you for your insights and guiding questions; your oversight inspired me to learn more each and every day.
Dr. Chavis and Dr. Rath – Thank you for taking the time to contribute your perspectives and thoughtful feedback.
Dr. Patricia Harms – Thank you for holding us to the highest standards as we developed our research over the Fall 2018 semester.
The Kenan Scholars Program and the Kenan Institute – Thank you for your early and ongoing engagement with the research process; whenever I was stuck, I knew the Kenan Institute team would be a resource.
TABLE OF CONTENTS
ABSTRACT...ii
ACKNOWLEDGEMENTS...iii
LIST OF EQUATIONS...vii
LIST OF TABLES...vii
RESEARCH QUESTION...1
I. INTRODUCTION...2
Insurance is Not Designed for Prevention / Long-Term Health...3
The Biopharma Industry was Shaped by Regulation...5
Medicare’s “Technological Imperative” Promotes New and More Care...8
II. LITERATURE REVIEW...12
Situation Overview...12
Financial Risk...12
History of Medicare: Effects of Shifting Financial Risk...13
State of Research...17
Patients...17
Private Insurance...17
Goals for Research...19
III. METHODOLOGY...20
Event Studies...20
Identifying Events...22
Statistical Analysis Process...23
Identifying Companies...26
Limitations...27
IV. RESULTS...28
6/28/2012 – Supreme Court Upholds Parts of the Affordable Care Act...28
The Nature of the Affordable Care Act and the Supreme Court Case...29
Market Reactions to the NFID v Seblius...31
Summary...31
11/9/2016 – 2016 Presidential Election and State Ballots...33
Relative Easing of Drug Pricing Pressures...34
Anticipated Scaling Back of the Affordable Care Act...34
Repatriation and Tax Reform...35
Summary...35
6/22/2017 – Drug Pricing Documents and Senate Health Bill...37
Drug Pricing and Innovation Working Group...37
Market Reactions to the BCRA...40
Summary...41
4/14/2015 – Medicare Access and CHIP Reauthorization Act of 2015...42
Performance Payment Systems...42
Market Reaction...43
Summary...43
V. CONCLUSION AND FURTHER RESEARCH...45
VI. APPENDIX...48
LIST OF EQUATIONS
Equation 1: Expected Return of Individual Stock Given Market Return...24
Equation 2: Abnormal Return of an Individual Stock on a Given Day...24
LIST OF TABLES
Table 1: Common Payment Methods to Healthcare Providers...16 Table 2: Medicare Initiatives to Change Basic Payment Methods...16 Table 3: Estimation, Observation, and Event Dates for Analysis...23 Table 4: 6/28/2012 Count of Companies with Abnormal Returns by Industry and
Event Window...29 Table 5: 11/9/16 Count of Companies with Abnormal Returns by Industry and
Event Window...33 Table 6: 6/22/2012 Count of Companies with Abnormal Returns by Industry and
Event Window...37 Table 7: 4/14/15 Count of Companies with Abnormal Returns by Industry and
RESEARCH QUESTION
On July 30th, 1965 at the Truman Presidential Library, President Lyndon Johnson
signed into law the Social Security Amendments of 1965, which included Medicare and Medicaid1 (Center for Medicare & Medicaid Services, 2015). In 2017, the Medicare and
Medicaid programs spent $1.3 trillion on health expenditures, and from 2018 to 2027, the program expenditures are expected to grow at average annual rates of 7.4% and 5.5%, respectively (Center for Medicare & Medicaid Services, 2017). Because of the immense size of the programs, the United States government is the largest customer for many companies in healthcare, either directly or by proxy. Thus, CMS policies often act as levers used by legislators to steer the $3.49 trillion healthcare industry.2
Medicare and Medicaid’s industry significance guided my interest in understanding how changes to Medicare and Medicaid policies affect company
valuations. Specifically, this thesis is an exploration of event studies as a tool to assess value creation and value destruction from legislative or policy changes relating to Medicare and Medicaid.
1 See Appendix A for a comparison of Medicare and Medicaid.
2 Of the $3.49 trillion national health expenditures in 2017, hospitals ($1.143 trillion), physician services
I. INTRODUCTION
The United States healthcare system has changed tremendously over the past 50 years and is still highly malleable. We have the most technologically advanced system in the world, but one of the least efficient in terms of outcomes per dollar, even among developed nations (OECD, 2017). Most politicians, researchers, clinicians and business people agree that the unsustainable growth in healthcare costs will force fundamental change to the system. So the question is not if, but rather when change comes, what will be the impact on value? In this thesis, I use public markets to provide a window into value creation and destruction. To begin understanding the core, fundamental drivers of valuation, I look for characteristics or patterns in company reactions in the wake of legislative changes.
In understanding why one company valuation may react positively or negatively to an event, it is important to remember that the healthcare system has evolved based on the incentives of many individuals and organizations. I use this introduction to show three examples of how the historical evolution is woven into the incentives of companies today:
1. Insurance markets were not designed to promote prevention / long-term health 2. The biopharma industry was shaped by regulation
The examples in this introduction serve to show that the structure of the healthcare system is not based on a predictable or even rational design; rather, the structure of our current healthcare system is the result of greed and good nature, politics and tax incentives, genius scientific discovery and horrific drug disasters. I treat the industry peculiarities as opportunities to better understand one of the most complex challenges of our generation.
Insurance is Not Designed for Prevention / Long-Term Health
As the quality, and subsequently, the cost of hospital care increased throughout the early 1900s, individuals had a hard time paying for their hospital stays. In 1929, a group of teachers at Baylor University in Dallas, Texas paid $6 per year to cover up to 21 days of hospital care (Niles, 2016). This program was the start of Blue Cross. Cost of care contributed to insurance's foundations in the 1930s, but a meteoric rise in health insurance coverage was just around the corner and had less to do with the cost of care and more to do with workforce employment during World War II.
combination, the three policies brought employer sponsored coverage from 9.3% of the population in 1940 to more than 50% in 1950 (Carroll, 2017).
Employer sponsored health insurance also provided an impetus for a national health plan. Ellen Beck (2003) of United Press International framed it like this:
The U.S. Census showed the population above age 65 in the United States had grown to 12 million [in 1950] from 3 million in 1900. Two-thirds of older Americans had incomes less than $1,000 annually and only 1 in 8 had health insurance–which was becoming difficult to obtain because insurance companies saw the elderly as illness-prone and a poor risk. By 1963 the number of elderly was at 17.5 million and the cost of hospital care was increasing by 6.7 percent annually.
While Americans still argue whether healthcare is a “luxury” or a “right”, I think the
development of employer sponsored healthcare significantly impacted the nation’s
perspective. It does not make sense for the healthiest and wealthiest in society to be
protected from healthcare’s financial challenges when the most vulnerable populations
cannot afford care.
It is important to note that this wave of employment-based health insurance, which covers about half of the United States population today, was not designed to build a better healthcare system and, in fact, occasionally fosters some perverse incentives.3
Healthcare is a long-term investment; the health practices of a patient today–exercise, diet, and medication–affect the health outcomes several decades from now. Fang and Gavazza (2011), who studied dynamic inefficiencies in an employment-based health insurance system, suggest, "Labor turnover and labor market frictions prevent an employer-employee pair from capturing the entire surplus from investment in an
3 It’s important to note that very few systems in business today were “designed” and any system will likely
employee's health. Thus, the pair under-invests in health during working years, thereby increasing medical expenditures during retirement." Medicare or other employers subsequently bear the cost of poor health maintenance during an individual's working years. The evolution of employer-based health insurance is a prime example of how a key characteristic of our health system was not designed for better health at all.
The Biopharma Industry was Shaped by Regulation
The challenges of the biopharma industry are far too vast and complex to summarize in a few paragraphs. Instead, I want to highlight a similar a trend that the structure of the drug industry is a result of a few key non-health-related events, like reactionary politics, scientific discoveries, patent laws, and capital availability.
First, I want to note that the business model in the drug industry is challenging and constantly changing. One fact that I believe is representative of the industry’s business model complexity is this: in 2016, 89% of all prescriptions dispensed in the United States were filled with a generic drug, but those generic prescriptions accounted for only 26% of total drug costs (“Introduction to the Generic Drug Supply Chain and Key Considerations for Policymakers,” n.d.). Today, the process to develop a drug from discovery to market takes around 10 years and $1 billion. Thus, the revenue from branded drugs, which make up only 11% of total prescriptions, is used to recoup the entire cost of developing those drugs (along with the failed drugs and the cost of capital), funding the development of new drugs and financing the marketing and promotion costs.4 The history
of the biotechnology and pharmaceutical industries largely shaped this business model
4 Generic manufacturers, on the other hand, spend their capital proving bioequivalence, taking on legal risk
of challenging weak brand patents, and competing with other generic manufacturers in supplier
for branded drugs, which continues to receive scrutiny from policymakers, providers, and patients alike.
One of the key cost drivers in the market is the enormous amount of regulation. But, the industry did not always face these hurdles. Until the United States began
implementing stringent regulations in the early 20th century, traveling salesmen often sold
“medicine” next to snake oil, and used remarkably little science. I’ve listed some examples of some of healthcare’s most pivotal regulations; of note, each regulation is
reactive, demonstrating our vulnerability to a single emotionally challenging event and the reactive nature of politics. The result of these reactive regulations is a biopharma business model that has been under fierce scrutiny.
1904: Upton Sinclair exposed the horrible standards of the United States meat industry in his book, The Jungle (U.S. Food and Drug
Administration, 2018). In response, congress passed the 1906 Food and Drug Act, which required disclosure of ingredients in a product and started identifying some drugs as illegal (like cocaine) (U.S. Food and Drug Administration, 2018).
1937: An untested pediatric drug had a toxic chemical–essentially antifreeze–that killed over 100 children (U.S. Food and Drug
Administration, 2018). In response, congress passed the Food, Drug and Cosmetic Act of 1938, which required proof of safety through clinical trials and labeled directions for safe use.
Kavaufer-Harris Act of 1962. The act required drugs to show safety and efficacy, report adverse events, and added a serious amount of federal oversight to clinical trials (U.S. Food and Drug Administration, 2012).
By raising the barriers to entry, the United States’ regulations essentially eliminated the small, hustling drug makers and allowed the old, successful, resource-rich companies to survive and stomp out (or acquire) the competition. Thus, one challenge of the
biopharma business model is promoting competition where there are such high–and often necessary–barriers to entry.
While industry regulations have led to challenging competitive dynamics and a blockbuster-style business model, Scott Stern (2009) suggested that the historical success of the business model can also be traced to a few key drivers: scientific discoveries, institutional support, and capital availability. Throughout the 20th century, researchers
have made timely discoveries; insulin in the 1920s, penicillin in the 1940s, recombinant DNA technology in the 1970s, and now CRISPR technologies today have led to Nobel Prizes for scientists and billions in profit. These discoveries would not have been possible without the support of university researchers. The Bayh-Dole Act of 1980 allowed scientists, universities, and companies to receive patents on products from research that was funded by the government (Rosenthal, 2017); from that moment on, "researchers saw themselves not only as scientific researchers, but also managers, entrepreneurs, and, more recently, investors as well" (Sánchez-Serrano, 2011, p. 210) and committed time and energy to developing new therapies. Finally, the emergence of many biopharma
development possible in a highly-restrictive regulatory environment. Arguably, all three drivers–scientific discoveries, institutional support, and capital availability–are required
for the biopharma business model to make sense in an environment of stringent regulations.
Medicare’s “Technological Imperative” Promotes New and More Care
Finally, I believe Medicare’s technological imperative is the fuel that keeps the healthcare pipeline running. Sharon Kaufman (2015), author of Ordinary Medicine, identifies four “invisible controlling factors” in the healthcare system. They are the unseen forces that are rarely debated on the 24-hour news cycle, yet they govern the actions of organizations throughout the system. The four forces, with some of those key decisions makers highlighted, are listed below (Kaufman, 2015, p. 7).
1. The initial driver is the biomedical research industry and its mushrooming clinical trials engine, which is churning out evidence of effective therapies at an unprecedented rate.
2. The committees that determine Medicare and private insurance payment policies evaluate that evidence to determine whether the therapy, device, or procedure in question should be reimbursable. If it is, physicians will
prescribe it, insured patients will have access to it, and patients and families will want it.
4. Finally, once therapies become standard, they also become ethically necessary and therefore difficult, if not impossible, for physicians, patients and
families to refuse.
Since the 1980s and 1990s, United States healthcare has shifted culturally towards Evidence-Based Medicine (EBM), or the “proactive and transparent application of the best published scientific research findings about medical treatments” (Kaufman, 2015, p. 53). Government officials, policymakers, practitioners, consumers, and insurance
companies wanted an organized, reliable way to trust the safety and effectiveness of new therapies. So now, medical developers play the game: if they can demonstrate improved outcomes with evidence-based clinical trials, the industry often has a moral and ethical obligation (or desire) to choose that therapy over those currently available.
Medicare plays a major part in the drivers above, largely because of its original principles. Medicare has two important provisions fundamental to the program: first, pay for the healthcare of elderly people, and, second, make decisions about care independent of price. Legal professor Jacqueline Fox (2005) argues Congress has no guidance on how to deal with extremely expensive, but medically effective technology. The vague
reimbursement decisions from CMS, Medicare laid the groundwork for an explosion of scientific research and development over the next half century:
Discoveries and implementation of beneficial, but costly new medical
technologies are said to occur because of exogenous positive advances in science. Once the science behind a product or service has been discovered, medical care providers and payers have no alternative but to bring that discovery to the market, prescribe the use of it, and pay for the price charged. (Pauly & Isen, 2009, p. 75) In other words, “build it and they will come” took on a whole new meaning. A culture of EBM, an economic and political commitment to uphold the agreement to cover medical care for the elderly, and a moral decision to cover the most advanced technology has led to the escalation of healthcare costs. While politicians can argue about whether states or the federal government should bear the risk of Medicaid costs, I believe patients and practitioners should focus on the true driving forces behind the very complex system.
******
The United States healthcare system was not designed, but rather evolved. Each individual player has individual incentives and weighs financial, political, social, and ethical motivations differently. When making judgements about the future of the
markets–whether predicting a fundamental change or expecting trends to prevail–we have to understand the context and incentives of each stakeholder. How might the biopharma pipelines behave in periods when there is a high cost of capital given their current business model? Or if the age to receive Medicare was raised to 67, how might
II. LITERATURE REVIEW
In this literature review, I describe the situation background, including an overview of financial risk in healthcare and the history of Medicare. I then identify findings from several key studies concerning Medicare’s impact on patients, payers, and technological development. Finally, I close by recognizing a gap in the current literature and describing how this research can contribute to the conversation about incentives in healthcare.
Situation Overview
Congress passed Medicare and Medicaid as a way to absorb out-of-pocket healthcare costs for the elderly and poor. Researchers suggest the welfare gain from the reduction in risk exposure may have been sufficient to cover half or three-quarters of the program costs (Finkelstein & McKnight, 2005). In doing so, however, Medicare also absorbed some level of risk for a variety of players in the healthcare industry. Hospitals, physicians, and drug and device manufacturers could suddenly develop and deliver services confidently due to predictable cash flows from Medicare and Medicaid’s reimbursement. This thesis recognizes the mechanics of financial risk as it applies to the relationship between CMS and healthcare companies.
Financial Risk
coordination of care, and more (Quinn, 2015). The financial risk–that is, the potential liability from increasing costs or benefit from decreasing costs–shifts between payer and provider, depending on the model for reimbursement.
All healthcare providers fall on a financial risk spectrum based on their unit of payment, even pharmaceuticals and clinical studies. Health economist Kevin Quinn (2015) developed a framework, recreated in Table 1, that describes each unit of payment. On one end of the spectrum, payers absorb all the financial risk when payment is based on what theprovider charges. If the cost of service, number of visits, or even the markup on services increase, the payer absorbs the entire increase in cost. On the other end of the spectrum, providers absorb all the risk when payment is based on a budget or salary. If the cost of service or number of particularly expensive episodes increase, the provider absorbs the cost. Between the two ends of the spectrum, payers and providers share certain aspects of risk in a variety of payment units.
History of Medicare: Effects of Shifting Financial Risk
On July 30th, 1965 at the Truman Presidential Library, President Lyndon Johnson
hundreds of ads in newspapers condemning them (Fox, 2005). Our current
reimbursement structures, coding, and classifications in Medicare are a product of negotiations with and concessions to the AMA.5 In turn, perverse incentives for
healthcare professionals sometimes encourage more, rather than better, care.
To be clear, research does not suggest that money drives the clinical decisions of healthcare providers, but rather payment methods have a clear effect on whether care is provided, how it is provided, and how much of it is provided. For example, Clemens and Gottlieb (2017) found that financial incentives significantly influence physicians' supply of healthcare: “When patients are well insured, so that demand-side constraints are unlikely to bind, physician discretion becomes an important driver.” As an example, in the eight years after Medicare moved from a per dollar of charges to per service for physician services, spending per beneficiary “grew more than twice as fast as spending for other services and was driven entirely by growth in volume” (Quinn, 2015).
Therefore, while payment structure is not the primary determinant in healthcare decisions, Medicare’s reimbursement structure has a pervasive influence on provider practices.
Over the past 40 years, Medicare’s payment structure has changed in reaction to escalating costs from providers. Since 1983, Medicare has shifted financial risk to the providers in 11 of 13 major payment structure reforms (Quinn, 2015). Table 2 outlines these reforms. This thesis examines how changes in Medicare and Medicaid–including changes in payment structure–affect company valuations. I hope to clearly link the
5 For example, the Relative Value Update Committee, a committee run by the AMA, still unofficially
Table 1:Common Payment Methods to Healthcare Providers
Note: Recreated from “The 8 Basic Payment Methods in Health Care,” by Kevin Quinn, 2015, Annals of Internal Medicine, 136, p. 301
Table 2: Medicare Initiatives to Change Basic Payment Methods
Unit of Payment Common Name Examples (Common Classification Systems)
1. Per time period Budget, Salary Salaried physicians and government hospitals
2. Per beneficiary Capitation Managed care organizations (ACG, CDPS, CMS-HCC,
CRG, and DxCG)
3. Per recipient Contact capitation Physician specialist services
4. Per episode Case Rates, payment per
stay, and bundled payments
Hospital inpatient (DRG), physician surgeries (RBRVS), home health care (HHRG), and multiple providers
5. Per day Per diem and per visit Nursing facilities (RUG), hospital outpatient (EAPG),
and ambulatory surgical centers (APC)
6. Per service Fee-for-service Physicians services (RBRVS), hospital outpatient (APC),
dentists, medical equipment and supplies, and drugs
7. Per dollar of cost Cost reimbursement Critical Access hospitals, government-owned
providers, and nursing facilities
8. Per dollar of charge Percentage of charges Any provider type
Year Provider Type Prior Method New Method Classification System for New Method
1983 Hospital inpatient 7. Per dollar of cost 4. Per episode DRG
1984 Clinical laboratory 8. Per dollar of charges 6. Per service CLFS
1992 Physician 8. Per dollar of charges 6. Per service RBRVS
1997 Critical access hospital 4. Per episode 7. Per dollar of cost
1998 Nursing facility 7. Per dollar of cost 5. Per day RUG
2000 Hospital outpatient 7. Per dollar of cost 6. Per service APC
2000 Home health care 7. Per dollar of cost 4. Per episode HHRG
2002 Long-term care hospital 7. Per dollar of cost 4. Per episode LTC-DRG
2002 Rehabilitation facility 7. Per dollar of cost 4. Per episode CMG
2002 Ambulance 8. Per dollar of charges 6. Per service
2005 Psychiatric hospital 7. Per dollar of cost 5. Per day
2008 Ambulatory surgical center 5. Per day 5. Per day APC
2012 ACO 4. Per episode
6. Per service
Note: Recreated from “The 8 Basic Payment Methods in Health Care,” by Kevin Quinn, 2015, Annals of Internal Medicine, 136, p. 301
State of Research
Researchers have studied a variety of topics on patient behavior, private insurance structure, and technological development in relation to Medicare and insurance. In this section, I identify key studies that characterize some of the economic incentives.
Patients
The RAND Experiment (Manning, Newhouse, Duan, Keeler, & Leibowitz, 1987; Aron-Dine, Einav, & Finkelstein, 2013), one of the largest and most significant studies in the history of health insurance, confirmed the notion that healthcare has some level of price elasticity for patients. The randomized controlled trial proved that increased cost sharing6 reduced both “inappropriate or unnecessary” and “appropriate or needed”
medical care (Manning et al., 1987). The RAND Health Insurance Experiment pioneered moral hazard research in the healthcare context and provided a framework for
understanding why individuals consume more or less healthcare. Einav and Finkelstein (2017) found similar results in studying ex post moral hazard. Ex post moral hazard is the scenario where, regardless of health status, a person is more likely to receive health care if the cost is low. For that reason, many argue meaningful healthcare reforms start with individual responsibility and is driven by patient behavior.
Private Insurance
As mentioned in the introduction, the history of private insurance has a significant impact on its behavior today. Employment-based health insurance–deemed a “wartime accident” (Mihm, 2017)–poses a significant challenge in preventative care: "Employee
turnover leads to an inefficiently low level of investment in employees’ health… because future employers capture part of the surplus generated from the current investment in the employee’s health. Hence, the employer-employee pair does not internalize the full social surplus created by the current investment in the employee’s health." (Fang & Gavazza, 2011). The employer, therefore, is unlikely to own the long-term financial risk of a beneficiary because of job turnover. The resulting underinvestment in preventative care during working years adds to the challenges of poor health among Medicare
beneficiaries. The financial risk of future liability or benefit appears to play a key role in the practices of private insurance.
Technology
Okunade & Murthy (2002) found that healthcare technology–tests, drugs, treatments, devices–is a major force behind rising healthcare costs. Medicare’s original language stated the program covers treatments that are “reasonable and necessary.” One could argue that the “reasonable and necessary” clause has led to technological
imperative in healthcare, that is, an obligation to reimburse the most advanced (and often most expensive) technologies:
Discoveries and implementation of beneficial, but costly new medical technologies are said to occur because of exogenous positive advances in science. Once the science behind a product or service has been
discovered, medical care providers and payers have no alternative but to bring that discovery to the market, prescribe the use of it, and pay for the price charged. (Pauly & Isen, 2009, p. 75)
obligation to reimburse the treatment, and it fairly quickly becomes a clinical standard among providers.
Goals for Research
III. METHODOLOGY
Over the past 50 years, several key pieces of United States legislation have fundamentally changed the structure of the healthcare industry. The 1965 establishment of Medicare, the 1983 Social Security Amendments, and the 1996 Health Insurance Portability and Accountability Act (HIPAA) exemplify laws that altered the structure of payments and practices in health care. The impact of these laws extends beyond the payer-provider relationship; structural changes to Medicare, Medicaid and federal programs reverberate throughout the healthcare value chain to companies in industries like pharmaceuticals, clinical trials, billing, collections, and research. This thesis aims to better understand how changes to Medicare and Medicaid have historically affected the various players in the value chain in order to better predict how policy changes in the future will affect company valuations.
Throughout this section of the thesis, I explain the methods used to analyze the question. First, I describe event studies and their academic foundation, then I outline my process for identifying events, statistical analysis, and grouping returns, and I close by identifying limitations of the methodology.
Event Studies
variables" (Event Study Research Application, 2018). Event studies have been used in hundreds of published studies, with dozens of papers researching the statistical properties of the method; according to Kothari & Warner (2006), event studies are a mature and respected analysis in financial and economic research. This thesis uses event study analysis to assess the market's reaction to various legislative or judicial events in healthcare, especially those impacting Medicare and Medicaid.
Event study analysis assumes the efficient market theory such that "when information arises, the news spreads very quickly and is incorporated into the prices of securities without delay” (Malkiel, 2003). For the analysis to yield a significant response in the case of a piece of United States legislation, the market must have some level uncertainty that the bill will pass; under the efficient market theory, the effects of legislation are priced into valuations only to the extent that the market believes the bill will pass. Given a non-zero probability that the government will fail to sign a bill into law, the market should react to the passage of a bill. This market reaction–good or bad–is a reflection of the perceived impact of a bill on a specific company. By grouping event studies, I assess how legislation affects various industries and company characteristics within the healthcare value chain.
Identifying Events
The public process of United States legislation makes determining a specific market reaction to laws challenging. The life cycle of a bill is often long, beginning with its introduction in the House and Senate or earlier. Committee consideration, chamber debate, and amendment exchange often mold the details, and therefore the impact, of a bill over time. To make matters more difficult, a Presidential veto or ruling on
constitutionality from the Supreme Court can change the impact after the bill passes Congress. The challenge is determining the best window of time that the market is reacting to a bill’s impact: Passage in congress? Presidential approval? Introduction in a chamber? The probability of a bill's passage is specific to historical context. Factors including party majorities, political environment, and even judicial positioning (like in the case of the Affordable Care Act) can affect the likelihood of signing a bill into law. Therefore, I will carefully select legislation using three qualifying factors:
Prior to the event, there is some level of uncertainty whether the bill will pass or fail
There is an identifiable event date when the market can reasonably assume the bill will pass or fail
The event occurred between 2008 and 2018 to best reflect modern market reactions
high level of uncertainty and represent a key “tipping point” at which the market knows the bill will pass. The events I chose for analysis are listed in Table 3.
Table 3: Estimation, Observation, and Event Dates for Analysis
Event Description Estimation Window Begins (-330) Observation Window Begins (-30) Event Date (0) Observation Window Ends (+30)
Supreme Court upholds certain parts of the
Affordable Care Act 3/9/2011 5/16/2012 6/28/2012 8/10/2012
2016 Elections established a republican-majority Congress, Donald Trump as President, and several key state votes
7/22/2015 9/28/2016 11/9/2016 12/22/2016
The Medicare Access and CHIP Reauthorization
Act of 2015 (MACRA) passes the Senate 12/18/2013 3/2/2015 4/14/2015 5/27/2015
Documents from Trump’s drug price working group release notes and the Senate unveils their bill to repeal and replace the ACA
12/5/2011 2/15/2013 4/2/2013 5/14/2013
Statistical Analysis
All statistical procedures in this thesis are derived from Professor David Ravenscraft’s course on Mergers and Acquisitions at Kenan-Flagler Business School (2018). Event studies try to capture the market’s reaction to a specific event, independent of the overall market; this is considered the “abnormal return” related to the event.
Event studies begin by calculating the estimated correlation between the market return and the return on an individual stock. I use an estimation window of 330 days prior (-330) to an event through 31 days prior (-31) to an event. The estimation window is used in a regression analysis to determine the intercept ( and slope (), R-Squared, and Standard Error over the period. See Appendix B for an example of the correlation
Equation 1: Expected Return of Individual Stock Given Market Return
Rit = iRmt + i (1)
Where:
i = an individual firm t = time (daily)
Rit = individual firm stock return at time t
Rmt = S&P 500 stock return at time t
i= Estimate of the correlation between the individual firm’s return and the market
return over the estimation period
i= Average above market return over the estimation period
The observation window is the period of time when I project the expected return of the firm based on the markets return. I use a 61-day window from 30 days prior (-30) to an event through 30 days after (30) an event. The event window is a range of time around the date of an event that the market could be pricing in the effects of the event. I use the formula above to predict what the expected return for an individual stock would be on a given day based on the market returns for that day. Any deviation from this projected return is considered the “abnormal return.” The formula for abnormal returns is listed below.
Equation 2: Abnormal Return of an Individual Stock on a Given Day
ARit = Rit - (iRmt + i) (2)
Where:
ARit = Individual firm’s abnormal returns at time t
Rit = Individual firm’s returns at time t
i = Systematic risk of the firm over the estimation window
Rmt = Market return at time t
i = Risk-adjusted performance of a firm over the estimation window
a measure of the strength of the relationship between the firm’s daily returns and market’s daily returns; a high R-squared indicates the stock’s return is primarily
correlated to movements in the market. For this study, I have excluded any stock that has an R-squared value less than 0.05. Standard error is another regression statistic that measures the variability in the sample data; I find a firm’s daily t-statistic by dividing the daily abnormal return by the firm’s standard error from the estimation period:
Daily T-Statistic = Daily Abnormal Return
Standard Error of the Regression
The cumulative abnormal return, or CAR, is a sum of the significant abnormal returns over the event window. I use symmetric event windows of 3 (-1 to 1), 5 (-2 to 2), and 11 (-5 to 5) days around the event date and a t-statistic significance of 1.96 to
measure cumulative abnormal returns. In a more advanced model, the event windows would likely differ for each company, based on the relevant news around the event; I focus mostly on the 3-day window in order to limit firm-specific news that skews the returns. The sum of the abnormal returns with a t statistic of greater than 1.96 is considered the abnormal return for the event window.
creation even when the event is partly priced in. For the purposes of this thesis, however, I plan to assess companies on a ternary scale to identify events as "positive," "negative," or "insignificant" for the company. By grouping companies into industries, I analyze whether legislative or policy changes are positive, negative, or insignificant for an industry. Images of the Excel model I have developed is shown in Appendix I.
While I have only analyzed four events in this model (listed in Table 3), I have tested over 20 additional events for cross-industry impacts. Other events include Midterm Elections, Medicare announcements about data releases, President Trump comments and Tweets, and legislation such as the 21st Century Cures Act. I also tested for various event
dates for each healthcare change. For example, I tested dates including John McCain’s famous thumbs down vote on the Better Care Reconciliation Act and the passage of the Affordable Care Act in Congress in 2010. While some of these events were somewhat surprising to markets, most of the changes to value were priced in at the time of the event and predictable. The events I chose in this study demonstrate clear abnormal returns from which I was able to demonstrate patterns of industry behaviors.
Identifying Companies
Each firm has several qualifying factors in order to be considered in the analysis. First, the firm is currently a publicly traded company in the Wharton Research Data Services Center for Research in Security Prices (CRSP) database7 and operate all or most
business in the United States according to Capital IQ. I then selected firms with the highest market capitalization in each industry in order to ensure analyst coverage. I selected a max of 10 firms from each industry with a market capitalization of at least $500 million. This selection should accurately reflect most market sentiments.
Limitations
I foresee several potential limitations to the event study methodology. The first regards the validity of market reactions. The market’s reaction to legislation incorporates the perceived changes to valuation in the industry, not the actual long-term impact on earnings. For the purpose of this thesis, I only focus on short-term value impacts with the expectation that, more often than not, the market is betting on the long-term impact of a bill. I also should note that in a standard event study analysis, the researcher will make a judgement about whether abnormal returns are associated with the event or not. I chose to exclusively use the 3-, 5-, and 11-day windows symmetric to the event date to compare the company returns (with most of the emphasis on the 3-day returns) to limit overly subjective decisions. Researchers could add subjective analysis in a variety of ways to refine the current study, such as adjusting the event window each individual company or changing or including returns that are close to statistical significance.
IV. RESULTS
Throughout the results section, I hope to provide high-level analysis of four different events relating to healthcare markets. The analysis is meant to be an exploration in understanding how and why we see company valuations change in an event study analysis. In order to accurately explain the market’s reaction, I describe some of the factors that may have contributed.
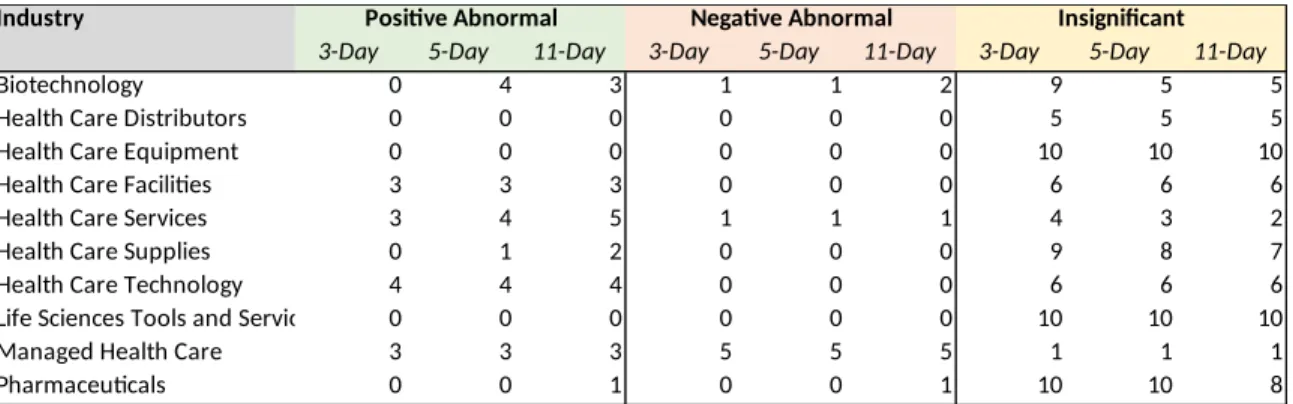
6/28/2012 – Supreme Court Upholds Parts of the Affordable Care Act
Table 4: 6/28/2012 Count of Companies with Abnormal Returns by Industry and Event Window
Industry Positive Abnormal Negative Abnormal Insignificant
3-Day 5-Day 11-Day 3-Day 5-Day 11-Day 3-Day 5-Day 11-Day
Biotechnology 0 4 3 1 1 2 9 5 5
Health Care Distributors 0 0 0 0 0 0 5 5 5
Health Care Equipment 0 0 0 0 0 0 10 10 10
Health Care Facilities 3 3 3 0 0 0 6 6 6
Health Care Services 3 4 5 1 1 1 4 3 2
Health Care Supplies 0 1 2 0 0 0 9 8 7
Health Care Technology 4 4 4 0 0 0 6 6 6
Life Sciences Tools and Services 0 0 0 0 0 0 10 10 10
Managed Health Care 3 3 3 5 5 5 1 1 1
Pharmaceuticals 0 0 1 0 0 1 10 10 8
The Nature of the Affordable Care Act and the Supreme Court Case
In March 2010, President Obama enacted the Patient Protection and Affordable Care Act (ACA) (Summary of the Affordable Care Act, 2013). The bill intended to:
Expand Coverage – broadened Medicaid, allowed kids to stay on parents’
plans until age 26, and developed exchanges for the individual and small group market
Improve Coverage – closed the Medicare “donut hole” coverage gap and
added some transparency protocols to the insurance industry
Reform Delivery of Care/Reduce Costs – focused on quality, integration,
and prevention; Center for Medicare and Medicaid Innovation played a major role
Affordable Care Act: those who qualified for Medicaid and those who were eligible for exchanges. Provisions in the Affordable Care Act did not have a major impact on private/ employer-provided healthcare plans (except potentially the “Cadillac Tax”) or Medicare Plans (except for closing the donut hole and some Medicare Advantage cost containment protocols) (Glied & Strier, 2016; Kovner, 2012).
While most ACA provisions did not go into effect until January 1, 2014, the expected impact of those provisions were likely priced into market valuations prior to that date. Based on contextual research and best judgement, I found the Supreme Court Case, NFID v. Seblius to be the point when the markets most likely determined ACA provisions were guaranteed or nearly guaranteed to go into effect. In November 2011, the Supreme Court agreed to hear the case brought by 26 states and National Federation of Independent Business.8 On June 28, 2012, Chief Justice Roberts delivered the opinion of
the court, which was made up of five conservative and four liberal justices. In a surprise to many, the court upheld key parts of the ACA like the individual mandate and rejected the constitutionality of certain Medicaid expansion provisions.
The individual mandate is a requirement for individuals to purchase health insurance or else suffer a financial penalty, or “shared responsibility payment,” payable to the IRS. The court ruled this is within Congress’ power to tax (Musumeci, 2012). The court, however, rejected the state Medicaid expansion provision, which would have cut all federal Medicaid funds to states if the state did not raise the Medicaid threshold: “Seven justices voted that the threatened denial of all federal Medicaid funds to states that would not join in the significant expansion of Medicaid eligibility was so coercive as
to constitute a form of duress that violated the states’ sovereignty and dignity” (Fried, 2013). Therefore, the decision from the Supreme Court set a precedent for federal government coercion of states and policies around mandating individual insurance.
Market Reactions to NFID v Seblius
Companies with large exposure to Medicaid and fee-for-service payment
structures appear to have benefited from the decision to uphold parts of the ACA. The bill was still expected to increase the insured population, which fares well for companies which operate on a fee-for-service basis; more patients equals more product or service sales (Tharp & Celarier, 2012). Table 4 shows that industries with the fee-for-service model like facilities, technology, and services fared well.
Non-Medicaid-focused payers were some of the hardest hit in the healthcare industry: “Many of the ACA provisions have led health payers to spend more on
covering medical services among the sickest populations while hospitals and emergency care providers no longer have to manage nearly as much uncompensated care due to Medicaid expansion and the individual mandate” (Gruessner, 2016). We can see the reaction to headwinds for managed care in the abnormal returns for companies like Unitedhealth Group, Anthem, and Cigna Corporation.
Summary
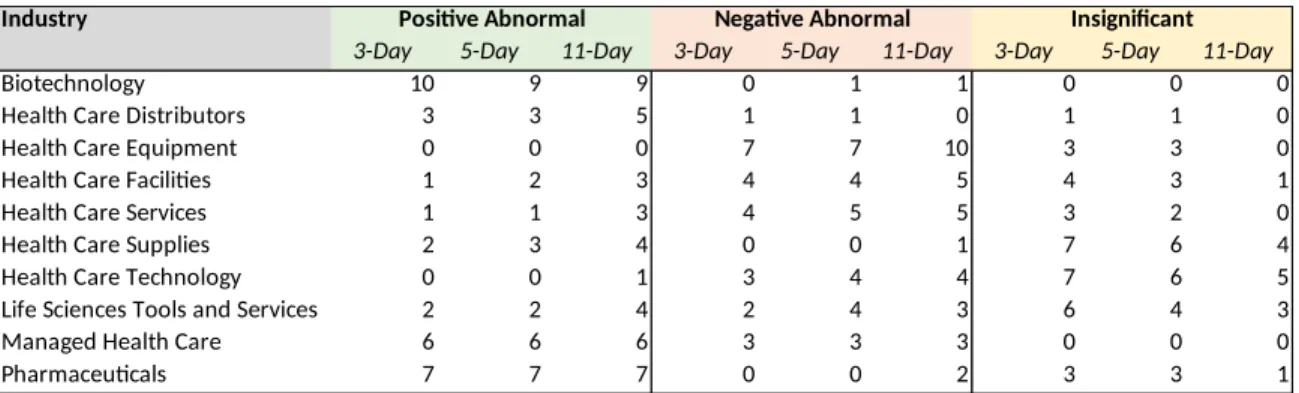
11/9/2016 – 2016 Presidential Election and State Ballots
On the morning of election day in 2016, Hillary Clinton had a 71.4% change of winning the United States Presidential Election, according to FiveThirtyEight (Silver, 2016). On the day after the 2016 election, the S&P 500 rose 1.1%, likely in part due to the market’s long-awaited certainty of who would be President. The healthcare industry had a rollercoaster of a day, with abnormal returns throughout; industries like
biotechnology and pharmaceuticals almost universally soared, many healthcare service providers struggled, and managed care providers had a mixed bag of returns, depending on each company’s individual customer concentration/type. What makes the 2016
election so interesting is that the abnormal returns could have been caused by a variety of factors, including a relative easing of drug pricing pressures, anticipated scaling back of the Affordable Care Act, and even anticipated repatriation and tax benefits. Appendix F includes the full table of abnormal returns by company, and Table 5 includes a summary of positive, negative, and insignificant abnormal returns by industry.
Table 5: 11/9/16 Count of Companies with Abnormal Returns by Industry and
Event Window
Industry Positive Abnormal Negative Abnormal Insignificant
3-Day 5-Day 11-Day 3-Day 5-Day 11-Day 3-Day 5-Day 11-Day
Biotechnology 10 9 9 0 1 1 0 0 0
Health Care Distributors 3 3 5 1 1 0 1 1 0
Health Care Equipment 0 0 0 7 7 10 3 3 0
Health Care Facilities 1 2 3 4 4 5 4 3 1
Health Care Services 1 1 3 4 5 5 3 2 0
Health Care Supplies 2 3 4 0 0 1 7 6 4
Health Care Technology 0 0 1 3 4 4 7 6 5
Life Sciences Tools and Services 2 2 4 2 4 3 6 4 3
Managed Health Care 6 6 6 3 3 3 0 0 0
Relative Easing of Drug Pricing Pressures
During the campaign, both Trump and Clinton made a variety of remarks
regarding drug prices. As seen in the market reaction to the 2016 election, it appears the pharmaceutical and biotechnology industries benefited from a Trump Presidency and Republican Congress, potentially suggesting less stringent drug pricing policies than a Clinton Presidency.
Another key outcome from the 2016 election was California’s vote to turn down a ballot initiative that would reign in drug prices. Proposition 61, or the California Drug Price Relief Act, intended to limit state health programs from paying more than the United States Department of Veterans Affairs (VA), which has some of the largest discounts in the country (Beasley, 2016). The vote represented a huge win for the drug industry, and largely demonstrated the power of the biotech and pharma lobby which spent millions to campaign against the proposition. The election set a precedent for other states considering negotiated and discounted rates from drug companies; the drug
industry’s lobbying efforts sent a message that they were not going down easily.
Anticipated Scaling Back of the Affordable Care Act
Medical equipment (MDT, BDX, SYK) and technology (CERN) that typically use a fee-for-service model and rely heavily on hospital populations also struggled.
Managed care was also heavily impacted by abnormal returns, but the nature of each company’s book of business again dictated the market’s movements. Those heavily exposed to Medicaid (MOH, WCG, CNC) faced significant negative returns. Companies that served other managed care organizations or seek to optimize risk and decision making to reduce costs (HQY, MGLN) benefited. For the big private insurers like UnitedHealth Group, Humana, Anthem, and Cigna, the Trump Presidency potentially represented fewer regulatory pressures and greater control over their risk portfolios.
Repatriation and Tax Reform
Pharmaceutical and, to some extent, biotechnology companies are known for holding large amounts of earnings abroad. If they wanted to bring that money back to the US, they would have to pay the United States corporate tax rate on it, which was 35% prior to the election. During the campaign, however, Trump suggested a one-time special tax of 10% on any repatriated overseas earnings. This was a huge win for international firms like Pfizer, Johnson and Johnson, Amgen, and Gilead (LaMotta, 2016).
Summary
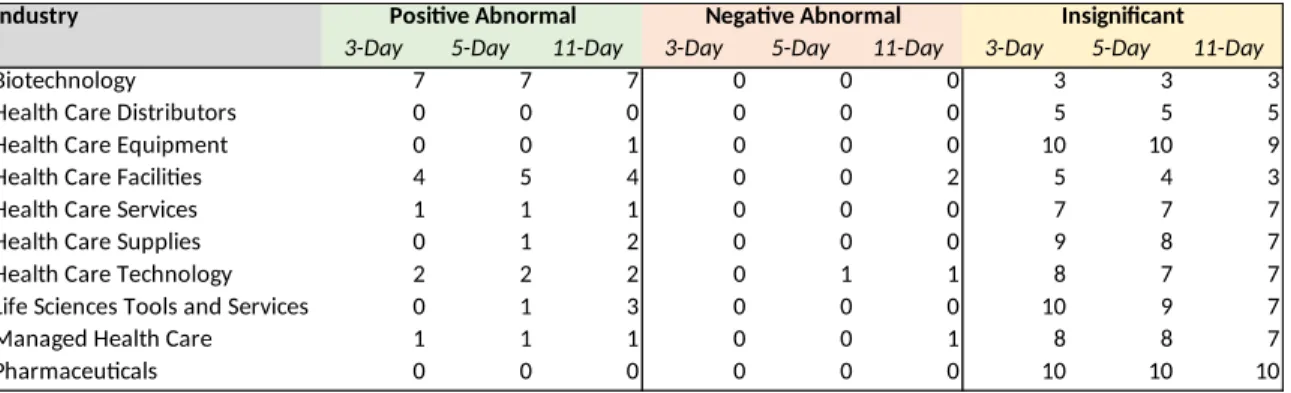
6/22/2017 – Drug Pricing Documents and Senate Health Bill
On June 22, 2017, two significant events occurred in healthcare. First, documents were released from Trump’s “Drug Pricing and Innovation Working Group,” and second, the Senate revealed the Better Care Reconciliation Act (BCRA), their version (technically an amendment) of the American Healthcare Act of 2017 (AHCA). Both documents–the BCRA and the working group’s notes–were seen as more moderate than originally expected, and a variety of companies appear to have benefited. Appendix G includes the full table of abnormal returns by company, and Table 6 includes a breakdown of positive, negative, and insignificant abnormal returns by industry.
Table 6: 6/22/2012 Count of Companies with Abnormal Returns by Industry and Event Window
Industry Positive Abnormal Negative Abnormal Insignificant
3-Day 5-Day 11-Day 3-Day 5-Day 11-Day 3-Day 5-Day 11-Day
Biotechnology 7 7 7 0 0 0 3 3 3
Health Care Distributors 0 0 0 0 0 0 5 5 5
Health Care Equipment 0 0 1 0 0 0 10 10 9
Health Care Facilities 4 5 4 0 0 2 5 4 3
Health Care Services 1 1 1 0 0 0 7 7 7
Health Care Supplies 0 1 2 0 0 0 9 8 7
Health Care Technology 2 2 2 0 1 1 8 7 7
Life Sciences Tools and Services 0 1 3 0 0 0 10 9 7
Managed Health Care 1 1 1 0 0 1 8 8 7
Pharmaceuticals 0 0 0 0 0 0 10 10 10
Drug Pricing and Innovation Working Group
released in June, proposals from the discussion largely left drug companies unharmed. Vinay Prasad, professor of medicine at Oregon Health and Sciences university, said, “This six-page document contains the kind of solutions to the cost-of-drugs problem that you would get if you gathered together all the executives of pharma and asked them ‘What sort of token gestures can we do?’” (Kopp, 2017).
At the time of writing (February 2019), Congress and the President have
motioned toward more stringent policies around drug pricing. At a Congressional hearing with top drug company executives on February 26, 2019, there was bipartisan criticism of pricing practices of the companies. Many expect Trump or Congress to pass some form of drug pricing legislation in the coming months (Grant, 2019).
The Better Care Reconciliation Act
In the summer of 2017, Congress drafted two bills to repeal or modify provisions of the Affordable Care Act. The American Healthcare Act (AHCA) originated in and passed the House, and The Better Care Reconciliation Act (BCRA) originated in the Senate and failed to pass (Mach, 2017). The provisions of these bills were fairly similar, so going forward, I will talk about the BCRA, which was hotly debated and eventually failed to pass Congress due to controversial votes and last-minute changes.
The BCRA and AHCA aimed to repeal and replace the Affordable Care Act, but also make some fundamental changes to Medicaid. Provisions from the BCRA include (Rudowitz, Antonisse & Musumeci, 2017):
Phasing out the enhanced federal financing for the ACA Medicaid
expansion; states would be faced with a tradeoff between increasing revenues, cutting Medicaid, or reducing other state spending
Limiting federal Medicaid funding through a per capita, or per enrollee,
cap on financing; under the ACA, Medicaid provides a guarantee of coverage for individuals who are eligible for the program and a guarantee to states of federal matching dollars for Medicaid spending, but this program would limit federal Medicaid funding to states to a per enrollee cap
Providing HHS Secretary discretion to adjust the per enrollee spending
down for states with per enrollee spending 25% higher than the national average
Allowing states the option to choose block grant financing for nonelderly/
non-disabled traditional adults (low income parents and pregnant women) and/or adults eligible through the ACA Medicaid expansion
Providing HHS Secretary discretion to allocate funds to address the opioid
crisis and public health emergencies
BCRA’s per enrollee cap, when the number of enrollees increase, the federal government absorbs the cost, but states bear the risk of increased cost of care. And under the block grant system, states bear the entire risk of increased enrollment and increased costs.
Market Reactions to the BCRA
On June 22, 2017, the analysts deemed that, in comparison to the AHCA, the Senate’s bill was much less stringent in the short term, and much more stringent in the long term (Graham, 2017). Why does this matter? Healthcare legislation is often a product of the current administration’s platform; spending cuts or additions several years down the road are more likely to be postponed or altered under another Congress or President. In other words, the bill that the Senate put forth on June 22, 2017 was far less stringent than the market had anticipated because the fundamental changes were not set to come into effect until several years down the road, at which point a new Congress or President could completely change the policies.
The market knew that the Senate would be unveiling a bill at some point during the summer of 2017, so the range of possible outcomes all included some form of Republican-led healthcare bill. Based on the news sources reporting on the unveiling of the bill, I believe the market expected a far more comprehensive bill with immediate impacts. While the BCRA did reverse many of the Obamacare provisions, the impact of those reversals was pushed to a future date several years down the road; that left the door open to changing Congressional majorities and Presidents to potentially repeal or
Summary
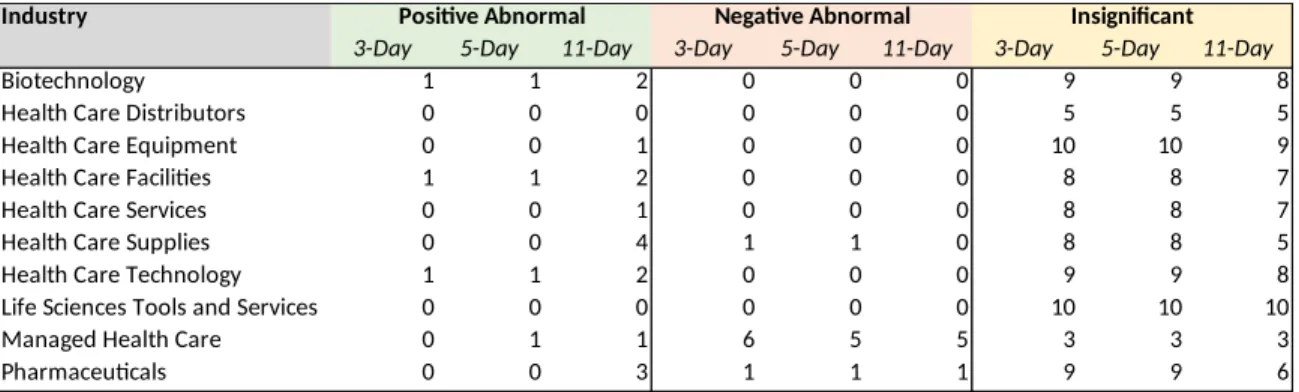
4/14/2015 – Medicare Access and CHIP Reauthorization Act of 2015
The Medicare Access and CHIP Reauthorization Act of 2015 (MACRA) ended the exercise of physician fee schedule payment fixes, and the market showed little reaction. Perhaps the market did not react because this fee schedule, called the
Sustainable Growth Rate (SGR), was often postponed by Congress anyways (Medicare Physician Payment Overhaul Bill Becomes Law, 2015). The Sustainable Growth Rate, enacted in 1997, intended to substitute medical inflation with the general inflation for physician fee schedules in an attempt to cut costs. MACRA permanently repealed the SGR payment reductions and instituted two tools in increase quality (Rose, n.d.): Merit Based Incentive System (MIPS) and Alternative Payment Models (APMs).
Performance Payment Systems
APMs apply to providers in Accountable Care Organizations (ACOs) who assume downside risk; if the ACO achieves a threshold of revenue derived from APMs, the providers in the network will receive a 5% bonus on Medicare charges (Rose, n.d.).
If a provider is not a part of a qualifying ACO, it will be assigned to MIPS evaluation. MIPS evaluates quality of services relative to peers. MIPS is essentially a zero-sum game and funds itself; providers who perform above the mean of peers will receive a bonus, while providers who perform below the mean incur financial penalties (both as a percentage of Medicare payments) (Rose, n.d.).
Surprisingly, as one of the more fundamental shifts in Medicare reimbursement policies over the past decade, MACRA had little to no impact on markets. Appendix H includes the full table of abnormal returns by company, and Table 7 includes a
Table 7: 4/14/15 Count of Companies with Abnormal Returns by Industry and Event Window
Industry Positive Abnormal Negative Abnormal Insignificant
3-Day 5-Day 11-Day 3-Day 5-Day 11-Day 3-Day 5-Day 11-Day
Biotechnology 1 1 2 0 0 0 9 9 8
Health Care Distributors 0 0 0 0 0 0 5 5 5
Health Care Equipment 0 0 1 0 0 0 10 10 9
Health Care Facilities 1 1 2 0 0 0 8 8 7
Health Care Services 0 0 1 0 0 0 8 8 7
Health Care Supplies 0 0 4 1 1 0 8 8 5
Health Care Technology 1 1 2 0 0 0 9 9 8
Life Sciences Tools and Services 0 0 0 0 0 0 10 10 10
Managed Health Care 0 1 1 6 5 5 3 3 3
Pharmaceuticals 0 0 3 1 1 1 9 9 6
Market Reaction
The market does not appear to have reacted to the passage of the bill. Managed care stocks had abnormal returns in the event windows, but those are likely due to earnings and forecasts from Unitedhealth Group (Brino, 2015).
As I’ve mentioned previously, little to no market reaction could mean one of three things: 1) the expected impact of the bill has already been priced in, 2) the expected impact is not yet known and therefore not priced in, or 3) the bill has no expected impact. As mentioned in the introduction, physician services are the second largest expenditure for United States healthcare at $694 billion (Center for Medicare and Medicaid Services, 2017). But, it is important to remember that SGR had been postponed by Congress for several years, and the consensus could have been that a bill like MACRA and MIPS was inevitable. Without knowledge of individual physician financials, it is challenging to tell how the event impacted the markets.
Summary
V. CONCLUSION AND FURTHER RESEARCH
In the introduction of this thesis, I talked about how the development of
components of the healthcare industry shaped many of the industry dynamics that we see today. In the literature review, I walked through some of risk taking and reimbursement methods that are at the foundation of these industry dynamics. The key takeaway was that healthcare risk is a tradeoff between payers and providers, and the ownership of risk is typically determined by the manner in which a company is reimbursed. In the
methodology, I outlined how I assess value creation or destruction given certain changes in Medicare and Medicaid policies. And in the discussion, I examined four events to show that instances of value creation and destruction can often be explained by the ownership of risk or the absorption or unloading of risk. In concluding, I identify prerequisites for event study analysis, comment on some observations about the relationship between CMS and company valuations in the future, and close with opportunities for further research.
The use of event study analysis can be useful, but only under certain
abnormal returns in event study analysis may not be an indication that an event had an insignificant impact on value, but rather that it was priced in over time, potentially like the MACRA legislation. Finally, and perhaps most importantly, abnormal returns are the result of events that surprise market consensus; understanding market consensus and expectations is essential to understanding how and why company valuations react in a given manner.
Based on this research, I have developed several observations about the healthcare industry:
Medicare and Medicaid are primary levers the federal and state
governments use to impose change on the healthcare industry.
Healthcare costs are growing at an unsustainable rate, and the United
States government is likely to take action.
Medicare and Medicaid are likely to limit health expenditures using
methods like reimbursement practices, potentially moving from fee-for-service to quality performance measures or capitation/salary.
When that change comes, companies with high exposure to Medicaid and
Medicare are likely to be most impacted.
However, the concentration risk from Medicaid and Medicare is likely
The key takeaway is to understand each company’s unique risk exposures
in both the intermediate and long term time horizons due to the constantly changing health policy environment.
Appendix A
Comparison between Medicare and Medicaid
Medicare Medicaid
Medicare is a national program administered by the Federal government, comprising:
Part A – Hospital Insurance Inpatient
hospital, inpatient skilled nursing facility, hospice, and some home health services
Part B – Medical Insurance Physician
services, outpatient care, durable medical equipment, home health services, and many preventive services
Part C – Medicare Advantage (MA)
Medicare-approved private insurance companies that provide all Part A and Part B services and may provide prescription drug coverage and other supplemental benefits
Part D – Prescription Drug Benefit
Medicare-approved private insurance companies that provide outpatient prescription drug coverage
Medicaid is a network of Statewide programs administered by State governments following broad national guidelines established by Federal statutes, regulations, and policies.
Health care coverage for:
People 65 or older
People with certain disabilities
People diagnosed with end-stage renal
disease (ESRD)
Health care coverage for:
Low-income adults Pregnant women
Children Eligibility varies from
State to State Medicare is the nation’s largest payer of
inpatient hospital services for the elderly and people with ESRD.
Medicaid is the nation’s largest payer of mental health services, long-term care services, and births. Medicaid pays for 40 percent of all births.
Appendix B.1
Example of Event Study Regression from Excel Model
-5.00% -4.00% -3.00% -2.00% -1.00% 0.00% 1.00% 2.00% 3.00% 4.00% 5.00%
-8.00% -6.00% -4.00% -2.00% 0.00% 2.00% 4.00% 6.00% 8.00%
f(x) = 0.933429714626098 x − 0.000430869101197 R² = 0.309119858336421
S&P 500 vs CERN Correlation Chart During Estimation
Window 7/22/2015-9/27/2016
CERN Returns
S&
P
R
et
u
rn
Appendix B.2
Appendix C
Company characteristics according to S&P Cap IQ, as of 1/19/2019
Company Name Exchange Ticker Market Capitalization
($USDmm, Historical rate) Primary Industry
Agilent Technologies, Inc. (NYSE:A) NYSE A $22,912.10 Life Sciences Tools and Services AbbVie Inc. (NYSE:ABBV) NYSE ABBV $134,627.40 Biotechnology
AmerisourceBergen Corporation (NYSE:ABC) NYSE ABC $16,925.00 Health Care Distributors Abbott Laboratories (NYSE:ABT) NYSE ABT $125,437.30 Health Care Equipment Acadia Healthcare Company, Inc. (NasdaqGS:ACHC) NasdaqGS ACHC $2,558.50 Health Care Facilities Allergan plc (NYSE:AGN) NYSE AGN $54,040.00 Pharmaceuticals Align Technology, Inc. (NasdaqGS:ALGN) NasdaqGS ALGN $17,603.80 Health Care Supplies Alexion Pharmaceuticals, Inc. (NasdaqGS:ALXN) NasdaqGS ALXN $26,113.50 Biotechnology Amedisys, Inc. (NasdaqGS:AMED) NasdaqGS AMED $4,053.70 Health Care Services Amgen Inc. (NasdaqGS:AMGN) NasdaqGS AMGN $129,916.30 Biotechnology Anthem, Inc. (NYSE:ANTM) NYSE ANTM $68,829.80 Managed Health Care athenahealth, Inc. (NasdaqGS:ATHN) NasdaqGS ATHN $5,510.90 Health Care Technology Baxter International Inc. (NYSE:BAX) NYSE BAX $37,585.10 Health Care Equipment Becton, Dickinson and Company (NYSE:BDX) NYSE BDX $65,229.00 Health Care Equipment Biogen Inc. (NasdaqGS:BIIB) NasdaqGS BIIB $67,984.30 Biotechnology
Bio-Rad Laboratories, Inc. (NYSE:BIO) NYSE BIO $7,172.00 Life Sciences Tools and Services Brookdale Senior Living Inc. (NYSE:BKD) NYSE BKD $1,501.90 Health Care Facilities BioMarin Pharmaceutical Inc. (NasdaqGS:BMRN) NasdaqGS BMRN $17,394.90 Biotechnology Bristol-Myers Squibb Company (NYSE:BMY) NYSE BMY $81,819.10 Pharmaceuticals Boston Scientific Corporation (NYSE:BSX) NYSE BSX $52,155.50 Health Care Equipment Cardinal Health, Inc. (NYSE:CAH) NYSE CAH $14,614.00 Health Care Distributors Celgene Corporation (NasdaqGS:CELG) NasdaqGS CELG $60,409.60 Biotechnology Cerner Corporation (NasdaqGS:CERN) NasdaqGS CERN $17,812.10 Health Care Technology Chemed Corporation (NYSE:CHE) NYSE CHE $4,547.70 Health Care Services Cigna Corporation (NYSE:CI) NYSE CI $74,186.90 Managed Health Care Centene Corporation (NYSE:CNC) NYSE CNC $26,107.00 Managed Health Care The Cooper Companies, Inc. (NYSE:COO) NYSE COO $13,274.40 Health Care Supplies CVS Health Corporation (NYSE:CVS) NYSE CVS $84,730.40 Health Care Services Quest Diagnostics Incorporated (NYSE:DGX) NYSE DGX $11,843.70 Health Care Services Danaher Corporation (NYSE:DHR) NYSE DHR $75,312.00 Health Care Equipment DaVita Inc. (NYSE:DVA) NYSE DVA $9,522.50 Health Care Services Encompass Health Corporation (NYSE:EHC) NYSE EHC $6,576.80 Health Care Facilities The Ensign Group, Inc. (NasdaqGS:ENSG) NasdaqGS ENSG $2,126.50 Health Care Facilities Evolent Health, Inc. (NYSE:EVH) NYSE EVH $1,461.90 Health Care Technology Edwards Lifesciences Corporation (NYSE:EW) NYSE EW $35,206.00 Health Care Equipment Gilead Sciences, Inc. (NasdaqGS:GILD) NasdaqGS GILD $89,492.60 Biotechnology Haemonetics Corporation (NYSE:HAE) NYSE HAE $5,216.00 Health Care Supplies HCA Healthcare, Inc. (NYSE:HCA) NYSE HCA $46,303.40 Health Care Facilities HMS Holdings Corp. (NasdaqGS:HMSY) NasdaqGS HMSY $2,482.00 Health Care Technology HealthEquity, Inc. (NasdaqGS:HQY) NasdaqGS HQY $3,819.40 Managed Health Care Henry Schein, Inc. (NasdaqGS:HSIC) NasdaqGS HSIC $12,088.30 Health Care Distributors Humana Inc. (NYSE:HUM) NYSE HUM $40,547.00 Managed Health Care ICON Public Limited Company (NasdaqGS:ICLR) NasdaqGS ICLR $7,249.80 Life Sciences Tools and Services ICU Medical, Inc. (NasdaqGS:ICUI) NasdaqGS ICUI $4,878.30 Health Care Supplies Illumina, Inc. (NasdaqGS:ILMN) NasdaqGS ILMN $45,974.30 Life Sciences Tools and Services Incyte Corporation (NasdaqGS:INCY) NasdaqGS INCY $16,688.40 Biotechnology
Appendix C (Cont.)
Company characteristics according to S&P Cap IQ, as of 1/19/2019
Company Name Exchange Ticker Market Capitalization
($USDmm, Historical rate) Primary Industry Medtronic plc (NYSE:MDT) NYSE MDT $117,247.90 Health Care Equipment Magellan Health, Inc. (NasdaqGS:MGLN) NasdaqGS MGLN $1,512.10 Managed Health Care Merit Medical Systems, Inc. (NasdaqGS:MMSI) NasdaqGS MMSI $2,939.10 Health Care Supplies Molina Healthcare, Inc. (NYSE:MOH) NYSE MOH $8,544.80 Managed Health Care Merck & Co., Inc. (NYSE:MRK) NYSE MRK $197,290.60 Pharmaceuticals
Mettler-Toledo International Inc. (NYSE:MTD) NYSE MTD $15,079.60 Life Sciences Tools and Services Mylan N.V. (NasdaqGS:MYL) NasdaqGS MYL $15,257.50 Pharmaceuticals
Neogen Corporation (NasdaqGS:NEOG) NasdaqGS NEOG $3,149.90 Health Care Supplies Nektar Therapeutics (NasdaqGS:NKTR) NasdaqGS NKTR $7,996.50 Pharmaceuticals Omnicell, Inc. (NasdaqGS:OMCL) NasdaqGS OMCL $2,679.10 Health Care Technology Patterson Companies, Inc. (NasdaqGS:PDCO) NasdaqGS PDCO $2,081.20 Health Care Distributors Pfizer Inc. (NYSE:PFE) NYSE PFE $245,843.60 Pharmaceuticals
PerkinElmer, Inc. (NYSE:PKI) NYSE PKI $9,611.10 Life Sciences Tools and Services PRA Health Sciences, Inc. (NasdaqGS:PRAH) NasdaqGS PRAH $6,604.70 Life Sciences Tools and Services Quidel Corporation (NasdaqGS:QDEL) NasdaqGS QDEL $2,084.50 Health Care Supplies Regeneron Pharmaceuticals, Inc. (NasdaqGS:REGN) NasdaqGS REGN $45,287.10 Biotechnology Select Medical Holdings Corporation (NYSE:SEM) NYSE SEM $2,032.70 Health Care Facilities Stryker Corporation (NYSE:SYK) NYSE SYK $62,695.10 Health Care Equipment Teladoc Health, Inc. (NYSE:TDOC) NYSE TDOC $4,373.20 Health Care Technology Tenet Healthcare Corporation (NYSE:THC) NYSE THC $2,253.90 Health Care Facilities Thermo Fisher Scientific Inc. (NYSE:TMO) NYSE TMO $96,884.00 Life Sciences Tools and Services Universal Health Services, Inc. (NYSE:UHS) NYSE UHS $12,208.60 Health Care Facilities UnitedHealth Group Incorporated (NYSE:UNH) NYSE UNH $255,420.10 Managed Health Care U.S. Physical Therapy, Inc. (NYSE:USPH) NYSE USPH $1,381.60 Health Care Facilities Veeva Systems Inc. (NYSE:VEEV) NYSE VEEV $15,406.30 Health Care Technology Vertex Pharmaceuticals Incorporated (NasdaqGS:VRTX) NasdaqGS VRTX $49,757.10 Biotechnology