ARTIGO ORIGINAL
PRAdA Intervention: Effects on Weight of
Dietary Intervention among Treated
Hypertensive Portuguese Natives and African
Immigrants
Intervenção PRAdA: Efeitos no Peso Induzidos por Proposta de Alteração de
Comportamento Alimentar em Hipertensos Medicados Nativos Portugueses e
Imigrantes de Origem Africana
1. Unidade de Epidemiologia. Instituto de Medicina Preventiva. Faculdade de Medicina de Lisboa. Lisboa. Portugal. 2. Instituto Nacional de Saúde Doutor Ricardo Jorge. Lisboa. Portugal.
Recebido: 10 de Setembro de 2013 - Aceite: 24 de Janeiro de 2014 | Copyright © Ordem dos Médicos 2014
Catarina PEIXOTO1, Gisela CARRILHO1, Violeta ALARCÃO1, Filipa GUERRA1, Rui SIMÕES1, Milene FERNANDES1,
Paulo NICOLA1, Sofia GUIOMAR1,2, Paulo NOGUEIRA1, Evangelista ROCHA1 Acta Med Port 2014 May-Jun;27(3):331-341
RESUMO
Introdução: Perdas de peso melhoram o controlo da tensão arterial em indivíduos hipertensos. As intervenções comportamentais
para a perda de peso parecem ser menos eficazes nos imigrantes de origem africana (IOA). Os principais objetivos foram avaliar os efeitos no peso de uma intervenção alimentar em hipertensos nativos de origem portugueses (NOP) e IOA; identificar fatores de sucesso na perda de peso; avaliar a evolução dos conhecimentos e adesão às recomendações alimentares.
Material e Métodos: Foram selecionados aleatoriamente hipertensos medicados seguidos nos cuidados de saúde primários para
um estudo de duas fases, observacional (15 meses) e de intervenção comportamental (seis meses). Os participantes foram divididos em dois grupos: IOA e NOP. Foram dadas recomendações alimentares e de estilos de vida em sessões individuais presenciais e telefónicas.
Resultados: Dos 110 participantes, com IMC médio de 31,6 ± 3,7 kg/m2 e idade média 61,3 ± 10,0 anos, 60 eram imigrantes. Durante
a intervenção os NOP perderam 1,4 ± 2,7% do peso e os IOA 0,8 ± 3,6%, sendo a perda superior comparativamente com a fase ob-servacional. Ser do sexo masculino e consumir pelo menos duas porções de lacticínios magros por dia associou-se a maior perda de peso durante a intervenção, independentemente da idade e origem. Houve um aumento significativo no número de recomendações dietéticas conhecidas e cumpridas, com os NOP a cumprirem em média mais recomendações.
Discussão: A intervenção foi bem sucedida relativamente à perda de peso, especialmente no grupo dos NOP, confirmando outros
estudos.
Conclusão: A intervenção aumentou os conhecimentos e adesão às recomendações, realçando a pertinência da educação alimentar,
culturalmente adaptada, nos cuidados de saúde primários.
Palavras-chave: África; Emigrantes e Imigrantes; Estudos de Intervenção; Hábitos Alimentares; Hipertensão; Perda de Peso; Portugal.
ABSTRACT
Introduction: Blood pressure is significantly improved with weight loss. Behavioral interventions for weight loss seem to be less suc-cessful in African immigrants. Our main aims were to assess the effect of a dietary and lifestyle intervention on weight among hyper-tensive Portuguese natives and immigrants and to identify success factors for weight loss, and also to evaluate changes in knowledge and compliance with food recommendations.
Material and Methods: Hypertensive medicated patients followed in primary care setting were randomly enrolled in a two phase study, observational (15-months) and behavioral intervention (six months). Participants were divided in two groups: immigrants from African Countries of Portuguese Official Language and Portuguese natives. Participants were given dietary and life styles recommendations in individual face-to-face and telephone sessions.
Results: Of 110 participants with a mean BMI of 31.6 ± 3.7 Kg/m2, 60 were immigrants. The number of dietary recommendations known
and followed at the end was significantly greater than at baseline; however natives performed a greater number of recommendations. Weight loss during intervention was in average 1.4 ± 2.7% in natives and 0.8 ± 3.6% in immigrants and was greater than in the obser-vational period. Being male and consuming more than 2 servings of low-fat dairy products/day was associated with higher weight loss, independently of age and ethnicity.
Discussion: In general the proposed intervention was efficacious especially in Portuguese natives, confirming other studies. Conclusion: The intervention increased knowledge and adherence to recommendations, highlighting the relevance of nutrition educa-tion, culturally adapted in primary care.
Keywords: Africa; Emigrants and Immigrants; Intervention Studies; Food Habits; Hypertension; Weight Loss; Portugal.
INTRODUCTION
Lifestyle modifications that effectively reduce blood pressure (BP) include weight loss for overweight or obese people, low-sodium consumption, moderate alcohol consumption, a healthy and balanced diet, with fruit and vegetables, low-fat dairy products consumption,1 as well as
smoking cessation2 and physical activity.3,4 Amongst these,
a healthy nutrition plan is therefore a determinant factor in reducing cardiovascular risk in hypertensive patients.1
Several cardiovascular risk factors, including hypertension, have a different effect on black and white patients.5 International studies show that black patients,
when compared to other ethnic groups, are the most
35
35 ano
s a p
rom
ov
er
as
ciê
DI
CA
P
ORT
UGUE
SA
ARTIGO ORIGINAL vulnerable to the effects of hypertension, with a higher prevalence, severity and risk of early-onset hypertension.6
In addition, when weight-loss behaviour programs are assessed, these seem to be less efficient in the latter group of patients.7,8
The results of the Trial Of Non-pharmacologic interventions in the Elderly (TONE), performed on treated overweight hypertensive patients, showed that when these were divided according to white or black ethnicity the average weight loss at six months was 5.9 and 2.7 kg respectively.7
Other studies with similar interventions obtained lower weight reductions in black women when compared to black men and to whites.8,9
In Portugal, from 341,313 legal immigrants, 21.6% are from Portuguese-speaking countries (PALOP - Países
Africanos de Língua Oficial Portuguesa).10 According
to data from the fourth 2005/06 National Health Report
(Inquérito Nacional de Saúde), hypertension is one of
the most frequently self-reported chronic disorders from immigrant communities (13.1% for immigrants and 18.6% for Portuguese nationals).11 In Portugal, there are no
studies comparing the efficacy of nutritional and lifestyle interventions on weight reduction in native-born Portuguese (NBP) versus immigrants of ethnic African origin (IAO) and furthermore, overweight prevalence data in ethnic minorities is scarce.
Socio-economic determinants, including obstacles to healthcare service access are becoming increasingly relevant for the understanding of the relationship between immigration and health vulnerability.12-14
Some Portuguese studies on weight loss have shown that the number of previous weight loss attempts, self-motivation, body image perception and an initial focus on diet are successful short-term weight loss predictors while the change of intrinsic motivational factors (like being pleased with physical activity practice, for example) has a more important role in long-term weight control.15 These data
support the need and relevance of nutritional interventions in immigrant populations, particularly those with higher cardiovascular risk and an evaluation of the differences in response to interventions, based on ethnic origin.
The PRAdA (Proposta de Alteração da Alimentação em duas populações distintas: hipertensos medicados imigrantes e não-imigrantes dos cuidados de saúde primários
da região de Lisboa e Vale do Tejo – Recommendation for
Nutritional Change in two different populations: immigrant and non-immigrant patients with medicated hypertension attending Lisbon area primary healthcare units) study aimed to assess an intervention on BP control and improvement of nutritional awareness and practice. Our study’s main objective was to evaluate the effect of the intervention on the weight of participants from both groups. The secondary objectives were to identify success factors in weight loss in both groups and to assess the acquired awareness and compliance as regards nutritional recommendations, at the end of the intervention.
MATERIAL AND METHODS
Our study included an initial observational phase aimed to characterise nutritional recommendation awareness, nutritional habits and lifestyles of participants, followed by a six-month stage aimed to assess BP control and weight loss through nutritional and lifestyle changes. IAO group
included participants born in one of the PALOP (Cape Verde, Saint Tomé and Príncipe, Mozambique, Angola and Guinea-Bissau) and with an African ethnic origin. NBP were defined as born in Portugal and of white descent. The participants were randomly included from the list of users of four primary healthcare units from the Lisbon region, selected by convenience for the study. Our inclusion criteria defined participants following anti-hypertensive medication, aged between 40 and 85 years of age, with a clinical diagnosis of hypertension and registered in one of the selected Healthcare Centres (CS, Centros de Saúde) or Family Healthcare Units (USF, Unidades de Saúde
Familiar), Subjects had to be reachable by phone, with a
home address recorded in database and could not be under the supervision of a Nutritionist or Dietitian for weight loss or BP control. Our study’s participants were overweight and their inclusion in the intervention stage was based in a selection made over the observational stage in keeping with the baseline criteria.
After an initial contact through a letter sent by mail, the participants were contacted by telephonic interview in order to complete an eligibility questionnaire. Those eligible participants who accepted to participate in the study were invited to attend an initial visit for the single purpose of data collection (observational stage). A subsequent visit was requested for the interventional stage of the study. Both visits took place at the patient´s CS/USF and at all visits written informed consent was obtained.
This project was approved by the Ethics Committee of the Lisbon Faculty of Medicine and of the Regional Health Administration Department (Lisboa and Vale do Tejo) and was authorized by the National Commission for Personal Data Protection.
Observational Stage
The observational stage involved a 30-minute in-person interview including anthropometric data collection (weight, height, waist circumference [WC]), BMI, BP, a nutritional and sodium profile, as well as a calculation of alcohol and tobacco consumption and physical activity. Weight variation between the observational interview and the first interview from the interventional stage were subsequently compared along the intervention.
Intervention
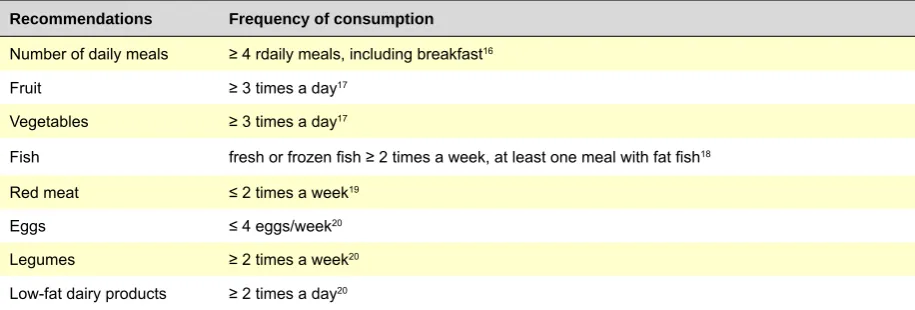
Over a six-month timeframe, the intervention involved three individual 1-hour duration in-person sessions (0, 3 and 6 months) and two mid-term telephone follow-up interviews (at 1.5 and 4.5 months). The interviews were conducted by dietitians. On the first in-person session, after data collection for initial characterisation, general recommendations on healthy nutrition were provided16-20 (Table 1) together with
an information leaflet.
A moderate 30-minute physical activity program on most of the days was encouraged,20, smokers were advised to
stop21 and compliance and reinforced recommendations
were assessed in subsequent interviews.
Data collection and variables
ARTIGO ORIGINAL
adequately controlled when the systolic BP was <140mmHg and the diastolic <90mmHg.22 Waist circumference (WC)
was measured at a level midway between the last floating rib and the upper margin of the iliac crest. Weight was obtained with a digital scale and the height measured with a stadiometer, according to anthropometric measurement protocols defined in other studies.23 Values were recorded
and rounded to the nearest decimal (0.1 kg/cm).
BMI was calculated applying the formula: BMI = Body weight (kg) / Height2 (m) and the participants were
subsequently divided in the categories recommended by the WHO (World Health Organization) for adults.24 Due
to the heterogeneity in the ageing population (>65) as regards the BMI25,26 a Nutritional Screening Initiative (NSI)
classification which is dependent on gender and age was used for participants aged above 65.27
Participants were classified as presenting a risk of development of metabolic complications when levels of WC were above 88cm for women and 102cm for men.28
Food consumption profile was assessed through the application of a questionnaire of food habits and lifestyles, including the following parameters: number of meals, breakfast intake, vegetables, fruit, legumes, fish, meat and low-fat dairy consumption, food habit related to salt consumption, alcohol and tobacco consumption, physical activity profile.
Sodium intake was estimated through a food frequency questionnaire for evaluation of 19 groups of sodium-rich foods (≥ 500 mg sodium/100g food). The estimated consumption was divided by 0.8, as previous studies show that 80% of sodium intake comes from processed foods and food consumed away from home.29 This should be taken
into account for a more rigorous estimation of daily sodium intake, allowing for its comparison to the recommended target (< 1,500 mg of sodium per day).20
Excessive daily alcohol consumption was defined as above two drinks in men and one in women (> 30 g and > 15 g of ethanol, respectively).17 The participants were defined
according to physical activity recommendation when they practiced 150 minutes of moderate to intense physical activity (> 3METs)30 per week and/or 60 minutes of vigorous
physical activity (> 6METs) per week.31,32 Walking was not
considered as a moderate physical activity due to the fact that participants described a level-walk of low intensity. Inadequate food safety was defined as a limited or uncertain availability of nutritionally adequate and safe foods
or a limited or uncertain availability to obtain acceptable foods under a socially acceptable fashion.33 In order to
assess inadequate food safety situations in the participant’s family, a translated and adapted ERS/USDA questionnaire on food safety was used.34
Clinical and socio-demographic characteristics were recorded in a purpose-designed questionnaire.
Statistical Analysis
A descriptive analysis aimed to determine socio-demographic characteristics of our group of participants, as a whole and for each group. Central tendency and dispersion measures were calculated and both groups were compared using χ2 tests for categorical variables and
Student t-test for continuous variables.
McNemar tests were used for categorical variables and paired Student t-tests and Wilcoxon tests were used to evaluate the changes between baseline and the end of the study. A 5% significance level was considered for all tests. The association between the different variables and the percentage of weight change was tested using simple linear regression models.
A univariate analysis was used for the identification of weight loss associated factors. Those with a significance level below 20% were considered independent variables in a multiple linear regression analysis.35 All multiple models
were adjusted for gender and age and the Statistical Package for Social Sciences (SPSS) software for Windows, version 20.0, was used.
RESULTS
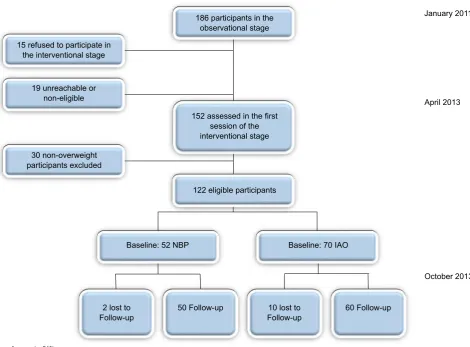
From the 186 participants involved on the observational stage and contacted for the intervention stage, 15 did not accept to participate, 19 were not eligible as they were followed by a dietitian, were not compliant with anti-hypertensive medication or not reachable. On the first interview of the intervention stage, 152 participants were assessed, from which 30 were excluded as they were not overweight. Follow-up was lost for 12 participants, due to a change in the place of residence (including moving to the country of origin), loss of contact, withdraw from the study and death (Fig. 1).
From the 110 participants who completed the intervention, 60 were IAO (71.7% female) and 50 NBP (58.0% female). The participants from the IAO group were living in Portugal for on average 24.38 ± 11.75 years.
Table 1 - Nutritional recommendations in the PRAdA study
Recommendations Frequency of consumption
Number of daily meals ≥ 4 rdaily meals, including breakfast16
Fruit ≥ 3 times a day17
Vegetables ≥ 3 times a day17
Fish fresh or frozen fish ≥ 2 times a week, at least one meal with fat fish18
Red meat ≤ 2 times a week19
Eggs ≤ 4 eggs/week20
Legumes ≥ 2 times a week20
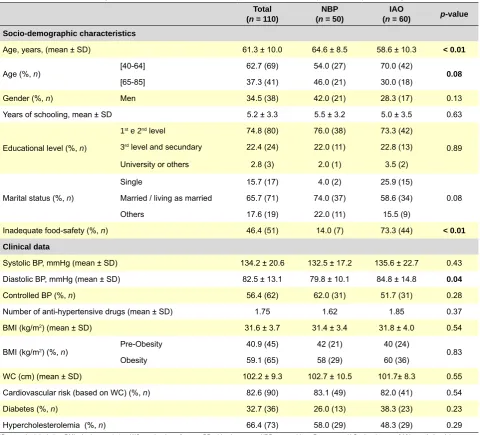
ARTIGO ORIGINAL Regarding the educational level, 74.8% had only attended to the first or second school level (Table 2), without any statistically significant difference between both groups. We also found that most of the participants were married or lived in a marital union (65.7%). NBP participants were on average 6 years older than IAO.
At the beginning of the study, diastolic BP values were, on average, 5 mmHg higher in the IAO group (p < 0.05). We did
not find any statistically significant difference between both groups regarding systolic BP, number of anti-hypertensive drugs or self-reported diabetes or hypercholesterolemia. The average BMI was 31.6 kg/m2 and 59.1% of the
participants were obese, with no significant differences between the groups. We found that most IAO participants lived in an inadequate food-safety family situation (73.3%) when compared to 14.0% in the NBP group (p < 0.01).
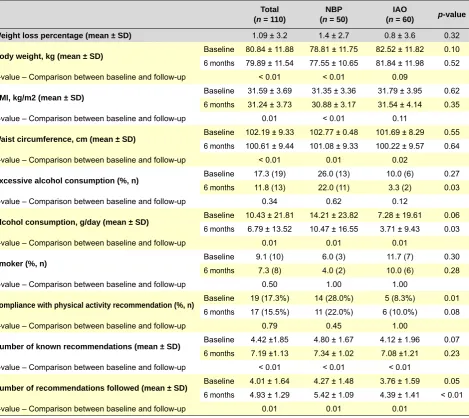
Table 3 shows the results of the intervention. Regarding weight (0.95 kg) and BMI variation (0.35 kg/m2) along the
intervention, these were globally significant although, when analysing by the defined group, weight loss was only significant for the NBP group (p < 0.001). In addition, the
reduction of WC was statistically significant as a whole and in both groups.
Regarding excessive alcohol and tobacco consumption and physical activity profile, there were no statistically significant differences between baseline and the end of the study.
We found that only 17.3% of the participants (n = 19) met
the recommendation of physical activity at the beginning of the study (Table 3), with a predominance in the NBP group (28.0% vs. 8.3%, p = 0.01).
Our group of participants presented a baseline average alcohol consumption of 10.43 ± 21.81 g/day which was reduced by 3.64 g along the study. Baseline alcohol consumption in NBP group was on average 6.93 g higher than in IAO group, a difference that remained similar at the end of the intervention.
Regarding awareness and compliance with nutritional recommendations, we found a statistically significant increase in the average number of known nutritional recommendations and a higher compliance rate, as a whole and in both groups.
However, when comparing both groups, the IAO group had a lower compliance (p <0.01) at baseline and at the end
of the intervention than the BNP group.
The progression of the proportion of participants that showed awareness and compliance with each of the individual recommendations is shown in the Fig.2.
We found at the end of the intervention an increased proportion of participants aware and complying with the nutritional recommendations, except for the recommendation regarding egg consumption, which all participants had already followed at baseline.
In order to assess the efficacy of the intervention, the
Figure 1 - Flow chart
Compliance rate: 91%
NBP – Native-Born Portuguese; IAO – Immigrants of ethnic African Origin
January 2011
April 2013
October 2013 186 participants in the
observational stage
152 assessed in the first session of the interventional stage 15 refused to participate in
the interventional stage
19 unreachable or non-eligible
30 non-overweight participants excluded
122 eligible participants
Baseline: 52 NBP
2 lost to
Follow-up 50 Follow-up Follow-up10 lost to 60 Follow-up
ARTIGO ORIGINAL
percentage of weight lost by the same participants between the observational visit (January 2011) and at the beginning of the intervention (April 2012) was compared to the percentage of weight loss during the interventional stage. The average percentage of monthly weight loss was 0.04% at the observation stage and 0.17% over the six-month intervention, i.e., there was an additional 0.13% effect of weight loss attributed to the intervention (p = 0.04).
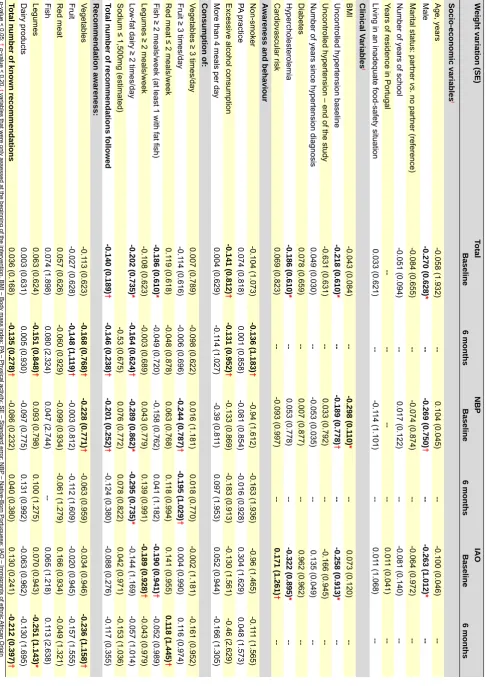
Factors related to weight loss on both groups
Bivariate analysis between participant’s characteristics and the percentage of weight variation on both populations are shown on Table 4. We found a higher weight loss in male participants, as a whole and for each group. Participants of both groups with baseline uncontrolled hypertension showed a tendency to a higher weight loss. In the NBP group, we found a direct relationship between baseline BMI and weight loss during the intervention. Regarding clinical variables, the IAO group presented a significant association between the presence of dyslipidemia and higher weight loss. Regarding
awareness and compliance of nutritional recommendations, we did not find any significant association with weight loss, except regarding the daily consumption of at least three fruit servings and at least two low-fat dairy products servings, as well as baseline awareness of recommendations regarding vegetable consumption in the NBP group. Regarding compliance and awareness of nutritional recommendations, we found an association between daily consumption ≥ 2 servings of low-fat dairy products and weight loss at six-months’ follow-up.
Factors independently related to weight loss on both groups
The results of multiple linear regression models for all participants and for each subgroup are shown in Table 5. Gender showed to be a predictive factor for weight loss and weight loss percentage was statistically higher in men (p = 0.01), as a whole. Low-fat dairy products baseline
consumption ≥ 2 times/day was shown to be associated to a higher global percentage of weight loss (p = 0.01).
Table 2 - Baseline socio-demographic and clinical characteristics of participants in the study, total and by ethnic origin
Total (n = 110)
NBP (n = 50)
IAO
(n = 60) p-value
Socio-demographic characteristics
Age, years, (mean ± SD) 61.3 ± 10.0 64.6 ± 8.5 58.6 ± 10.3 < 0.01
Age (%, n) [40-64] 62.7 (69) 54.0 (27) 70.0 (42) 0.08
[65-85] 37.3 (41) 46.0 (21) 30.0 (18)
Gender (%, n) Men 34.5 (38) 42.0 (21) 28.3 (17) 0.13
Years of schooling, mean ± SD 5.2 ± 3.3 5.5 ± 3.2 5.0 ± 3.5 0.63
Educational level (%, n)
1st e 2nd level 74.8 (80) 76.0 (38) 73.3 (42)
0.89
3rd level and secundary 22.4 (24) 22.0 (11) 22.8 (13)
University or others 2.8 (3) 2.0 (1) 3.5 (2)
Marital status (%, n)
Single 15.7 (17) 4.0 (2) 25.9 (15)
0.08
Married / living as married 65.7 (71) 74.0 (37) 58.6 (34)
Others 17.6 (19) 22.0 (11) 15.5 (9)
Inadequate food-safety (%, n) 46.4 (51) 14.0 (7) 73.3 (44) < 0.01
Clinical data
Systolic BP, mmHg (mean ± SD) 134.2 ± 20.6 132.5 ± 17.2 135.6 ± 22.7 0.43
Diastolic BP, mmHg (mean ± SD) 82.5 ± 13.1 79.8 ± 10.1 84.8 ± 14.8 0.04
Controlled BP (%, n) 56.4 (62) 62.0 (31) 51.7 (31) 0.28
Number of anti-hypertensive drugs (mean ± SD) 1.75 1.62 1.85 0.37
BMI (kg/m2) (mean ± SD) 31.6 ± 3.7 31.4 ± 3.4 31.8 ± 4.0 0.54
BMI (kg/m2) (%, n) Pre-Obesity 40.9 (45) 42 (21) 40 (24) 0.83
Obesity 59.1 (65) 58 (29) 60 (36)
WC (cm) (mean ± SD) 102.2 ± 9.3 102.7 ± 10.5 101.7± 8.3 0.55
Cardiovascular risk (based on WC) (%, n) 82.6 (90) 83.1 (49) 82.0 (41) 0.54
Diabetes (%, n) 32.7 (36) 26.0 (13) 38.3 (23) 0.23
Hypercholesterolemia (%, n) 66.4 (73) 58.0 (29) 48.3 (29) 0.29
ARTIGO ORIGINAL Table 3 - Follow-up comparison of nutritional awareness, behaviour, tobacco consumption and practice of physical activity
Total (n = 110)
NBP (n = 50)
IAO
(n = 60) p-value
Weight loss percentage (mean ± SD) 1.09 ± 3.2 1.4 ± 2.7 0.8 ± 3.6 0.32
Body weight, kg (mean ± SD) Baseline 80.84 ± 11.88 78.81 ± 11.75 82.52 ± 11.82 0.10
6 months 79.89 ± 11.54 77.55 ± 10.65 81.84 ± 11.98 0.52
p-value – Comparison between baseline and follow-up < 0.01 < 0.01 0.09
BMI, kg/m2 (mean ± SD) Baseline 31.59 ± 3.69 31.35 ± 3.36 31.79 ± 3.95 0.62
6 months 31.24 ± 3.73 30.88 ± 3.17 31.54 ± 4.14 0.35
p-value – Comparison between baseline and follow-up 0.01 < 0.01 0.11
Waist circumference, cm (mean ± SD) Baseline 102.19 ± 9.33 102.77 ± 0.48 101.69 ± 8.29 0.55
6 months 100.61 ± 9.44 101.08 ± 9.33 100.22 ± 9.57 0.64
p-value – Comparison between baseline and follow-up < 0.01 0.01 0.02
Excessive alcohol consumption (%, n) Baseline 17.3 (19) 26.0 (13) 10.0 (6) 0.27
6 months 11.8 (13) 22.0 (11) 3.3 (2) 0.03
p-value – Comparison between baseline and follow-up 0.34 0.62 0.12
Alcohol consumption, g/day (mean ± SD) Baseline 10.43 ± 21.81 14.21 ± 23.82 7.28 ± 19.61 0.06
6 months 6.79 ± 13.52 10.47 ± 16.55 3.71 ± 9.43 0.03
p-value – Comparison between baseline and follow-up 0.01 0.01 0.01
Smoker (%, n) Baseline 9.1 (10) 6.0 (3) 11.7 (7) 0.30
6 months 7.3 (8) 4.0 (2) 10.0 (6) 0.28
p-value – Comparison between baseline and follow-up 0.50 1.00 1.00
Compliance with physical activity recommendation (%, n) Baseline 19 (17.3%) 14 (28.0%) 5 (8.3%) 0.01
6 months 17 (15.5%) 11 (22.0%) 6 (10.0%) 0.08
p-value – Comparison between baseline and follow-up 0.79 0.45 1.00
Number of known recommendations (mean ± SD) Baseline 4.42 ±1.85 4.80 ± 1.67 4.12 ± 1.96 0.07
6 months 7.19 ±1.13 7.34 ± 1.02 7.08 ±1.21 0.23
p-value – Comparison between baseline and follow-up < 0.01 < 0.01 < 0.01
Number of recommendations followed (mean ± SD) Baseline 4.01 ± 1.64 4.27 ± 1.48 3.76 ± 1.59 0.05
6 months 4.93 ± 1.29 5.42 ± 1.09 4.39 ± 1.41 < 0.01
p-value – Comparison between baseline and follow-up 0.01 0.01 0.01
In the NBP group, daily consumption of at least three fruit servings was associated to weight loss. In the IAO group, we only found a tendency of association between dyslipidemia and vegetable consumption to a higher percentage of weight loss.
DISCUSSION
Behaviour intervention in the PRAdA study proved efficient in promoting weight loss in medicated overweight hypertensive patients followed in primary healthcare in the Lisbon region. Compared to the observational phase, we found a 0.13% higher monthly percentage of weight loss during the interventional period. However, this intervention seems more efficient in the NBP group (compared to the IAO group) and in men (compared to women). A higher weight loss in NBP than in IAO (1.4% vs. 0.8%) is in line with what
has been observed in other studies.7,8,36 However, despite
a similar proportion of weight loss differences, the average weight loss obtained in our six-month’s intervention (1.26 kg in NBP and 0.68 kg in IAO) may not be directly compared to the one obtained in these studies (weight losses between
2.3 and 5.7 kg in blacks and 4.5 kg and 8.0 kg in whites) as different methodologies of intervention were used.5,7,8,37
Most interventions have been carried out in volunteer participants, involved a higher number of sessions, between 16 and 30 and were focused on three factors: motivational, nutritional and lifestyle. The results obtained in the present study are in line with other studies on ethnic minorities, involving only one interventional component (nutrition or physical activity)37 and carried out in a primary healthcare
context.38
Other factors that could contribute to a lower weight loss when compared to international results would be the fact that this intervention was based on a DASH diet20 with
controlled salt intake, increase in vegetables, low-fat dairy products and fish consumption, controlled red meat intake, with no calorie restriction requirements.
ARTIGO ORIGINAL
IAO participants were similar, we found a lower compliance with nutritional recommendations in IAO participants. This fact suggests lower adaptation ability towards the recommendations, probably related to cultural factors and acculturation processes.37 In fact, Portuguese traditional
immigration has a PALOP origin and its flow started in the seventies. It seems that despite a high level of acculturation, nutritional practices largely maintained the cultural roots from the countries of origin. Another factor to be emphasized is the percentage of individuals living in an inadequate food-safety situation, significantly higher in the IAO when compared to NBP group. Some review studies have shown an association between an inadequate food-safety situation and obesity, mostly in women, not due to an absent awareness but to a more difficult access to healthier options.39 Some authors suggest that people of black
ethnicity, even if sufficiently motivated towards the change, seem to have a lower baseline weight loss as they need more time to identify viable strategies and adapt themselves to their own personal context.8,40
In our study, age-adjusted weight was higher in male, as a whole and in both groups. These results are in line with other studies and these differences between genders are presumably biologically based and associated to the response to physical exercise.41 We also found an
association of cardiovascular risk factors – uncontrolled hypertension, higher BMI and higher cholesterol in the NBP group – with higher weight losses along the intervention. These data suggest that a higher cardiovascular risk is a motivation factor towards a higher compliance to recommendations, reflected in a higher weight loss. In NBP group, the daily consumption of at least three fruit servings and two low-fat dairy products servings is also significantly related to a higher weight loss. In contrast, in IAO group, there was only a trend towards an association to nutritional awareness.
One of the limitations of our study relates to the dimension
of the sample for the application of multiple regression models. With a sample of 50 for NBP group and 60 for IAO, we only managed to obtain a statistical power of 0.70 and a difference (effect size) of 0.35. With a sample of 120, it would have been possible to obtain a statistical power of 0.80 and a difference of 0.15, the usual values used in these kind of analysis.42 Moreover, the inclusion of several healthcare
units from a region, despite a subsequent random selection of participants, did not assure a generalisation of results for the remaining population subgroups in Portugal.
Another limitation of the proposed intervention was a shorter duration of follow-up, when compared to other similar studies.37 This option was justified in the context of an
application of this type of intervention to primary healthcare but it may have affected the success of the intervention. In the future, participants should be reassessed in order to evaluate a long-term intervention efficacy. Although we are aware that evaluations carried out in different times of the year may be affected by seasonal weight changes, some studies show that these changes are irrelevant and that peaks and falls do not coincide with the moments of evaluation from PRAdA study.43 Therefore, in this study, in
order to minimise the limitation caused by the absence of a control-group, weight variation was compared specifically between the observational interview and the beginning of the interventional stage.
One of the major qualities of the intervention is a demonstration of the ease of implementation in primary healthcare context, given the low number of in-person sessions and necessary health professionals. The study feasibility assures that it will be possible to apply this methodology at a national level in groups of cardiovascular risk registered in primary healthcare units.
These contrasting results of the intervention according to gender and ethnic origin may pave the way towards improvement in clinical intervention. Poorer compliance to recommendations (and not poorer nutritional awareness) as
Figure 2 - Progression of the percentage of participants aware and complying with each recommendation
NBP – Native-Born Portuguese; IAO – Immigrants of ethnic African Origin
NBP
Baseline 6 Months Fruit
Baseline 6 Months Fruit
Baseline 6 Months Vegetables
Baseline 6 Months Vegetables
Baseline 6 Months Fish
Baseline 6 Months Fish
Baseline 6 Months Fat Fish
Baseline 6 Months Fat Fish
Baseline 6 Months Red Meat
Baseline 6 Months Red Meat
Baseline 6 Months Eggs
Baseline 6 Months Eggs
Baseline 6 Months Legumes
Baseline 6 Months Legumes
Baseline 6 Months Dairy Products
Baseline 6 Months
Dairy Products Baseline 6 MonthsSodium Baseline 6 MonthsTotal of Meals NBP
Percentage of participants
complying with recommendation
Percentage of participants aware of recommendation
IAO IAO 0.52 0.90 0.53 0.80 0.62 0.51 0.53 0.60 0.50 0.52 0.68 0.20 0.50 0.60 0.67 0.80 0.20 0.35 0.66 0.18 0.94 0.60 0.48 0.56 0.24 0.70 0.66 0.64 0.58 0.62 0.54 0.70 0.62 0.66 1.00 1.00 0.90 0.73
0.85 0.92 0.80
0.85 0.95 0.32 0.63 0.88 0.83 0.92 0.40 0.63 0.84 0.48
1.00 1.00 1.00
ARTIGO ORIGINAL
Table 4
- Factors related to weight loss (bivariate linear regression for the whole sample and stratified by groups)
W
eight variation (SE)
Total NBP IAO Baseline 6 months Baseline 6 months Baseline 6 months Socio-economic variables t Age, years -0.058 (1.932) --0.104 (0.045) ---0.100 (0.046) --Male -0.270 (0.628) * ---0.269 (0.750) † ---0.263 (1.012) *
--Marital status: partner
vs.
no partner (reference)
-0.084 (0.655) ---0.074 (0.874) ---0.064 (0.972)
--Number of years of school
-0.051 (0.094) --0.017 (0.122) ---0.081 (0.140)
--Years of residence in Portugal
--0.01 1 (0.041)
--Living in an inadequate food-safety situation
0.033 (0.621) ---0.1 14 (1.101) --0.01 1 (1.068) --Clinical V ariables t BMI -0.043 (0.084) ---0.298 (0.1 10) * --0.073 (0.120)
--Uncontrolled hypertension baseline
-0.218 (0.610) * ---0.189 (0.778) † ---0.258 (0.913) *
--Uncontrolled hypertension – end of the study
-0.631 (0.631) --0.033 (0.792) ---0.166 (0.945)
--Number of years since hypertension diagnosis
0.049 (0.030) ---0.053 (0.035) --0.135 (0.049) --Diabetes 0.078 (0.659) --0.007 (0.877) --0.962 (--0.962) --Hypercholesterolemia -0.186 (0.610) * --0.053 (0.778) ---0.322 (0.895) * --Cardiovascular risk 0.069 (0.823) ---0.093 (0.997) --0.171 (1.261) †
--Awareness and behaviour
Non-smoker -0.104 (1.073) -0.136 (1.183) † -0.94 (1.612) -0.163 (1.936) -0.96 (1.465) -0.1 11 (1.565) PA practice 0.074 (0.818) 0.001 (0.858) -0.081 (0.854) -0.016 (0.928) 0.304 (1.629) 0.048 (1.573)
Excessive alcohol consumption
-0.141 (0.812) † -0.131 (0.952) † -0.133 (0.869) -0.183 (0.913) -0.130 (1.561) -0.46 (2.629)
More than 4 meals per day
0.004 (0.629) -0.1 14 (1.027) -0.39 (0.81 1) 0.097 (1.953) 0.052 (0.944) -0.166 (1.305) Consumption of:
Vegetables ≥ 3 times/day
0.007 (0.789) -0.098 (0.622) 0.016 (1.181) 0.018 (0.770) -0.002 (1.181) -0.161 (0.952)
Fruit ≥ 3 times/day
-0.1 14 (0.616) -0.006 (0.696) -0.244 (0.787) † -0.195 (1.029) † 0.004 (0.990) 0.1 16 (0.974)
Red meat ≤ 2 meals/week
0.1 19 (0.618) -0.048 (0.878) 0.063 (0.768) 0.1 18 (0.994) 0.141 (0.955) 0.1 18 (1.445) †
Fish ≥ 2 meals/week (at least 1 with fat fish)
-0.186 (0.610) * -0.049 (0.720) -0.158 (0.762) 0.041 (1.182) -0.190 (0.941) † -0.052 (0.989)
Legumes ≥ 2 meals/week
-0.108 (0.623) -0.003 (0.689) 0.043 (0.779) 0.139 (0.991) -0.189 (0.928) † -0.043 (0.979)
Low-fat dairy ≥ 2 times/day
-0.202 (0.735) * -0.164 (0.624) † -0.289 (0.862) * -0.295 (0.735) * -0.144 (1.169) -0.057 (1.014)
Sodium ≤ 1,500mg (estimated)
-0.53 (0.675)
0.076 (0.772)
0.078 (0.822)
0.042 (0.971)
-0.153 (1.036)
Total number of recommendations followed
-0.140 (0.189) † -0.146 (0.238) † -0.201 (0.252) † -0.124 (0.380) -0.088 (0.276) -0.1 17 (0.355) Recommendation awareness: Vegetables -0.1 13 (0.623) -0.168 (0.768) † -0.228 (0.771) † -0.063 (0.959) -0.034 (0.946) -0.236 (1.158) † Fruit -0.027 (0.628) -0,148 (1,1 19) † -0.003 (0.812) -0.1 12 (1.609) -0.020 (0.945) -0.157 (1.555) Red meat 0.057 (0.626) -0.060 (0.929) -0.099 (0.934) -0.061 (1.279) 0.166 (0.934) -0.049 (1.321) Fish 0.074 (1.898) 0.080 (2.324) 0.047 (2.744) --0.065 (1.218) 0.1 13 (2.638) Legumes 0.063 (0.624) -0.151 (0.848) † 0.093 (0.798) 0.100 (1.275) 0.070 (0.943) -0.251 (1.143) * Dairy products 0.003 (0.631) 0.005 (0.930) -0.097 (0.775) 0.131 (0.992) -0.063 (0.962) -0.130 (1.695)
Total number of known recommendations
0.036 (0.168) -0.135 (0.278) † -0.086 (0.232) 0.040 (0.380) 0.130 (0.241) -0.212 (0.397) † * p
-value < 0.05;
†
p
-value < 0.20.
t
variables that were only assessed at the beginning of the intervention. BMI – Body mass index; P
A – Physical activity; SE – Standard error; NBP
– Native-Born Portuguese; IAO – Immigrants of ethnic
ARTIGO ORIGINAL found in the IAO group should be considered for designing
intervention strategies. These should also consider cultural and motivational differences in the involved communities. We also wish to point out that despite this small weight loss, when compared to the results obtained with intensive interventions, nutritional changes improve cardiovascular risk profile,.44 even in the absence of weight changes. We
observed that even small weight losses lead to BP reduction (approximately 1 mmHg per kg of weight loss), particularly in hypertensive patients under treatment.45
CONCLUSION
The results of our intervention were satisfactory in terms of weight loss promotion, especially in the NBP group. Differences between groups were in line with what was expected, i.e. IAO lost less weight than NBP participants. Educational intervention increased awareness and compliance with nutritional recommendations in both groups, emphasizing the relevance of nutritional education
and lifestyle intervention in primary healthcare context, namely the promotion of vegetables and fish consumption, as well as the reduction of salt and red meat consumption (Table 1).
As a whole, factors for success of this type of intervention directed towards weight loss were male gender and the daily consumption of more than two low-fat dairy products servings, independently of age and ethnic origin. In NBP participants, a higher baseline BMI and the consumption of at least three fruit servings per day were also related to a higher weight loss, independently of gender and age. According to these results, future interventions should not only emphasize the factors of success for weight loss, but should also have a longer duration and evaluate more accurately water and sodium intake. Motivational techniques and a higher component of cultural involvement reducing health disparities should also be included, in order to improve compliance to diet therapy and healthy lifestyles.11
Table 5 - Factors related to weight loss – multiple linear regression for the whole sample and stratified by groups
Whole sample* NBP IAO
Betaa p value βa p value βa p value
Age 0.031 0.760 0.178 0.179 -0.016 0.919
Male -0.281 0.012 -0.192 0.147 -0.226 0.173
Baseline uncontrolled hypertension -0.131 0.172 -0.128 0.338 -0.115 0.410
Body Mass Index - - -0.282 0.032
Cardiovascular risk (waist circumference) 0.100 0.523
Non-smoker at 6 months -0.051 0.585 -
-Hypercholesterolemia -0.146 0.138 - - -0.271 0.084
Baseline excessive alcohol consumption 0.036 0.730 -
-Baseline ≥ 2 meals/week of fish
(at least 1 meal with fat fish) -0.111 0.248 - - -0.058 0.675
Baseline fruit consumption ≥ 3 times/day - - -0.276 0.037
Baseline low-fat dairy products consumption ≥ 2 times/day -0.242 0.011
Baseline legumes consumption ≥ 2 meals/week 0.018 0.907
Number of daily meals above 4 at 6 months -0.172 0.250
Red meat consumption ≤ 2 meals/week at 6 months 0.021 0.874
Low-fat dairy products consumption ≥ 2 times/day at 6 months - - -0.240 0.064
Awareness of fruit recommendation at 6 months -0.141 0.136
Awareness of legumes recommendation at 6 months -0.062 0.509 -0.216 0.124
Awareness of vegetable recommendation at 6 months -0.063 0.521 -0.145 0.271 -0.132 0.339
Adjusted R2; Standard error 0.150; 2.995 0.241; 2.344 0.185; 3.325
ARTIGO ORIGINAL
REFERENCES
1. Appel LJ, Brands MW, Daniels SR, Karanja N, Elmer PJ, Sacks FM;
et al. Dietary approaches to prevent and treat hypertension: a scien-tific statement from the American Heart Association. Hypertension. 2006;47:296–308.
2. Primatesta P, Falaschetti E, Gupta S, Marmot MG, Poulter NR. Associa-tion between smoking and blood pressure : evidence from the Health Survey for England. Hypertension. 2001;37:187–93.
3. Machado H, Alves AS, Tinoco C, Gonçalves C, Matos C, Rego D, et al. Prevalência do diagnóstico de hipertensão arterial em pessoas seden-tárias e em praticantes de exercício físico, na cidade do Porto. Acta Med Port. 2010;23:153–8.
4. Pereira S. Abordagem do risco cardiovascular no doente hipertenso. Acta Med Port. 2010;23:223–6.
5. Kumanyika, S. Ethnic minorities and weight control research pri-orities: where are we now and where do we need to be? Prev Med. 2008;47:583–6.
6. Smith GD, Chaturvedi N, Harding S, Nazroo J. Williams R. Ethnic in-equalities in health: A review of UK epidemiological evidence. Crit Public Health. 2000;10:375–408.
7. Kumanyika SK, Espeland MA, Bahnson JL, Inferior JB, JB Charleston, Folmar S, et al. Ethnic comparison of weight loss in the Trial of Non-pharmacologic Interventions in the Elderly. Obes Res. 2002;10:96–106. 8. West DS, Prewitt ET, Bursac Z, Felix HC. Weight loss of black, white,
and Hispanic men and women in the Diabetes Prevention Program. Obesity. 2008;16:1413–20.
9. Fitzgibbon ML, Tussing-Humphreys LM, Porter JS, Martin IK, Odoms-Young A, Sharp LK. Weight loss and African-American women: a sys-tematic review of the behavioural weight loss intervention literature. Obesity Rev. 2012;13:193–213.
10. Serviço Estrangeiros e Fronteiras. Relatório de Imigração, Fronteiras e Asilo 2011. Lisboa, 2012.
11. Instituto Nacional de Estatística. Inquérito Nacional de Saúde 2005/2006. Lisboa, 2009.
12. Estrela P. A saúde dos imigrantes em Portugal. Rev Port Clin Geral. 2009;45–55.
13. Reijneveld SA. Reported health, lifestyles, and use of health care of first generation immigrants in The Netherlands: do socioeconomic fac-tors explain their adverse position? J Epidemiol Community Health. 1998;52:298–304.
14. World Health Organization. International Migration, Health Acknow-ledgements. Geneve: WHO; 2003.
15. Teixeira PJ, Going SB, Houtkooper LB, Cussler EC, Metcalfe LL, Blew RM, et al. Exercise motivation, eating, and body image variables as pre-dictors of weight control. Med Sci Sports Exerc. 2006;38:179–88. 16. ADA position of the American Dietetic Association: weight management.
J Am Diet Assoc. 2009;109:330–46.
17. Rodrigues SS, Franchini B, Graça P, de Almeida MD. A new food guide for the Portuguese population: development and technical consider-ations. J Nutr Educ Behav. 2006;38:189–95.
18. Scientific Advisory Comittee on Nutrition. Advice on fish consumption: benefits & risks 2004. London: TSO (The Stationery Office); 2004. 19. Pan A, Sun Q, Bernstein AM, Schulze MB, Manson JE, Stampfer MJ,
et al. Red meat consumption and mortality: results from 2 prospective cohort studies. Arch Intern Med. 2012;172:555–63.
ACKNOWLEDGEMENTS
The authors wish to acknowledge all participants in the study namely the Healthcare Units of the Agrupamentos de
Centros de Saúde de Loures (CS Sacavém and USF São
João da Talha) and Algueirão - Rio de Mouro (CS Algueirão
and USF Natividade), as well as members of this project -
Ana Pinto, Beatriz Goulão and Isabel Cardoso.
CONFLICTS OF INTEREST
The authors declare that there were no conflicts of interest in writing this manuscript.
FINANCIAL SOURCES
The PRAdA study has been funded by the Direção-Geral
da Saúde (DGS) and by AstraZeneca Foundation. Part
of the study was presented on the following conferences:
“Efeito na perda de peso de uma intervenção alimentar e de estilos de vida em hipertensos medicados nativos e imigrantes africanos seguidos nos cuidados de saúde primários da região de Lisboa e Vale do Tejo (Estudo
PRAdA)”, oral communication at the XII Congresso de
Nutrição e Alimentação, 16 and 17th May 2013, Centro de
Congressos de Lisboa and “Effect on weight loss of food
and lifestyles intervention in treated hypertensive natives
and African immigrants in Lisbon (PRAdA Study)”, poster
presentation, EUROEPI 2013, 11-14th August, 2013, Aarhus – Denmark.
20. NIH. Lowering your blood pressure with DASH. NIH Publication. 2006; No. 06-4082.
21. National Institute for Health and Clinical Excellence Hypertension: Clini-cal management of primary hypertension in adults. NICE cliniClini-cal guide-line 127. 2011.
22. Mancia G, De Backer G, Dominiczak A, Cifkova R, Fagard R, Germano G, et al. 2007 ESH-ESC Practice Guidelines for the Management of Arterial Hypertension: ESH-ESC Task Force on the Management of Ar-terial Hypertension. J Hypertens. 2007;25:1751–62.
23. National Diet and Nutrition Survey Interviewer Measurements. 2007;1– 11.
24. World Health Organization. WHO - Fact Sheet No311. 2011. [Consul-tado 2013 Jul 08]. Disponível em: http://www.who.int/mediacentre/fact-sheets/fs311/en/.
25. Green SM, Watson R. Nutritional screening and assessment tools for older adults: literature review. J Advanc Nurs. 2006;54:477–90. 26. Heiat A, Vaccarino V., Krumholz HM. An evidence-based assessment
of federal guidelines for overweight and obesity as they apply to elderly persons. Arch Intern Med. 2001;161:1194–203.
27. Blackburn GL, Dwyer JT, Wellman NS, eds in collaboration with Ameri-can Academy of Family Physicians, the AmeriAmeri-can Dietetic Association, National Council on the Aging. Nutrition interventions manual for pro-fessionals caring for older Americans. Washington, DC: The Nutrition Screening Initiative; 1992.
28. Direcção-Geral da Saúde. Programa Nacional de Combate à Obesi-dade. Lisboa: DGS; 2005.
29. He FJ, MacGregor GA. Reducing population salt intake worldwide: from evidence to implementation. Progr Cardiovasc Dis. 2010;52:363–82. 30. World Health Organization. Global Recommendations on Physical
Activ-ity for Health. Geneve: WHO; 2010.
31. Compêndio de actividades físicas. Como calcular o dispêndio energé-tico de actividade física em adultos. Lisboa. FMH Edições; 2004. 32. Mendes R, Sousa N; Barata JLT. Actividade física e saúde pública
recomendações para a prescrição de exercício. Acta Med Port. 2011;24:1025–30.
33. Core indicators of nutritional state for difficult-to-sample populations. J Nutr. 1990;120:1557S–600.
34. USDA/ERS, U. S. D. of A.-E. R. S. U.S. Household Food Security Survei Module: Six Short Form. Philadelphia: USDA/ERS; 2008.
35. Hosmer C, Lemeshow S. Applied logistic regression. New York: Wiley; 2000.
36. Hollis JF, Gullion CM, Stevens VJ, Brantley PJ, Appel LJ, Ard JD, et al. Weight loss during the intensive intervention phase of the weight-loss maintenance trial. Am J Prev Med. 2008;35:118–26.
37. Seo DC, Sa J. A meta-analysis of psycho-behavioral obesity interventions among US multiethnic and minority adults. Prev Med. 2008;47:573–82. 38. Logue EE, Jarjoura DG, Sutton KS, Smucker WD, Baughman KR, Ca-pers CF. Longitudinal relationship between elapsed time in the action stages of change and weight loss. Obes Res. 2004;12:1499–508. 39. Dinour LM, Bergen D, Yeh MC. The food insecurity-obesity paradox: a
review of the literature and the role food stamps may play. J Am Diet Assoc. 2007;107:1952-61.
40. Epstein DE, Sherwood A, Smith PJ, Craighead L, Caccia C, Lin PH,
ap-ARTIGO ORIGINAL proaches to stop hypertension diet in African-American and white adults
with high blood pressure: results from the ENCORE trial. J Acad Nutr Diet. 2012;112:1763–73.
41. Dunn CL, Hannan PJ, Jeffery RW, Sherwood NE, Pronk NP, Boyle R. The comparative and cumulative effects of a dietary restriction and ex-ercise on weight loss. Int J Obes. 2006;30:112–21.
42. Soper DS. A-priori sample size calculator for multiple regression. (2013). [Consultado 2013 Jul 10]. Disponível em: http://www.danielsoper.com/ statcalc.
43. Ma Y, Olendzki BC, Li W, Hafner AR, Chiriboga D, Hebert JR, et al.
Seasonal variation in food intake, physical activity, and body weight in a predominantly overweight population. Eur J Clin Nutr. 2006;60:519–28. 44. Gaesser GA, Angadi SS, Sawyer BJ. Exercise and diet, independent
of weight loss, improve cardiometabolic risk profile in overweight and obese individuals. Phys Sportsmed. 2011;39:87-97.
45. Neter JE, Stam BE, Kok FJ, Grobbee DE, Geleijnse JM. Influence of
Paulo NICOLA, Sofia GUIOMAR, Paulo NOGUEIRA, Evangelista ROCHA