ESSAYS ON INFORMATION DISCLOSURE AND CONSUMER SEARCH IN AUTOMOBILES MARKET
Guneet Kaur Nagpal
A Dissertation submitted to the faculty at the University of North Carolina at Chapel Hill in partial fulfillment of the requirements for the degree of Doctor of Philosophy in Business
Administration in the Kenan-Flagler Business School.
Chapel Hill 2019
Approved by: Preyas Desai Katrijn Gielens
ABSTRACT
Guneet Kaur Nagpal: Essays on Information Disclosure and Search in Durable Goods Market (Under the direction of Rajdeep Grewal)
Information disclosure by product report cards or online information portals and consumers’ own search effort to obtain product information address important informational
asymmetries in product markets. The two studies in this dissertation scrutinize two noteworthy
concerns of information disclosure and search in durable goods market. First, what is the role of
a product report card in durable goods market, when reducing information asymmetry is not the
key benefit being offered? Second, what is the dollar value of consumer effort cost for searching,
haggling for and purchasing durables and how does the variation in search cost across consumers
influence the pricing and marketing strategies of sellers?
In study 1, I exploit a natural experiment generated by entry of the U.S. News and World
Report (USNWR) meta-report card in the automobile market and quantify the economic value of
meta-report for consumers. Meta-Report cards are the product report cards that synthesize
information from incumbent information sources with the purported goal of easing consumer
decision making. The results show that the brands being ranked on USNWR meta-report card translates to welfare of $10.53 for an average consumer. From firm’s perspective, on an average,
one standard deviation improvement on USNWR ratings (measured on a 10-point scale with
advertising. The results also provide evidence for search cost reduction and quality assurance as
the underlying mechanism for the effect of meta-report card.
In study 2, I quantify the dollar costs of consumers’ effort in searching, haggling for and
purchasing a specific brand configuration. I estimate an integrated utility-maximizing model
wherein consumers weigh the expected utility from the brand to be chosen against the cost of
searching for the brands. Consumers’ search cost appears in terms of the time spent online on
web portal, physical travel undertaken to dealerships, haggling done with multiple dealerships,
and patience exhibited in consummating the deal. Using a unique dataset of around 70,000
automobile shoppers who use an automobile portal to search for automobile brands, form a
consideration set, contact dealerships, and purchase car from one of the dealerships, I estimate
consumers total search and haggling costs. Findings suggest that an average automobile shopper
incurs search or haggling cost of $489.37 (with a range: $273 -$841 across shoppers). An
average shopper is expected to travel 61.1 miles to get an extra $250 discount from a farther
dealership and is expected to pay $130 for a home delivered test drive or home delivery of
chosen car. Shoppers in metropolitan cities have higher search costs and demographic factors
such as income, race and age group also brings added level of variation in search and haggling
To my husband Robin and son Avraj; And my parents Jagdish Singh and Pritpaul Kaur;
ACKNOWLEDGEMENTS
The completion of my dissertation and Ph.D. has been a long journey. Foremost, I thank
Waheguru for giving me the strength and opportunity to undertake this research study and for connecting me to the right set of people who supported me to persevere and complete my Ph.D.
satisfactorily. I would like to express my deep appreciation to my advisor, Professor Rajdeep
Grewal who nurtured me and trained me for state of the art research. I am much indebted and
grateful to Raj for his invaluable guidance, scholarly input, and patient support throughout my Ph.D. Raj’s work ethic and approach towards research inspires me greatly to follow his
footsteps. The set of courses I took upon Raj’s recommendation have equipped me with the
necessary skills to pursue research. In addition, I would like to thank the rest of my dissertation
committee, Preyas Desai, Katrijn Gielens, Shrihari Sridhar, and Sriram Venkataraman for their
valuable advice and feedback throughout the doctoral program and dissertation work.
I wholeheartedly thank my life-long companion, my husband, Robin Nagpal. These past
several years have not been an easy ride for me. I truly thank Robin for his incredible support
and profound love. His constant encouragement and participation in various discussions related
to research helped me sail through many difficult phases of the PhD program. I would not have
completed my Ph.D. without his support. I and also deeply grateful to our 17 months old son
Avraj, who has been the most cooperative and the happiest infant during the busiest time of my
Last, but certainly not least, I thank my parents, Jagdish Singh and Pritpaul Kaur, for
their value to me grows with age. I owe a lot to them, for their wisdom and conduct have been
the guiding light of my life. I thank my sister, Aneet, for her deep affection and cheerfulness. I
am also intensely indebted to my in-laws Dr. Bal Krishan Nagpal and Promila Nagpal who
TABLE OF CONTENTS
LIST OF TABLES ……… xi
LIST OF FIGURES………...xii
CHAPTER 1: INTRODUCTION………1
References………...7
CHAPTER 2: THE ECONOMIC VALUE OF META-REPORT CARDS: A CASE OF AUTOMOBILES Introduction………8
Relevant Literature………. 12
Product Report Cards……….12
Metasearch Portals……….13
Data Description.………..14
Marketing Mix ...………..……….15
Automobile Features ………15
Ratings Data ………16
Model Specification ………17
Consumer Demand and Value of Meta-Report Cards………...18
Demand Model………...18
Identification Challenges and Strategy………. 21
Endogeneity of Treatment………. 22
Endogeneity of Brand Rating……… 24
Endogeneity of Marketing Mix………. 25
Endogeneity of Nested Logit Term………25
Results...26
Model Free Evidence ………26
Model Based Evidence ...………. 26
Value of Information Synthesis……… 28
Ratings and Demand………. 28
Behavioral Mechanisms ………29
Discussion……….31
Limitations……….32
Contributions……….33
Conclusion……….34
References ………35
CHAPTER 3: SEARCH AND HAGGLING EFFORT COSTS IN AUTOMOBILES MARKET Introduction………..53
Relevant Literature ……….58
Data Description ………..62
Model and Estimation ...……….65
Model Development………...68
Consumer Price Beliefs………75
Identification ………75
Results………...76
Counterfactuals………81
Discussion……….84
Limitations……….85
Contributions ………86
Conclusion ...……….87
References……….87
CHAPTER 4: CONCLUSION………100
LIST OF TABLES
TABLE 2.1a: Number of Models by Make……….. 39
TABLE 2.1b: Number of Make-Models by Automobile Type……… 40
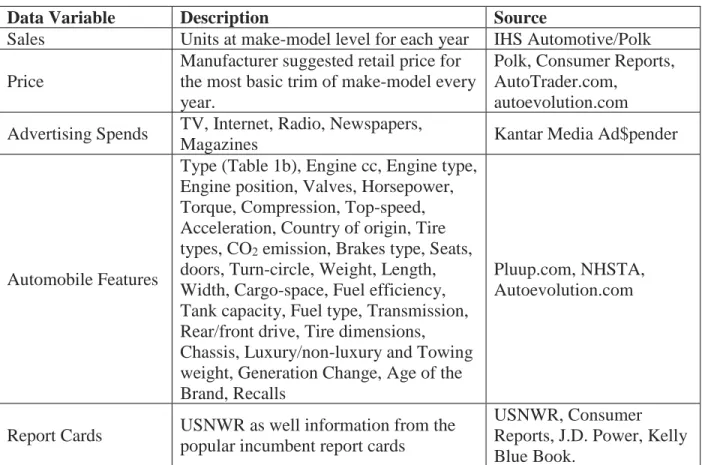
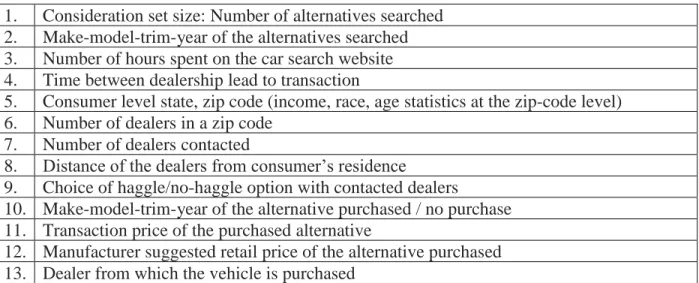
TABLE 2.2: Information on Variables………. 40
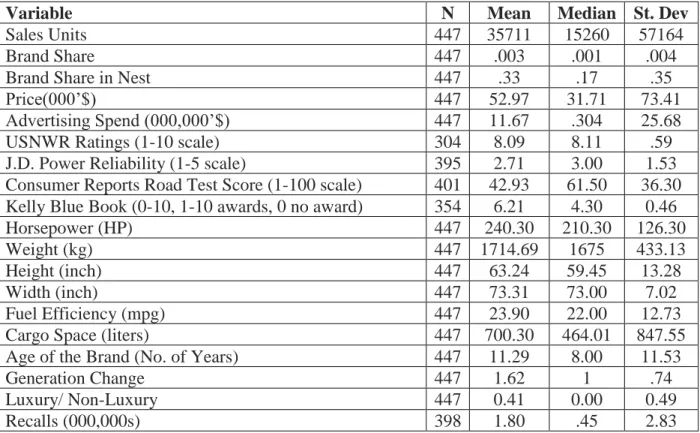
TABLE 2.3: Descriptive Statistics……….41
TABLE 2.4: Model Free Evidence………... 42
TABLE 2.5: Nested Logit Model………..43
TABLE 2.6: 3-Step IV Regression ……….. 44
TABLE 2.7: Nested Logit Model………..45
TABLE 2.8: Nested Logit Model for Rated Brands ……….46
TABLE 2.9: Search Cost Reduction Mechanism………..47
TABLE 2.10: Quality Assurance Mechanism………...48
TABLE 3.1: Observed Variables………...91
TABLE 3.2: Choice Shares………91
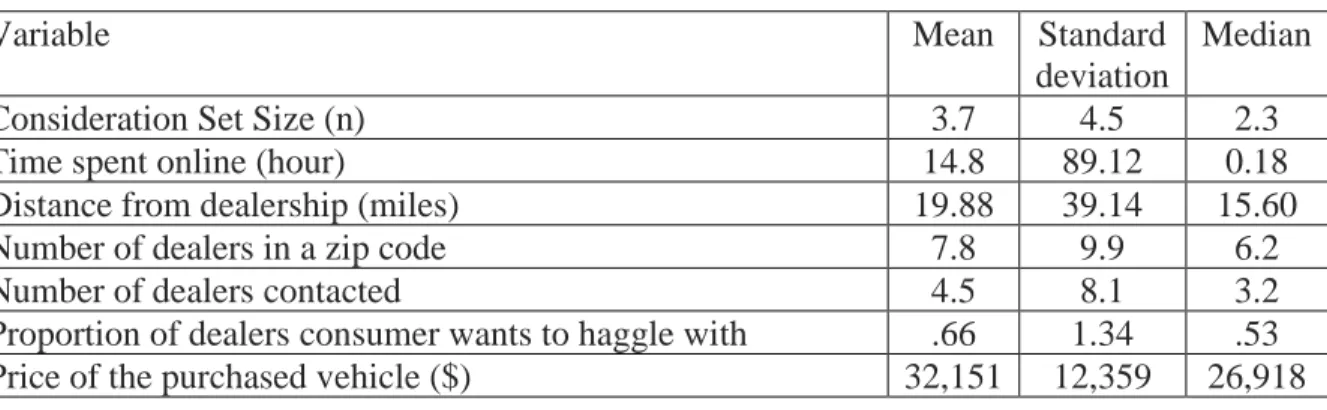
TABLE 3.3: Descriptive Statistics……… 92
TABLE 3.4: Regression for Price Beliefs ……… 93
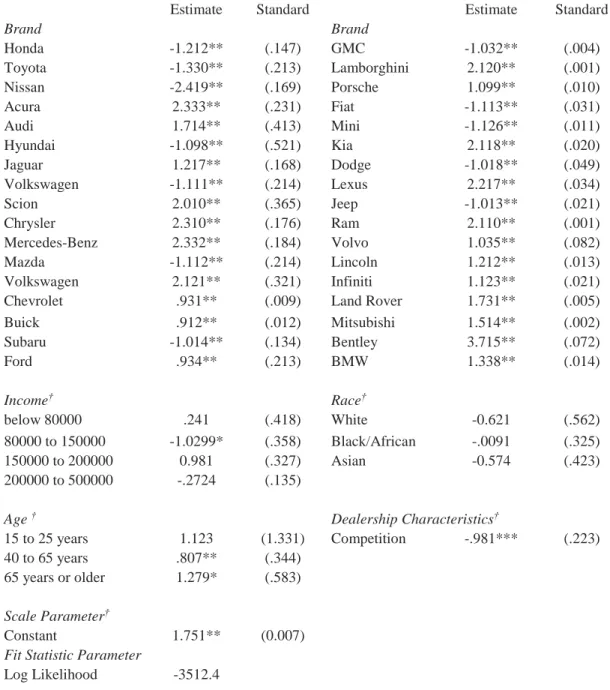
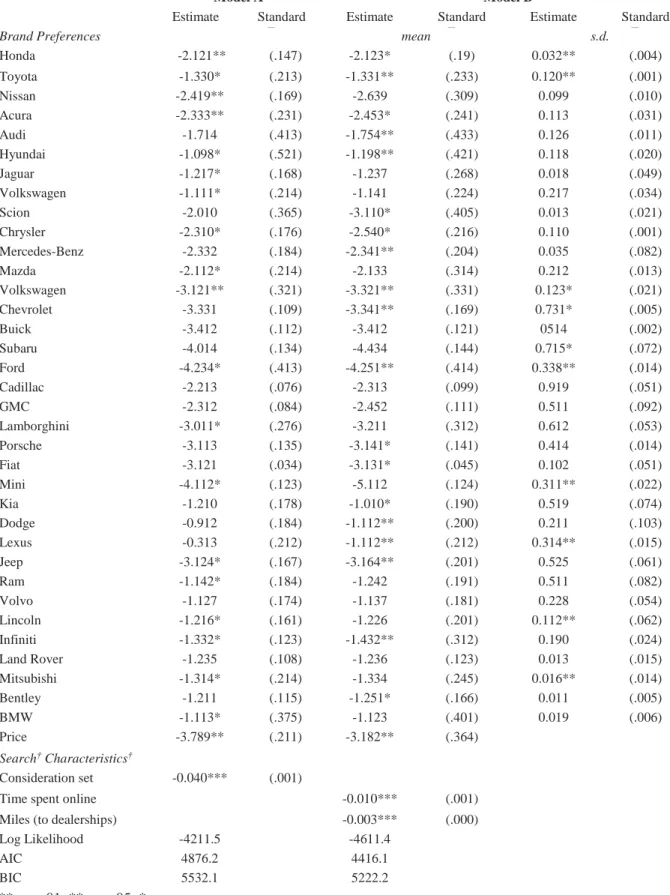
TABLE 3.5: Model Estimates ……….. 94
TABLE 3.6: Hedonic Price Regression of Transaction Prices ….………... 96
TABLE 3.7: Implied Own-Price Elasticities ………....98
LIST OF FIGURES
FIGURE 2.1: USNWR Automobile Ratings……….49
FIGURE 2.2: Before-After Natural Experiment………49
FIGURE 2.3: Distribution of Ratings ………... 50
FIGURE 2.4: Screenshot of Automobile Ratings Mid-Size Sedans on USNWR……….50
FIGURE 2.5: Average Price of Automobile Brands in Treated and Non-Treated Group……….51
FIGURE 2.6: Model Free Evidence: Average Sales of Treated and Non-Treated Group………51
FIGURE 2.7: Sales vs. Ratings (1-10 Scale) ………52
CHAPTER 1: INTRODUCTION
Information disclosure and consumer search are two complementary concepts concerning
information transfer about product offerings from sellers to consumers. Information disclosure
stems from sellers in the form of product advertising, sampling, and test drives (in case of
automobiles) or form third party certifiers in the form of rankings or expert reviews. Consumer search refers to consumers’ efforts to garner and process information available in a market
concerning products (Shugan 1980). The notion of information disclosure and consumer search
costs challenge the assumption that consumers have perfect information about all the products in
market, and most of the emerging work that relates to demand models acknowledges
heterogeneity in information disclosure (Goeree 2008) and information search
(Moraga-Gonzalez, Sandor, and Wildenbeest 2018). Information disclosure reduces information
asymmetry (Dranove et al. 2003) and/or provides already available information in a consumption
friendly format for easy decision-making (Luca and Smith 2013). Variation in search cost across
consumers has been established to explain price dispersion (Hong and Shum 2006), product
quality (Wolinsky 2005), and product design (Bar-Isaac, Caruana, and Cunat 2012). The two
essays of my dissertation scrutinize two critical questions related to information disclosure and
search that test existing notions about the concepts in consumer durable goods market.
Regarding information disclosure, the conventional wisdom suggests that for big-ticket
cards (third party information disclosure) in the form of ratings and rankings; in essence,
consumers want opaque details of the product alternatives to arrive at their decisions (Chetty,
Looney, and Kroft 2009). In the first essay, I quantify the economic value of meta-report card for
automobile consumers. Meta-report cards are the third party report cards that synthesize
information from incumbent report cards, thus unlike product report cards, reduction in
information asymmetry is not the key benefit being offered. The prime example of meta-report
cards is the automobiles ratings launched in 2007 by the U.S. News & World Report (USNWR),
which was created by gathering and synthesizing information from incumbent report cards e.g.,
J.D. Power, Edmunds, Kelly Blue Book, among others, in the market.
I conceptualize the introduction of USNWR meta-report card to in 2007 as a natural
experiment with a pre-post and treatment-control design. The brands (make-model) rated by
USNWR belong to the treatment group and those not rated define the control group, and this
allocation of brands in treatment/control group can be non-random one. The endogeneity concern
arising due to the same is addressed using appropriate instruments. I use the year 2007 as a cutoff
for pre-post periods (pre 2007 and post 2006). USNWR rated 83 brands in 2007 with the number
rising to 179 by 2012 (from a total of 447 automobile brands; once a brand is rated, it is rated
every subsequent year). With this setting, I collate a multi-source dataset on unit sales, marketing
mix, and product features of automobiles at the make-model level (e.g., Toyota Camry) from
2004 to 2012. I augment the dataset with automobile ratings from three frequently used ratings
report cards: Consumer Reports, Kelly Blue Book, and J.D. Power (according to J.D. Power
2014).
meta-report card annually. I also find that one standard deviation improvement in rating (the
standard deviation is .58 for USNWR ratings on a 10-point scale) amounts to $3560 more in
price and savings of around $12 Million on advertising. Search cost reduction and quality
assurance mechanisms seem to drive the causal effect of USNWR meta-report card for
automobile shoppers.
Regarding consumer search, handful of existing studies notify that despite the high price
of big-ticket items, consumers undertake relatively reduced search because they do not expect
sizeable savings (Grewal and Marmorstein 1994; Chernev and Hamilton 2018). However, in the
second essay of my dissertation, I observe sizeable search effort done by consumers before
automobile purchase. For example, number of hours spent by consumers online for search for an
average 14.8 hours and number of dealerships visited vary from 1 to 13. Variation in search
effort does explain some of the price dispersion being observed. In this study, I quantify the
dollar value of consumers’ effort in shopping for automobile brands, interpreted as effort cost. I
then investigate how variation in costs across consumers affect the pricing and marketing
strategies of automobile dealerships.
The popular shopping strategy is that consumers search for products online and make final buying in physical stores; and effort cost refers to dollar value of consumers’ efforts
associated with searching, haggling, and purchasing the automobile brand of choice. Industry
reports indicate substantial search among automobile shoppers, i.e., 86% of automobile
consumers conduct online research before visiting a dealership (Auto Shopping in America
Survey by Adtaxi 2018) and all purchases happen at the dealership and an average consumer
visits 1.6 dealerships before making a transaction the shopping journey (McKinsey and CNBC
Since effort is costly due to cognitive, time, and income constraints, consumers seek to
maximize their net benefit from searching about the brands in their consideration set. In this
study, using the primitives of consumer utility, I estimate the ‘effort costs’ incurred by
consumers in simultaneously searching a set of brands online or at physical stores and haggling
for the lowest price for the chosen brand. It is found that an average automobile shopper in the
database gets a discount worth $1207 (from MSRP) and has the effort cost amounting
to $489.37 (range $273 to $841), which implies that as long as the total effort cost is
below $1200, it is worth for consumers to incur search or haggling efforts. I also find that
change in market structure of dealerships within 50-mile radius, the consideration set
composition is impacted, which implies that consumers are willing to change their brand
preferences based on the network of dealerships around them. An average consumer is willing to
search for .67 hours more online if number of dealerships of his preferred brand within 50-mile
radius decrease by 1. Since, travel has costs associated with it, a shopper in the database is
willing to travel 61.1 miles to get $250 discount. I also find that with home delivered test
drives and transactions, an average consumer is willing to pay $130 more at the point of
transaction.
The magnitude of effort cost for an automobile shopper have implications for the
automotive industry. For example, the non-trivial costs justify the growing interest of automobile
shoppers to have the entire car shopping process online. Findings are consistent with the results
in the 2017 survey conducted by Capgemini Consulting where 42 percent of consumers said they were “likely” or “very likely” to buy a car online in the future. In addition, the dealerships and
manufacturers now seek to enter the consumer search journey early on to tap into consumer
decrease search and haggling costs of consumers by offering the opportunity to complete all or some steps of automobile shopping online. Dealers’ average response time is 9.2 hours and
manufacturers’ average time is around 24 hours (Arthur D Little 2014), leaving a huge
opportunity for dealerships to improve the overall customer experience.
My dissertation makes theoretical contribution to the domain of information economics
taking the empirical setting of big-ticket purchases – automobiles. The findings offer relevant
and actionable insights for managers and policy makers. In my first dissertation essay, I study the
phenomenon of information disclosure and study the impact of third party information disclosure
on consumer demand when the key benefit of third party information disclosure is not reducing
information asymmetry but synthesizing information. The study complements the existing
(largely conceptual) work on information synthesis by undertaking empirical scrutiny of the
notion. Furthermore, most of the existing investigation has been for product report cards for
experiential goods (movies, books) or services (healthcare, education, financial services), which
I extend by studying automobiles in this essay. In my second dissertation essay, I study the
phenomenon of consumer search for information before purchase where I build on Honka (2014) work to quantify the dollar cost of consumers’ effort when they use multiple sources to garner
information, i.e., do online search and visit physical stores. Unlike most of the studies that
investigate search and haggling cost interchangeably or separately (Allen, Clark, and Houde
2018), I estimate both the costs distinctly in the study. The estimation technique allows for
differentiated goods and consumer heterogeneity in consumer search costs, similar to the
approach followed by Moraga-Gonzalez, Sandor, and Wildenbeest (2015).
dissertation address important questions regarding economic value of information disclosure and
REFERENCES
Allen, Jason, Robert Clark and Jean-Francois Houde (2018), “Search Frictions and Market Power in Negotiated Price Markets’, Journal of Political Economy.
Bar-Isaac, Heski, Guillermo Caruana, and Vicente Cuñat (2012), “Search, Design, and Market Structure,” American Economic Review, 102 (2), 1140–60.
Chernev, Alexender and Ryan Hamilton (2018), “Price Image in Retail Management,”
in Handbook of Research on Retailing, Ch. 6., Cheltenham, Glos UK: Edward Elgar, 132–34. Chetty, Raj, Adam Looney, and Kory Kroft (2009), “Salience and Taxation: Theory and Evidence,” American Economic Review, 99 (4), 1145–77.
Dranove, David, Daniel Kessler, Mark Mcclellan, and Mark Satterthwaite (2003), “Is More Information Better? The Effects of Report Cards on Health Care Providers,” Journal of Political Economy, 111 (3), 555–88.
Goeree, Michelle Sovinsky (2008), “Limited Information and Advertising in the U.S. Personal Computer Industry,” Econometrica, 76 (5), 1017–74.
Grewal, Dhruv and Howard Marmorstein (1994), “Market Price Variation, Perceived Price Variation, and Consumers Price Search Decisions for Durable Goods,” Journal of Consumer Research, 21 (3), 453.
Hong, Han and Matthew Shum (2006), “Using Price Distributions to Estimate Search Costs,”
The RAND Journal of Economics, 37 (2), 257–75.
Honka, Elisabeth (2014), “Quantifying Search and Switching Costs in the US Auto Insurance Industry,” The RAND Journal of Economics, 45 (4), 847–84.
Luca, Michael and Jonathan Smith (2013), “Salience in Quality Disclosure: Evidence from the U.S. News College Rankings,” Journal of Economics & Management Strategy, 22 (1), 58–77. Moraga-Gonzalez, Jose Luis, Zsolt Sandor and Matthijs Wildenbeest (2018), Consumer Search and Prices in the Automobile Market, Working Paper, Indiana University.
Shugan, Steven M. (1980), “The Cost of Thinking,” Journal of Consumer Research, 7 (2), 99. Wolinsky, Asher (2005), “Procurement via Sequential Search,” Journal of Political Economy, 113 (4), 785–810.
CHAPTER 2: THE ECONOMIC VALUE OF META-REPORT CARDS: THE CASE OF AUTOMOBILES
Introduction
Product report cards, in the form of third party reviews, ratings, and rankings by experts,
are an important source of information for consumer purchase decisions; thus, these report cards
form the basis of many scholarly endeavors.1 With proliferation of report cards, one is witnessing
the genesis of meta-report cards – the report cards that synthesize information from incumbent
report cards. The prime example of meta-report cards is the automobiles ratings launched in
2007 by the U.S. News & World Report (USNWR). Brian Kelly, the editor and chief content officer at USNWR described the report card as a ‘review of reviews’ to label it a meta-report
card that would serve as a one stop shop for information seekers in the automobiles category. At
the time of the launch of USNWR automobile report card, there were multiple incumbent
automobile report cards in the marketplace, such as Consumer Reports, J.D. Power, Kelly Blue
Book, and Edmunds, which had sizeable reach and credibility among consumers. Unlike these
incumbent report cards, which create new information through original research (e.g., crash
tests), USNWR gathers and evaluates public information to synthesize it in a form it believes
would be useful for consumers (see www.usnwr.com and Figure 2.1).
(Please see Figure 2.1 on page 51)
1For example, see the work of Ursu (2017) on hotels, Luca and Smith (2013) and Monks and Ehrenberg (1999) on
It is not apparent whether such meta-report cards would influence consumer decisions
and therefore market demand. On one hand, because meta-report cards do not introduce
proprietary information or sell products and simply synthesize existing information,2 one could
question their potential to influence consumer decisions (Marshall et al. 2000). Such an argument
would rest on the premise that the value of information source depends on the new and novel
insight it provides to reduce information uncertainty (Hilton 1977). For durables, such as
automobiles, where typical consumer decision making lasts for 2-3 months (e.g., Google 2011)
and consumer prefers to look at opaque product details and avoid cognitive shortcuts (e.g.,
Chetty, Looney, and Kroft 2009), meta-report cards may not be valuable. On the other hand,
synthesis of information could potentially aid in consumer search (e.g., Ghose, Ipeirotis, and Li
2014) and product ratings could be a signal of quality offering (e.g., Jin and Leslie 2003). These
gains concerning the ease of search and quality signals would suggest that meta-report cards
would influence consumer decisions and market demand. Thus, I seek to study whether and how
meta-report cards influence market demand. For the purpose, I conceptualize the introduction of
USNWR meta-report card to the United States market in 2007 as a natural experiment (see
Figure 2.2) with a pre-post and treatment-control design.3 As brands (make-model) rated by
USNWR belong to the treatment group and those not rated define the control group, I use the
year 2007 as a cutoff for pre-post periods (pre 2007 and post 2006). USNWR rated 83 brands in
2007 with the number rising to 179 by 2012 (from a total of 447 automobile brands; once a brand
2 As we discuss in the final section, endeavors similar to USNWR meta-report card are emerging in other industries, such as Techbargains for technology gadgets and Zillow for real estate.
3The USNWR report card appears as one of the top links in the Google search results for “automobile” keyword
search, and may in fact be one of the first few information sources consumers may use to search for automobiles.
is rated, it is rated every subsequent year). With this setting, I collate a multi-source dataset on
unit sales, marketing mix, and product features of automobiles at the make-model level (e.g.,
Toyota Camry) from 2004 to 2012. I augment the dataset with automobile ratings from three
frequently used ratings report cards: Consumer Reports, Kelly Blue Book, and J.D. Power
(according to J.D. Power 2014).
(Please see Figure 2.2 on page 52)
With this aggregate data around the introduction of USNWR ratings, I estimate a demand model
to assess the influence of USNWR meta-report card on demand. I utilize a nested logit model
that allows correlations among consumer tastes across ‘competing’ brands (e.g., Berry 1994).
Specifically, I examine two model configurations; first where I code treatment and control as a
dummy variable and second where I model the influence of ratings for the rated (treated) brands.
As USNWR is unlikely to select brands to rate randomly (see Doherty, Kartasheva, and Phillips
(2012) for similar situation in the context of credit rating agencies), my primary identification
challenge concerns strategic allocation of brands to treatment (i.e., rated) and control (i.e., not
rated) conditions. I address this challenge by using a mix of control variables, fixed effects, and
instruments.
Overall, I find the USNWR ratings influence demand with evidence suggesting search
cost reductions and quality signaling are the two underlying mechanisms. My economic value
calculations suggest that the presence of USNWR meta-report card adds $10.53 per customer on
an average with this value ranging from $2.90 to $16.89 between 2007 and 2012. This average
value of $10.53 per customer is also suggestive of the price that USNWR could charge for Best
Cars Guidebook (currently it is free and relies on advertising for revenue), which is consistent
Best Business Schools, Best Colleges, and Best Hospitals Guidebooks respectively;
www.usnews.com). The effect size for actual rating (as opposed to whether one is rated or not) is
economically meaningful as well. One standard deviation increase in rating (the standard
deviation is .58 for USNWR ratings on a 10-point scale) amounts to $3560 more in price and
savings of around $12 Million on advertising. A comparison with other ratings suggests that
USNWR coefficient is 1.13 and 1.18 times higher than Consumer Reports and JD Power
respectively, which one should expect for a meta-report card.
My research closely relates to the literature on product report cards and metasearch
portals. Scholars have studied product report cards, which represent credible third party
performance disclosures, in diverse contexts such as healthcare plans (Wedig and Tai-Seale
2002), real estate (Figlio and Lucas 2004), and restaurants (Jin and Leslie 2003), among others.
Unlike product report cards that create and introduce information to reduce uncertainty,
meta-report card synthesize existing information. Recognizing that the value of information increases
when information is organized, synthesized, and judged (Taylor 1982), I add to the literature on
product report cards by investigating the value of a meta-report card. Similar to meta-report
cards, metasearch portals (e.g., Expedia) synthesize information but also facilitate sales (unlike
meta-report cards). Thus, research on metasearch portals relies on linking search results to
consumer behavior (e.g., clicks/purchases; Ursu 2017) and explores search cost reduction as the
underlying mechanism (e.g., Chen and Yao 2016). I build on this metasearch literature in three
ways. First, I study automobile purchases as opposed to travel purchases, where the search
process is more time consuming and costly (few weeks compared to a few hours). Second, I use
Book) in addition to the meta-report card. Third, I explore quality signal mechanism in addition
to search cost reduction mechanism.
I organize the remainder of this manuscript as follows. In section 2, I discuss the relevant
literature and juxtapose the study’s contributions to the literature. In section 3, I describe data
and in section 4, I elaborate on model specification and identification strategy. In section 5, I
present model free evidence and model-based results. I conclude with section 6 by discussing the
contributions and limitations of my research.
Related Literature
From the study’s perspective, meta-report cards should meet two conditions: synthesize
(as opposed to create) information and should not sell products to consumers directly. I know of
no existing studies of meta-report cards, so I turn to related literature on product report cards and
metasearch portals.
Product Report Cards
Product report cards refer to the credible third party performance disclosure in the form
of ratings/rankings/reviews of alternatives in a product category. The value of product report
card lies in the reduction of the information uncertainty by providing heretofore unavailable
information to consumers, a precondition to accommodate the use of any new piece of
information (e.g., Lawrence 2012). For example, in his study on determinants of information
value, Hilton (1981) argues for a decision maker with a given wealth, risk aversion, and situation
flexibility, uncertainty is the key determinant of the value of information.
There is already a rich and growing research regarding the value of information imparted
by product report cards, especially in the service industry and for experiential goods. For
plan report cards were introduced to federal employees (Wedig and Tai-Seale 2002), General
Motor employees (Scanlon et al. 2002), and Harvard employees (Beaulieu 2002); common
finding suggests that better rated plans enjoy higher demand. In real estate, Figlio and Lucas
(2004) find that real estate values improve when the school report card rating improves. For
restaurants, Jin and Leslie (2003) find that hospitalizations from food-borne diseases declined by
20 percent after Los Angeles County posted restaurant hygiene report card ratings in 1998 as
consumers started choosing restaurants that are more hygienic. For movies, Reinstein and Snyder
(2005) exploit the timing of movie critics to identify the impact on box office sales and find that
narrowly released movies benefit the most from positive ratings from critics.
I contribute to the literature on product report cards by studying the value of meta-report
cards. While product report cards reduce information uncertainty by providing information
heretofore unavailable to consumers, meta-report cards reduce the uncertainty by synthesizing
information from multiple sources, including incumbent report cards. Thus, I build on Taylor’s
(1982) premise that information becomes more valuable when it is organized, synthesized, and
judged. For example, in academia, information synthesis done usually in the form of a domain
meta-analysis is considered to be one of the most valuable contributions a researcher can make
(Goldschmidt 1986). Notably, most of the extant literature on information synthesis is conceptual
in nature with little empirical scrutiny; I provide this scrutiny.
Metasearch Portals
Metasearch portals are web portals, such as, Expedia and Travelocity, which gather
information from multiple sources (like meta-report cards) and allow consumers to make
purchase on these portals (unlike meta-report cards). There are a handful of articles on these
where the key research objective is to estimate the effect of the rank order of brands on consumer
clicks and/or purchases. For example, Chen and Yao (2016) find that refinement of options based
on product attributes significantly influences consumer welfare by facilitating matching.
Similarly, De los Santos and Koulayev (2017), Ghose, Ipeirotis, and Li (2014), and Ursu (2017)
find that information portals, such as Travelocity and Expedia, influence consumer clicks and
transactions through their ranking mechanisms.
As metasearch portals sell products, typical research on these portals uses individual level
data to link search results to consumer behavior (e.g., clicks); in contrast, I rely on aggregate
market level data and model information from rating sources (such as consumer reports) other
than the meta-report card. I also study a higher involvement product category (i.e., automobiles
as opposed to hotels and airline tickets), where the search process is likely to be more time
consuming and costly (e.g., hours as opposed to a weeks). I build on the literature on metasearch
portals that examines search cost reduction as a mechanism to explore search costs mechanism.
Further, as ratings signal quality beyond objective product quality, I study quality signal as a
potential mechanism for the influence of meta-report card on demand.
Data Description
To collate a comprehensive dataset, I gathered data from diverse sources on automobile
price, advertising spends, automobile features, automobile ratings, and USNWR meta-report
card. As a result, I gathered a panel data on 447 automobile brands (where a brand is at the
make-model level, e.g., Ford Taurus, Honda Civic) from 2004 to 2012; my dataset includes 85%
to 90% of the automobile brands (in terms of share and number of registrations) sold in the
observations at the make (manufacturer) as well as type level respectively. In Table 2, I detail the
data sources and present descriptive statistics in Table 3.
(Please see Tables 2.1a, Table 2.1b, Table 2.2, and Table 2.3 on pages 41-43)
Marketing-Mix
I obtain manufacturer suggested retail pricing (MSRP) information from four sources:
Polk, Consumer Reports, Autoevolution.com, and Autotrader.com. For every brand (e.g., Honda
Accord), there are multiple alternatives available every year (e.g., Honda Accord LX and Honda
Accord EX). I collect price of the most basic alternative for each brand. I accessed the
information on advertising spending from Kantar Group’s Ad$pender database, which includes
information on aggregate dollar spending on TV, magazines, newspapers, radio, and internet.
The annual information is available at the make-model (i.e., Honda Accord) level.
Automobile Features
I access data on a comprehensive set of automobile features (29 features)4 from
Pluup.com to control for factors that can possibly influence demand. For every automobile
model, there are multiple alternatives available in the market, such as LX and EX models for
Honda Accord; thus, to be consistent, we collect features data of the most basic model for each
brand. Typically, the empirical literature on demand estimation in automobile category includes
three key automobile characteristics: price, fuel efficiency, and some measure of size such as
height or width (e.g., Lave and Bradley 1980; Sudhir 2001). Along with these three basic
characteristics, some researchers have expanded the list to incorporate, horsepower or
acceleration-time along with the weight of vehicle (Lave and Train 1979; Goldberg 1998) as a
4 We have automobile feature data on: engine cc, engine type, engine position, valves, horsepower, torque,
proxy for power of the vehicle. Berry, Levinsohn, and Pakes (1995) and a series of other papers,
such as Goldberg (1995), and Petrin (2002), also included information on wheelbase, automatic
transmission, front-wheel drive vs. all-wheel drive, and air conditioning using indicator
variables. Although I have access to an extensive list of 29 automobile brand features, there is
high collinearity among the features (e.g., power, torque, and acceleration). Thus, consistent with
extant research (e.g., Thatchenkary 2008), I only use a subset of these features: horsepower,
weight, and height that capture “performance” (speed and acceleration), width and weight variables that capture “safety,” and width and height that capture “size and comfort.” Other than
these, I have indicator variable for luxury/non-luxury automobile brands, i.e., 0 for luxury brand
and 1 for non-luxury brand. I also have a variable for generation change, with value 0 if the
generation of a brand in a year is same as the one in previous year, 1 otherwise; and I also
include a variable indicating age of the brand in terms of number of years since its initial launch
year in the U.S. market.
As an additional measure of quality, I use annual recalls data obtained from NHTSA, i.e., national highway traffic safety administration. A recall is described as: “When a manufacturer or
the National Highway Traffic Safety Administration determines that a car or item of motor
vehicle equipment creates an unreasonable risk to safety or fails to meet minimum safety
standards, the manufacturer is required to fix that car or equipment.” A manufacturer will have to
rectify or replace parts, if the recall is a safety recall, and to inform the vehicle owner of the
recall. We use data on the potential number of affected vehicles as the measure of recalls for a
Ratings Data
As mentioned earlier, I am exploiting the launch of the USNWR automobiles meta-report
card on the backdrop of incumbent ratings in the market. According to a study by J.D. Power
(2014),5 J.D. Power, Kelly Blue Book, and Consumer Reports, are the three most important
information resources consumers consider when researching the quality of automobile brands. I
include data on these automobile performance disclosure sources. Most of the automobile
manufacturer websites and offline dealer stores advertise the performance of their brands on
Kelly Blue Book yearly awards and J.D. Power reliability studies. I use the initial quality
score/predicted reliability score from J.D. Power (1-5 score), and the best cars awards (1/0 code
for award/no award) in various automobile segments from Kelly Blue Book. I also use the
overall road test rating (0-100 score) from Consumer Reports, which is a surrogate for the ‘existing consumer voice’ on the automobile brands in market (www.consumerreports.org). The
correlation between the incumbent ratings from J.D. Power and Consumer Reports is .30, an
evidence of variation in performance scores across brands and hence an opportunity for
information synthesis. I also include the automobile ratings of focal interest, i.e., ratings on
USNWR automobile meta-report card about overall performance of automobile brands on 1-10
score (correlation of USNWR ratings is .36, .47, and .21 with Consumer Reports, J.D. Power,
and Kelly Blue Book respectively). In Figure 2.3, I show the density plot of ratings, while in
Figure 2.4, I present the screenshot of the USNWR report card on usnwr.com (assessed
December 2017).
(Please see Figure 2.3, 2.4 on page 52)
Model Specification
In this section, I specify the econometric model to estimate the economic value of
meta-report cards in the following section, which is followed by a discussion on identification
challenges and strategy in section.
Consumer Demand and the Value of Meta-Report Cards
I specify an aggregate nested-logit model of demand, akin to model by Berry (1994), and
use this model to estimate the economic value of the meta-report card (Train 2009).
Demand Model
For a market with 𝑏 = 1, … , 𝐵 automobile brands (where I represent year as 𝑡 = 1, … , 𝑇),
I conceptualize the mean utility level for brand b as the ratio of log of the brand share 𝑠𝑏𝑡 to the share of outside alternative 𝑠0𝑡 at time 𝑡 (Berry 1994). As Berry (1994) discusses, when
consumer tastes are identically and independently distributed, only mean utility differentiates the
brands. The mean utility is specified as a function of observed automobile brand features (𝑥𝑏𝑡),
price (𝑝𝑏𝑡), and unobserved brand attributes (𝜉𝑏𝑡; i.e., brand specific information uncertainty). As
is often the case (e.g., Honka 2014; Sudhir 2001), I augment this specification by including other
demand influencers, i.e., advertising spending (𝑎𝑏𝑡), incumbent ranking (𝑤𝑏𝑡; i.e., Consumer
Reports, J.D. Power Ratings, and Kelly Blue Book), and indicator variable takes the value 1 for
brands rated in USNWR (𝑈𝑆𝑁𝑏𝑡).
(1) ln (𝑠𝑏𝑡/𝑠0𝑡) = 𝛽𝑥 𝑥𝑏𝑡+ 𝛽𝑝 𝑝𝑏𝑡+ 𝛽𝑎𝑎𝑏𝑡 + 𝛽𝑤 𝑤𝑏𝑡+ 𝛽𝑢𝑈𝑆𝑁𝑏𝑡 + 𝜉𝑏𝑡.
where, the β coefficients represent the influence of the respective variables; my interest is in 𝛽𝑢, which if positive and statistically significant implies value of meta-report card to consumers. The
market shares 𝑠𝑏𝑡 and 𝑠0𝑡 are defined by using number of households in the U.S. in a given year
In the above model specification, distributional assumption on the error term 𝜉𝑏𝑡 enables
one to estimate the model. As the substitution patterns for logit errors suffer from independence
of irrelevant alternatives issues (e.g., Train 2009), I use the nested logit specification, which allows correlations among consumer tastes across ‘competing’ brands (e.g., Berry 1994). Under
this specification, the decision process that generates demand follows a nested structure, i.e.,
consumers choose an automobile type first (sedan, compact cars, sports car, SUV, pick-up trucks
etc.) followed by the brand (Highlander, CR-V, R8). Thus, I divide the brands into 𝑔 =
0,1,2 … 𝐺 groups (see Table 2) with 𝑔 = 0 being the outside alternative.6 Following Berry (1994,
p. 253) one can transform the logit equation (1) into a nested logit equation by adding a
term ln (𝑞̅𝑏|𝑔), the log of within group share where group is defined based on the automobile
segment.
(2) ln (𝑠𝑏𝑡/𝑠0𝑡) = 𝛽𝑥 𝑥𝑏𝑡+ 𝛽𝑝 𝑝𝑏𝑡+ 𝛽𝑎𝑎𝑏𝑡 + 𝛽𝑤 𝑤𝑏𝑡+ 𝛽𝑢𝑈𝑆𝑁𝑏𝑡 + 𝜎 ln(𝑞̅𝑏|𝑔) + 𝜉𝑏𝑡
The model in equation (2) represents a linear demand equation that accommodates the
pre-launch and post-launch period of USNWR to estimate the effect of meta-report card on
consumer demand. Thus far, I only model whether a brand is rated or not. To assess the impact
of ratings, only for brands that the meta-report card rates, I specify a similar model, where I
model the ratio of log of shares but only for the rated brands. Thus, this model estimates the
effect of unit change in rating for the rated brands. Specifically:
(3) ln (𝑠𝑏𝑡/𝑠0𝑡) = 𝛾𝑥 𝑥𝑏𝑡+ 𝛾𝑝 𝑝𝑏𝑡+ 𝛾𝑎𝑎𝑏𝑡 + 𝛾𝑤 𝑤𝑏𝑡+ 𝛾𝑟𝑅𝑏𝑡 + 𝜂 ln(𝑞̅𝑏|𝑔) + 𝜇𝑟𝑏𝑡, 𝑖𝑓 𝑈𝑆𝑁 = 1
6 For specificity, if we use 𝑖 to represent a utility maximizing consumer, then, similar to Cardell (1997), we can
where, 𝑅𝑏𝑡 denotes the USNWR meta-report ratings (1-10 scale), with 𝛾𝑟 as the corresponding
coefficient and 𝜇𝑟𝑏𝑡 is the nested logit error term.
Value of Information Synthesis
The primary benefit that USNWR meta-report card offers to consumers is the synthesis
of multi-source information, i.e., the systematic aggregation, evaluation, and presentation of
information in a form useful to consumers (Repo 1989). To evaluate the value of this information
synthesis, I use the “willingness to pay” definition of consumer surplus offered by Marshall
(1920), i.e., the excess monetary amount the consumers are willing to pay for meta-report card
given access to other information sources.
The automobiles market has multiple product report cards; for example, Consumer
Reports and J.D. Power that both publish new car quality scores (called Road Test Score and
Initial Quality Score respectively). Often these multiple report cards offer divergent information
that leads to an information uncertainty (e.g., in 2011, Toyota FJ Cruiser has 5 points (1-5 scale)
on J.D. Power Initial Quality Score and 36 points (0-100 scale) on the Consumer Reports Road
Test Score). The information synthesis offered by meta-report card holds the potential of
reducing information uncertainty, thereby enhancing consumer utility (Repo 1989).
I base my argument for the benefit of information synthesis on the assumption that
consumers are aware of the USNWR website for automobile meta-report card. Similar to
Armstrong and Zhou (2009), I offer two points of defense for this assumption. First, rational
consumers would access the USNWR meta-report card before approaching other information
sources, which are likely to be the inputs to meta-report card. Second, bounded rational
consumers should be susceptible to information presentation formats (e.g., Dranove and Jin
consumers are likely to view the meta-report card and thereby rely on the synthesized
information.
Formally, the economic value of information synthesis represents the money that a
consumer may be willing to pay to obtain the USNWR meta-report card. It is the incremental
utility, in dollar terms that a consumer receives due to change in choice situation in a regime
where USNWR meta-report card exists.Alternatively, from USNWR’s perspective, economic
value is the price-point that USNWR might want to choose if it plans to sell its automobile
ratings. For my nested-logit model specification, I represent the expected value of economic
value of information synthesis (𝐸𝑉𝐼) as (e.g., Small and Rosen 1981):
(4) 𝐸(𝐸𝑉𝐼) = (1/𝛽𝑝 ) ∗ [𝑙𝑛 (∑𝐽𝑗=0exp(𝑉𝑈𝑆𝑁𝑊𝑅=1) − 𝑙𝑛 (∑𝐽𝑗=0exp(𝑉𝑈𝑆𝑁𝑊𝑅=0)] ,
where the utility is linear in price (income) coefficient 𝛽𝑝 , the term 𝑉𝑈𝑆𝑁𝑊𝑅=1 refers to the
measurable portion of utility derived from the brands when USNWR meta-report is available,
and 𝑉𝑈𝑆𝑁𝑊𝑅=0 refers to the measurable portion of utility derived from brands when the report
card is unavailable. The division by the marginal utility of price, i.e., 𝛽𝑝 , translates it into
dollars. Since only a part of utility is measured/observed, i.e., 𝑉, I am able to calculate the
expected value of information, where the expectation is over all possible values of 𝜉𝑏𝑡.
Identification Challenges and Strategy
In equations (2) and (3), there could be omitted variables that correlate with critical
independent variables that result in identification challenges. These challenges fall under four
categories: (1) endogeneity of treatment (brand being rated vs. not-rated) that concerns 𝛽𝑢
coefficient, (2) endogeneity of the brand rating that concerns 𝛾𝑟 coefficient, (3) endogeneity of
(4) endogeneity of nested-logit term. For each of these variables, I first discuss the potential
reasons that could lead to endogeneity concern followed by my identification strategy.
Endogeneity of Treatment
USNWR’s decision on which brands to rate (i.e., treat) is unlikely to be random or
non-strategic as USNWR has a profit motive. Based on my understanding of the research context, I
believe that there are three rules USNWR likely uses to decide which brands to rate. First,
USNWR might rate brands in a specific segment in order to provide comprehensive ratings
within segments. The choice of segment is likely to be strategic such that USNWR might choose
popular segments to rate in order to garner higher traffic for its website. Empirical evidence
points to such selection, where, for example, I find that the luxury automobiles brands are less
likely to be rated. Likewise, I find that the average price of rated brands is lower than the
not-rated brands (Figure 5). Second, as USNWR meta-report card relies on information existing in
the market (e.g., incumbent report cards), as information on a brand increases, the likelihood of
the brand being rated should also increase. Thus, brands that are newly launched and brands that
see a generational changes (which happen every 4-7 years for most brands) should be less likely
to be rated. Third is the brand popularity, i.e., USNWR could rate popular automobile brands, as
customers are more likely to seek these brands and therefore more likely to rely on USNWR
ratings (see Doherty, Kartasheva, and Phillips (2012) for similar issue concerning credit rating
agencies).
I use control variables to correct for the first two rules. First, for USNWR tendency to
rate specific segments, I include segment-specific fixed effects and luxury/non-luxury indicator
variable in the demand model (equation 2). Likewise, for information available in the market, I
demand model. For the third rule that concerns brand popularity, I use an instrumental variable
approach wherein I use the lagged sales of the brand as the excluded variable. The lagged sales
(𝑧𝑖) satisfies the exclusion restriction criteria because the utility derived from a brand depends on
its characteristics and not on the past sales per say.
Since treatment is a binary endogenous variable, 2SLS instrument variable approach used for linear model becomes a ‘forbidden regression’ (Angrist and Pischke 2009, p. 190).
Consequently, I use the three-step approach instrumental variable that Wooldridge (2002, p.
623-625) and Angrist and Pischke (2009, p. 191) advocate. In the first step, I estimate a probit
regression of the endogenous treatment variable on the exogenous variables in equation (2)7 and
lagged sales, my instrumental variable. In the second step, I estimate a least squares regression of
the endogenous treatment variable on the exogenous variables in equation (2) and the predicted
probabilities from first step. In the final step, the outcome variable ln (𝑠𝑏𝑡/𝑠0𝑡) is regressed on
the exogenous variables and the predicted values from second step – as is typical final step for
instrumental variable regression. The intermediate step in this approach allows us to employ a
non-linear probability for the assignment of the treatment but does not impose distributional
assumption for the probability model (Basinger and Ensley 2010).
As a robustness check, I also use the Heckman (1979) style approach for treatment
endogeneity correction, which is a two-step approach. The first stage is a probit model, similar to
previous approach. I use the result from first stage regression to compute the inverse Mills ratio
(𝜆), which I include in the demand model as a covariate. As I elaborate subsequently, the results
are consistent across the instrumental variable and Heckman style approaches.
Endogeneity of Brand Rating
For the brand rating model (equation 3), omitted time varying brand-specific variables
could result in correlation between brand rating 𝑅𝑏𝑡 and the error term. I use a combination of
fixed effects and time varying covariates to proxy such omitted variables. First, I use a
comprehensive set of automobile features and incumbent brand ratings. In an alternate model, I
also use number of brand recalls to further proxy any quality related time varying omitted
variable. Second, I include ‘make’ fixed effects (e.g., Ford, Honda, Acura, etc.), to account for
make level time invariant quality and year fixed effects to account for time trends, including
change in rating policy.
Endogeneity of Marketing Mix
USNWR might choose the brands to rate based on their marketing mix variables, i.e.,
price (𝑝𝑏𝑡) and advertising spends (𝑎𝑏𝑡). The primary goal of USNWR is to generate viewership
for the meta-report card. As more individuals buy lower priced and more advertised brands (e.g.,
Iizuka and Jin 2005; Manchanda, Rossi, and Chintagunta 2005), USNWR viewership should be
higher if lower priced and more advertised bards are rated. I propose to correct for the price and
advertising endogeneity using an instrumental variable approach.
Following Berry, Levinsohn, and Pakes (1995), for price I use average of the
characteristics of other brands in the nest as the focal brand as the instruments. The instrument
meets the relevance condition because the characteristics of brands in a particular automobile
segment should correlate with its price. The instrument meets the exclusion restriction because
Chintagunta, Gopinath, and Venkataraman (2010), for advertising spends I use future advertising
spends as the instrument. Consistent with the instrument relevance condition, current advertising
spends should correlate with advertising spends in future. However, since the utility for
consumers at time 𝑡 should not be influenced by advertising spends at time 𝑡 + 1 or later; the
instrument meets the exclusion restriction. Further, as I include covariates for a rich set of brand
attributes and fixed effects (make and time fixed effects), in conjunction with the instruments,
endogeneity of price and advertising spends should be obviated.
(Please see Figure 2.5 on page 53)
Endogeneity of Nested Logit Term
In equations (2) and (3), the nest term i.e., 𝜎 ln(𝑞̅𝑏|𝑔) or (𝜂 ln(𝑞̅𝑏|𝑔)) term is endogenous
because any unobserved variable that impacts demand of a brand also impacts the within nest
share of that brand (Berry 1994). I use the log of price and non-price automobile attributes of
other brands within the group as instruments to correct for this potential endogeneity issue (as in
Berry 1994). Incorporating all changes discussed, leads to rewriting equations (2) and (3) as:
(5) ln (𝑠𝑏𝑡/𝑠0𝑡) = 𝛽𝑥 𝑥𝑏𝑡+ 𝛽𝑝 𝑝𝑏𝑡+ 𝛽𝑎𝑎𝑏𝑡 + 𝛽𝑤 𝑤𝑏𝑡+ 𝛽𝑢𝑈𝑆𝑁𝑏𝑡 + 𝜎 ln(𝑞̅𝑏|𝑔) + 𝜔𝑡+
𝑚𝑏+ 𝜉𝑏𝑡
(6) ln (𝑠𝑏𝑡/𝑠0𝑡) = 𝛾𝑥 𝑥𝑏𝑡+ 𝛾𝑝 𝑝𝑏𝑡+ 𝛾𝑎𝑎𝑏𝑡 + 𝛾𝑤 𝑤𝑏𝑡+ 𝛾𝑟𝑅𝑏𝑡 + 𝜂 ln(𝑞̅𝑏|𝑔) + 𝜛𝑡+ ℳ𝑏+
+ 𝜇𝑟𝑏𝑡, 𝑖𝑓 𝑈𝑆𝑁 = 1.
where, 𝜔𝑡 and 𝜛𝑡 are time fixed effects and 𝑚𝑏 and ℳ𝑏 are make fixed-effects for treatment and
Results
Model Free Evidence
To provide the model free evidence I explore the relationship between sales (and sales
growth) for brands that are rated/not-rated brands and correlation of sales (and sales growth) with
the rating score itself. First, across the years since the launch of USNWR meta-report card,
automobile brands that are rated in the meta-report card, on average have significantly higher
sales than the brands which are not rated in that year (Figure 6 and Table 4 Column 1: 𝛽𝑢 =
.388, 𝑝 < .01). Similar findings emerge for sales growth in a comparison of rated brands with
not-rated brands (Table 4 Column 2: 𝛽𝑢 = .295, 𝑝 < .01). Second, as I see from Figure 7 (also
see Table 4 Column 3: 𝛾𝑟 = .324, 𝑝 < .01), brands with higher ratings do have higher sales
associated with them; further, ratings also positively correlate with change in sales (Table 4,
Column 4: 𝛾𝑟 = .003, 𝑝 < .10).8
(Please see Figure 2.6 and 2.7 on pages 53-54)
Model Based Evidence
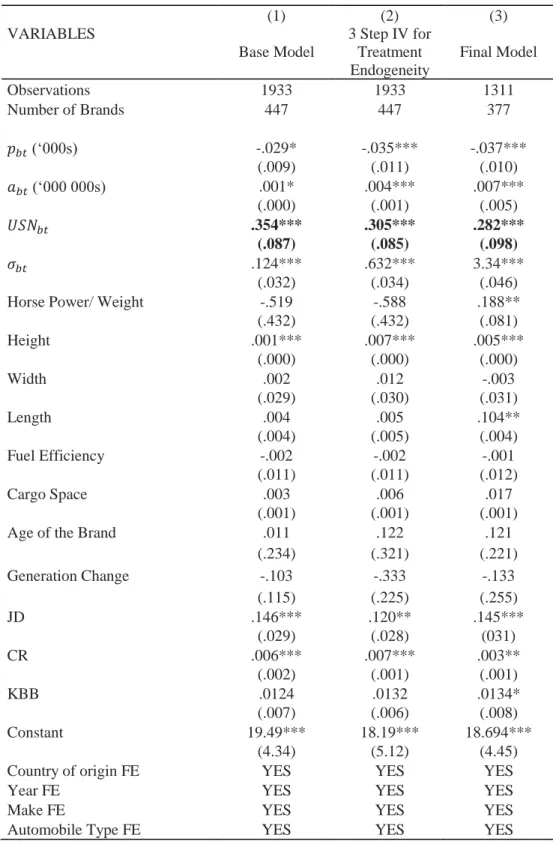
In Table 2.5, I present the findings from the nested logit model (equation 5), where log of
the ratio of brand share to share of the outside option is the dependent variable. Results show that
the availability of the USNWR report card is associated with higher brand share (𝛽𝑢 = .354, 𝑝 <
.01). This association exists for automobile quality information in the form of performance
disclosure from Consumer Reports, Kelly Blue Book, and J.D. Power, which accounts for the
performance, safety, comfort, reliability, and awards conferred to automobiles, and automobile
features. As expected, the price coefficient is negative and significant (𝛽𝑝 = −.029, 𝑝 < .10),
8 To examine how UNSWR meta-ratings relate to incumbent ratings (JD Power, Consumer Reports, and Kelly Blue Book), I ran a regression of USNWR meta- ratings on these incumbent ratings. The r-square of .47 for this
while advertising spends coefficient is positive and significant (𝛽𝑚 = .001, 𝑝 < .10). JD Power
dependability/reliability ratings are significant (𝛽𝑤=𝐽𝐷𝑃= .146, 𝑝 < .01), and so are the
Consumer Reports ratings (𝛽𝑤=𝐶𝑅 = .006, 𝑝 < .01). In addition, the term pertinent to nested
logit model group-share is also positive and significant (𝜎 = .124, 𝑝 < .01) implying that there
are interactions between consumer choices and product characteristics.9
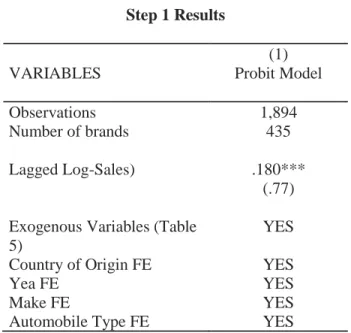
To get closer to causality, we first correct for the possible endogeneity owing to the
selective and staggered inclusion of brands in USNWR automobile ratings. Specifically, as we
discussed earlier, we use the three-step IV approach in the nested logit specification. In the three
step approach, we first estimate a first stage probit model with treatment dummy variable as the
dependent variable and lagged log-sales (𝛽 = .180, 𝑝 < .01) probabilities as excluded variable
followed by a linear regression with predicted probabilities (𝛽 = .323, 𝑝 < .05) from fist stage
and the excluded variable (𝛽 = .008, 𝑝 < .10). In the third step, we include the fitted values of
the endogenous variable (instead of endogenous variable itself) in the demand equation. This
correction reduces the magnitude of 𝑈𝑆𝑁 coefficient, but it is still statistically significant (𝛽𝑢 =
.305, 𝑝 < .01). We also did the robustness check, wherein we used the Heckman correction for
treatment endogeneity correction. We find the treatment coefficient to be positive and significant
(𝛽𝑢 = .721, 𝑝 < .05).
We also correct for endogeneity of price and advertising spends and the nested-logit term
using established instrumental variable approaches. As I see from Table 2.5 Column 3, the
𝑈𝑆𝑁 coefficient reduces in magnitude but it is still statistically significant (𝛽𝑢 = .282, 𝑝 < .01).
In contrast, the coefficients for advertising spends (𝛽𝑎 = .007, 𝑝 < .01) and price (𝛽𝑝 =
−.037, 𝑝 < .01)10 increase in magnitude. These parameter estimates are mostly consistent across
all the models and past studies for automobiles.11
(Please see Tables 2.5, 2.6, and 2.7 on pages 45-47)
Value of Information Synthesis
Using the estimates in the nested-logit demand estimation given in Table 2.5, Column 3,
we estimate the value of information synthesis associated with introduction of USNWR
meta-report card; specifically, we obtain the value of the measurable utility terms 𝑉𝑡𝑟𝑒𝑎𝑡=1
and 𝑉𝑡𝑟𝑒𝑎𝑡=0 . We find that introduction of meta-report card leads to the consumer gain of $10.53
(average over years 2007-2012).
We calculate value of information synthesis (using equation 4) for all years 2007-2012,
and quantified value ranges from $2.90 to $16.89, with the average value (over years) narrowing
to $10.53. A potential reason for value to increase over years is that the number of brands that
are ‘treated’ increase over years, which makes the additive term 𝑙𝑛 (∑𝐽𝑗=0exp(𝑉𝑈𝑆𝑁𝑊𝑅=1) larger
and the term 𝑙𝑛 (∑𝐽𝑗=0exp(𝑉𝑈𝑆𝑁𝑊𝑅=0) smaller.
Ratings and Demand
The alternatives rated higher are more attention catching and connote higher quality than
lower rated brands (Armstrong et al. 2009). In this section, we estimate demand equation (6), for
10 Whenever there is a positive demand shock (i.e., demand shifts outward), price goes up. This shift should lead to upward bias for the price coefficient.Thus, after the endogeneity correction, as expected, the coefficient of price has become more negative. Since, likelihood of treatment (i.e., brands be rated) declines with increase in price (see Figure 5.) the direction of bias for treatment dummy (i.e., USN for brands rated/not-rated) should be in opposite direction to that of price. Consistently, the coefficient for USN drops to .282 from .305.
11 In the meta-analysis on advertising elasticities, Henningsen, Heuke, and Clement (2011) present average
brands that are rated, i.e., 𝑈𝑆𝑁 = 1. For these rated brands we find that one unit increase in
ratings (where ratings range from 1 to 10) is associated with .329 ( 𝛾𝑟 = .329, 𝑝 < .01 ) increase
in mean utility of brand (Table 2.8, Column 1). The size of this effect reduces to .254 (𝛾𝑟 =
.254, 𝑝 < .01) in Table 2.8 Column 3, after we correct for selection bias and endogeneity of
marketing mix variables is addressed. On an average, one standard deviation (where SD = .58)
improvement on USNWR ratings enables a brand to charge $3560 more or save around $12
million on advertising. Compared to other product report cards, the effect of USNWR has 1.13
and 1.18 times more pronounced than Consumer Reports and J.D. Power respectively.
(Please see Table 2.8 on page 48)
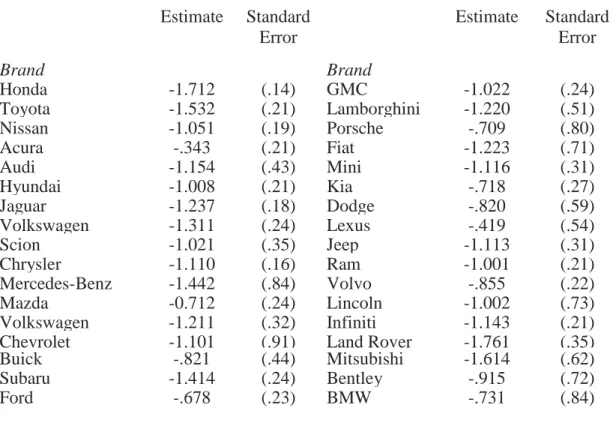
Behavioral Mechanisms
To explore the mechanism underlying the effect of ratings on demand, we study the
search cost reduction mechanism and quality assurance mechanism. As we do not observe
individual level search behavior and only observe the aggregate sales and other aggregate
measures at the brand level (e.g., price, marketing spends etc.), we identify search cost reduction
by examining situations when search costs are likely to change. Specifically, search costs should
increase as information from other sources decline. As advertising is an important source of
information, search efforts should decrease as advertising spends increase. Anecdotal evidence
seems to suggest this possibility. For example, according to the Statista Database (2017), Subaru,
Chevrolet, Infiniti, and Volkswagen are the four largest automobile T.V. advertising spenders
ensuring sizeable reach among consumers; in contrast, Ford, Lexus, Kia, and Toyota are the four
most searched brands online – these brands spend relatively less on advertising. Thus, we expect
spends decline. To test this assertion, we introduce an interaction term between USN and advertising spends (where the coefficients of interest is 𝛽𝑢𝑎):
(7) ln (𝑠𝑏𝑡/𝑠0𝑡) = 𝛽𝑥 𝑥𝑏𝑡+ 𝛽𝑝 𝑝𝑏𝑡+ 𝛽𝑎𝑎𝑏𝑡 + 𝛽𝑤 𝑤𝑏𝑡+ 𝛽𝑢𝑈𝑆𝑁𝑏𝑡 + 𝛽𝑢𝑎(𝑈𝑆𝑁𝑏𝑡 ∗ 𝑎𝑏𝑡) +
𝜎 ln(𝑞̅𝑏|𝑔) + 𝜔𝑡+ 𝑚𝑏+ 𝜉𝑏𝑡,
We find support for my assertion as 𝛽𝑢𝑎 is negative (Table 2.9, Column 1, 𝛽𝑢𝑎 =
−.038, 𝑝 < .01); thus, the value of a brand being rated decreases as advertising spends increase,
thereby supporting the search cost reduction mechanism.
As additional evidence for search cost reduction mechanism, we explore information
uncertainty among incumbent report cards as indicated by the standard deviation (𝛺𝑏𝑡) between
the scores of incumbent product report cards. The value of meta-report card should increase with
increase in uncertainty, i.e., standard deviation increases. Thus, we estimate the following
specification:
(8) ln (𝑠𝑏𝑡/𝑠0𝑡) = 𝛽𝑥 𝑥𝑏𝑡+ 𝛽𝑝 𝑝𝑏𝑡+ 𝛽𝑎𝑎𝑏𝑡 + 𝛽𝑤 𝑤𝑏𝑡+ 𝛽𝑢𝑈𝑆𝑁𝑏𝑡 + 𝛽𝑢𝛺(𝑈𝑆𝑁𝑏𝑡∗ 𝛺𝑏𝑡) +
𝜎 ln(𝑞̅𝑏|𝑔) + 𝛽𝛺 𝛺𝑏𝑡 + 𝜛𝑡+ ℳ𝑏+ 𝜉𝑏𝑡
Here again, we find support for search cost reduction mechanism. Specifically, as the
uncertainty increases, the value of the meta-report card increases (Table 2.9, Column 2 𝛽𝑢𝛺 =
.225, 𝑝 < .01).
(Please see Table 2.9 on page 49)
To explore the quality assurance mechanism, we argue that if the effect of ratings (on
1-10 scale) exists even if the objective quality of the automobile does not change, the positive
effect of ratings suggests the presence of quality assurance mechanism. We use two model
specifications, to establish quality assurance mechanism for ratings model: single generation
First, we estimate the model in equation 6 using a subset of data containing only one
generation of each make-model. A generation of an automobile brand refers to the number of
years for an automobile brand during which there are no substantial changes in its features.
Typically, a generation of an automobile brand lasts for 4-7 years, where during this period
observable (e.g., weight) and unobservable (e.g., design) brand characteristics do not change
substantially. For example, for Acura MDX, there are three generations in the time-period 2004
to 2012; however, there is not a major change in brand features over the three generations
2004-2005, 2006-2007, and 2008-2012. To exploit this constancy in objective quality of automobiles,
we only include data for the longest period where we do not observe a substantial change in its
features. For relatively newer brands (e.g., Honda Fit) in the market, we include observations for
later generations than the initial ones, because in the initial years more changes are likely.12 We
find that the effect of ratings still exit (Table 2.10, Column 1, 𝛾𝑟 = .362, 𝑝 < .05).
Second, in the recalls model, we use the number of make-model recalls in a particular
year as an additional controller of quality of the automobile. Here again, we find that the effect
of ratings is positive and statistically significant (Table 2.10, Column 2, 𝛾𝑟 = .132, 𝑝 < .05).
(Please see Table 2.10 on page 50)
Discussion
We begin by summarizing the insights of my research, followed by discussion on the
limitations, contributions, and conclusion. Given inundation of information sources these days,
12 In the demand equations 5-6, I include two types of fixed effects – manufacturer level fixed effects to control for the time-invariant omitted quality variables, and time fixed effects to control for industry specific time shocks. The key identifying assumptions underlying a fixed effects model are that (1) the omitted variable(s) are invariant over the time period of study, and (2) there is enough cross-sectional variation in the variables of interest and sales of automobiles to be able to estimate the effect. Typically, when the time dimension is short, the identifying