Karen Gerken
A dissertation submitted to the faculty at the University of North Carolina at Chapel Hill in partial fulfillment of the requirements for the degree of Doctor of Philosophy in the Department
of Sociology.
Chapel Hill 2016
Approved by:
Kathleen Mullan Harris
Y. Claire Yang Robert Hummer
Ted Mouw
ABSTRACT
KAREN GERKEN: THE DETERMINANTS AND HEALTH CONSEQUENCES OF SUBJECTIVE SOCIAL STATUS IN YOUNG ADULTHOOD
(Under the direction of Dr. Kathleen Mullan Harris)
Subjective social status (SSS) is becoming an increasingly relevant tool for sociologist and health researchers to investigate socioeconomic disparities and their associations with health.
Prior research has found a strong relationship between subjective social status and a variety of health outcomes. However, little is known about how exactly subjective status may be impacting
health in a way distinct from objective socioeconomic status. In order to better understand the
process by which SSS “gets under the skin” to create health disparities in a young adult cohort, this dissertation investigates not only the relationship between SSS and health, but also how SSS
is formed in young adulthood, and how relative subjective position is similar yet different from relative objective position. First, this dissertation further expands on the role early live objective
socioeconomic status has in continuing to shape subjective social status throughout the life course by connecting it to psychosocial mechanisms to previous explored in relationship to SSS.
Then, this dissertation examines how SSS in young adulthood is associated with a variety of objective health measures, including exploring how certain stress and health behavior
mechanisms may mediate the SSS-health relationship. Finally, a new measure of relative
ACKNOWLEDGMENTS
First, I’d like to thank my wonderful advisor and dissertation chair, Kathie Harris. Not
only did she provide a tremendous amount of support throughout this two-year long dissertation
process, she has also been a source of wisdom and encouragement for my entire graduate school career. She pushed me to be a great researcher, but never forgot that I was a person with feelings
and outside pressures as well. I admire her endlessly for that. An excellent committee also
supported this project. I’d especially like to thank Claire Yang and Bob Hummer for advising me not only on this work, but collaborating with me on outside projects and writing reference letters
on my behalf. Thank you both for advocating for me. And lastly to Ted Mouw and Mike Shanahan – thanks for all your comments on this dissertation.
My experiences at UNC have been shaped most by my fellow grad students, who were above all else some of my best friends and resources. To Courtney Boen and Kristen Schorpp, I
couldn’t have asked for two better people to work with (and more often than not, commiserate with). To my CPC officemates, particularly Andra Wilkinson and Anna Rybinska, I thank you
both for distracting me from work and motivating to get back to it. To all my 2011 sociology
cohort members, thank you for giving me the highest expectations of what success looks like and pushing me to reach it with empathy, not cutthroat competiveness. To my girls movie night
group, thank you for giving me hope about the future of women in academia and elsewhere, as
may not have known (or cared!) what in the world I study, but nonetheless encouraged me
endlessly to continue to do it. To Leslie, thank you for being the best friend and co-blogger I
could ever ask for – the Blonde Blog continues to keep my feet on the group and my life focused on the important things. To Caroline, I was so lucky to have had a freshman advisee turn the
tables and provide me with a wonderful source of advice and support herself. To Tom, thanks for
replying to my texts and trying to be a better brother and son. To Steve, for all the laughs and love and for the constant reminder that even a little brother can be a big source of strength and
wisdom. To my parents, who have been my biggest supporters my whole life, and for whom a few words cannot capture how grateful for all that they’ve done. I’m so proud to be your
TABLE OF CONTENTS
LIST OF FIGURES ... XII LIST OF ABBREVIATIONS ... XIII
CHAPTER 1. – INTRODUCTION ... 1
IMPORTANT CONCEPTS AND THEORETICAL FRAMEWORKS ... 3
Life Course Perspective ... 3
Subjective Social Status ... 5
Interrelationships between OSS, SSS and Health ... 10
RESEARCH QUESTIONS ... 11
Chapter Two ... 11
Chapter Three ... 12
Chapter Four ... 12
DATA ... 13
OPERATIONALIZATION OF SUBJECTIVE SOCIAL STATUS ... 14
CONTRIBUTION/SIGNIFICANCE ... 15
CHAPTER 2. - SUBJECTIVE SOCIAL STATUS IN YOUNG ADULTHOOD: EXPANDING THE COGNITIVE AVERAGING FRAMEWORK ... 19
INTRODUCTION ... 19
BACKGROUND ... 20
Cognitive Averaging and SSS Formation ... 20
Psychosocial Determinants of SSS ... 23
The Psychological Consequences of Unmet Expectations on Subjective Social Status ... 24
Subjective Social Status in Young Adulthood ... 24
Expanding the Concept of Cognitive Averaging ... 25
HYPOTHESES ... 26
DATA AND METHODS ... 27
MEASURES ... 28
Dependent Variable: ... 28
Independent Variables: ... 28
Controls: ... 32
RESULTS ... 33
DISCUSSION AND CONCLUSION ... 37
CHAPTER 3. - SUBJECTIVE SOCIAL STATUS AND PHYSIOLOGICAL DYSREGULATION IN YOUNG ADULTHOOD: MORE EVIDENCE FOR THE SOCIAL GRADIENT IN HEALTH ... 54
INTRODUCTION ... 54
BACKGROUND AND FRAMEWORK ... 55
Subjective Social Status and Health ... 55
Exploring Mechanisms of SSS, and Health across the Early Life Course ... 58
HYPOTHESES ... 61
DATA,MEASURES AND METHODS ... 62
Data ... 62
Mechanism Variables: ... 65
Methods ... 66
RESULTS ... 67
DISCUSSION AND CONCLUSION ... 70
CHAPTER 4. - RELATIVE SOCIOECONOMIC STATUS IN CONTEXT: IS PERCEIVED OR ACTUAL STATUS MORE IMPORTANT FOR YOUNG ADULT HEALTH? ... 89
INTRODUCTION ... 89
BACKGROUND ... 90
Three Theories of Socioeconomic Disparities in Health ... 90
Testing the Relative SES Hypothesis with Relative Objective and Subjective Status ... 93
The Importance of Context for the Operationalization of Relative Objective Status ... 96
Relative Objective Status and Health ... 97
RESEARCH AIMS ... 98
HYPOTHESES ... 99
MEASURESFROMADDHEALTH ... 99
Biomarkers ... 99
Operationalizations of Socioeconomic Status ... 100
Control Variables: ... 103
METHODS ... 103
RESULTS ... 104
DISCUSSION AND CONCLUSION ... 108
Table 2.1: Sociodemographic Variables (N = 10,895) ... 45
Table 2.2: Objective Socioeconomic Status Variables (N = 10,895) ... 46
Table 2.3: Psychosocial and Other Variables (N = 10,895) ... 47
Table 2.4: Mean Subjective Socioeconomic Status, by Covariates (N = 10,895) ... 48
Table 2.5: Correlates of Subjective Social Status in Young Adulthood (n=10,895) ... 51
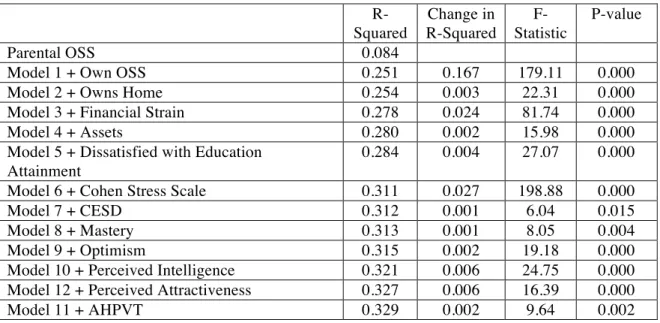
Table 2.6: Summary of Building Subjective Social Status Models (n=10,895) ... 53
Table 3.1: Sociodemographic Variables (N = 13,148) ... 76
Table 3.2: Objective and Subjective Socioeconomic Status Variables (N = 13,148) ... 76
Table 3.3: Other Variables, Mechanisms and Baseline Health (N = 13,148) ... 78
Table 3.4: Objective Health Measures (N’s vary by biomarker) ... 79
Table 3.5: Mean logCRP, by Covariates (N = 10,587) ... 80
Table 3.6: Mean Systolic Blood Pressure, by covariates (N = 11,874) ... 81
Table 3.7: Mean Body Mass Index, by Covariates (N = 12,097) ... 82
Table 3.8: Relationship between Objective and Subjective SES and logCRP (N=10,587) ... 83
Table 3.9: Relationship between Objective and Subjective SES and SBP (N=11,874) ... 85
Table 3.10: Relationship between Objective and Subjective SES and BMI (N=12,097) ... 87
Table 4.1: Descriptive Analysis of Variables in SBP Sample (N = 11,990) ... 113
Table 4.2: Correlations between RO, RS and AO ... 115
Table 4.3: Bivariate Relationships between RO and RS, (N = 10,895) ... 116
Table 4.4: Relationship between Relative Objective and Subjective Status and C- Reactive Protein (N = 10,690) ... 119
Figure 1.1: Ladder ... 17
Figure 1.2: Ladder Distribution ... 18
Figure 2.1: Conceptual Model ... 45
Figure 3.1: Conceptual Model ... 76
Figure 3.2: Mean Biomarker Values, by Ladder Score ... 117
Figure 4.1: Distribution of Deaton’s Formulation, by Reference Group ... 114
Figure 4.2: Relationship between a Standard Deviation Increase in Relative SES and logCRP, with 95% Confidence Intervals (N=11,990)* ... 120
AHPVT Add Health Picture Vocabulary Score
AO Absolute Objective
BMI Body Mass Index
CESD Center for Epidemiological Studies Depression Scale CRP C-reactive protein
DF Deaton’s Formulation of the Yitzhaki Index logCRP Log adjusted (C - reactive protein + 1)
OSS Objective Social Status
RO Relative Objective RS Relative Subjective
SBP Systolic Blood Pressure SES Socioeconomic Status
SSS Subjective Social Status
CHAPTER 1. – INTRODUCTION
Introduction
A person’s place within the hierarchy of the social stratification system matters a great
deal for a wide range of outcomes, including mental and physical health (Adler and Rehkopf, 2008; Braveman et al. 2010), life expectancy (Lynch et al., 1994; Phelan et al., 2004), academic
achievement (White 1982; Sirin 2005), residential location (Evans and Kantrowitz 2002), among
other life chances. Social stratification literature has used a number of criteria for determining location in the social structure, including a variety of objective measures of socioeconomic status
such as income, occupation, education and wealth (Braveman et al., 2005; Elo, 2009). It is fairly
well established that objective social status (OSS) matters for mortality and morbidity, among other outcomes, but how and why different OSS indicators matter is contentious (Adler et al.,
1994; Braveman et al., 2005; Link and Phelan, 1995; Winkleby et al., 1992). Part of the problem may be that despite the intercorrelation and predictive properties of OSS markers, no individual
measure can completely capture the multidimensionality and life course-spanning nature of social status.
On the other hand, subjective social status (SSS), or one’s own perception of their social standing, has long intrigued sociologists, public health researchers and psychologists for decades,
both as a theoretical construct and a tool in survey design (Jackman and Jackman, 1973; Kluegel,
et al. 1977; Operario et al., 2004). SSS likely captures a more accurate and nuanced
SSS processing requires a degree of social comparison, as one must reflect upon their relative
position in the social hierarchy. In the health disparities literature, there is emerging evidence
that suggests SSS is more strongly related to morbidity and mortality than OSS (Adler et al., 2000; Singh-Manoux et al., 2003; Singh-Manoux et al., 2005; Ostrove et al., 2000; Demakakos
et al., 2008). Overall, research on SSS as a comprehensive measure of position in the social
hierarchy has increased in the past decade. However, research on the determinants and consequences of SSS is scattered, mostly cross-sectional, and often derived from
non-representative studies of populations. To understand how SSS is internalized and related to health outcomes, among other things, we must first comprehend how SSS is formed and
experienced.
My dissertation aims to further elucidate the concept of subjective status, which I theorize
reflects a multidimensional and multilevel life course accumulation of social status. Using a nationally representative and longitudinal data set, I examine the determinants of SSS in young
adulthood, and the extent to which SSS, rather than OSS, is a better predictor of objective
measures of health, including immune, cardiovascular and metabolic functioning. I then examine how relative objective status relates to SSS and health, in addition to the extent to which
individuals accurately estimate their social ranking compared to a variety of reference groups.
This introduction describes the main theoretical background and motivations for my dissertation, the specific empirical questions I address, the data set I use, and how these papers contribute to
Life Course Perspective
I use a life course framework that generally argues early life conditions and contexts
matter for later life outcomes. Life course theories and frameworks have been utilized in a number of disciplines, including sociology, epidemiology and developmental psychology. To
investigate the causes, consequences and contexts of SSS, I integrate three disciplinary strands of
the life course perspective: the foundational life course perspective developed in sociology by Elder (1998), life course epidemiology (Ben-Shlomo and Kuh 2002) and the ecological model of
human development (Bronfenbrenner, 1979; Bronfenbrenner and Morris, 1998; Lerner, 2005). While related, each perspective contributes uniquely to the dissertation as a whole and
specifically in each individual chapter. Therefore, I outline here how each strand of the life course perspective is considered relevant to my entire dissertation.
Life course sociological theory aims to study human life across historical periods and individual ages, within many domains and in interaction with institutions and structural
characteristics. To understand later life outcomes, life course methodology examines early life
events and contexts and how they shape trajectories of growth, development and progress across the life course (Elder 1998). In addition, life course theory prioritizes the analysis of cohorts and
specific life course stages. Specifically, life course theory puts much emphasis on examining the
transitions between life course stages, key life events marked by change that are structured by social constraints and which have long-lasting implications (Elder 1998). Of these life course
class (Sweeney, 2002; Oppenheimer et al., 1997).
While life course sociology is the foundation for much of the life course perspective used
in this paper, I focus on life course epidemiology as the basis for the health elements of this dissertation. Life course epidemiology specifically focuses on how social and biological risks
interact across the life course to affect health, and how the accumulation of such risks, either
experienced all at once at one point in time and/or across time as individuals age, worsen health (Ben-Schlomo and Kuh 2002). In an epidemiological sense, the accumulation of risk means that
across the life course, people can be exposed to a number of risks that “get under the skin” to affect biological processes that emerge later as a health problem (Ben-Schlomo and Kuh 2002).
These risks, both physical and social, include environmental exposure to physical toxins and psychosocial stress, poor nutrition in childhood, low-quality schools and difficult family lives,
among others, that “get under the skin” by activating the physiological stress response (Evans et al., 2012; Seeman et al., 2001). When the stress response is activated occasionally and
appropriately, this is a healthy and normal response to acute stressors. However, chronic
activation leads to psychological dysregulation in the body, increasing inflammation and allostatic load (McEwen and Stellar 1993) resulting in premature aging, increased disease risk
and higher mortality (Seeman et al. 1997).
Life course perspectives, especially life course epidemiology, have paid special attention to sensitive periods in the life course, or stages in the life course that hold particular importance
for development (Elder, 1998; Ben-Shlomo and Kuh, 2002). Most research focuses on sensitive periods during fetal origins or very early childhood (Barker, 1995; Harding, 2001), but
with peers and in a larger social context (Harris, 2010; Steinberg and Morris, 2001). In
interacting with a wider social world, adolescents begin for the first time to compare their own
characteristics with those around them, developing their self-identity (Erikson, 1968; Marcia, 1993). This identity process stretches from adolescence through the transition to adulthood, until
identity formation tends to stabilize in young adulthood (see Kroger et al. 2010 for a
meta-analysis of ego identity solidification across the early life course).
Finally, life course frameworks also draw on an ecological, or “linked lives” perspective,
which acknowledges the importance of the social contexts and institutions in which human development occurs (Bronfenbrenner, 1979; Elder and Rockwell, 1979). Human development
and behavior may vary based on or depend on context; for example, parents use different parenting behaviors depending on the safety of the environment in which their family resides
(Hill and Herman-Stahl, 2002; Roche et al., 2007). Social context can refer to a number of environments in which people are imbedded, including place (neighborhoods, states, countries,
etc.), families and historical periods (Elder and Rockwell 1979). My papers focus on the
importance of many of those contexts and social structures, including family, neighborhoods, schools, and peers.
Subjective Social Status
Early sociological work on subjective status focused primarily on social class
identification, or one’s “perceived self-location in the SES structure” (Jackman and Jackman
1973). Interest in respondents’ attachment to social classes was in response to ideas about class consciousness, and how one acts upon their perceived class location with regards to political
1977; Kluegel and Smith, 1981). Typically, subjective social class was measured with categories
such as lower, working middle or upper class (Jackman and Jackman 1973).
Two major problems arise, however, when relying on categorical class identification to classify individuals (Goodman et al. 2003). First, we lose information regarding the full, linear
SES hierarchy, which is especially relevant to health research and step-wise health-SES
gradients (Elo 2009). Second, reliance on charged naming of categories such as “middle” or “upper” class may influence people’s selection of a social class, which may not accurately reflect
their perceptions of their standing. While some have utilized a measure of whether research subjects feel better, worse or about the same regarding their relative SES compared to various
communities (Wolff et al. 2010), a new linear measure has been growing in popularity to help people report their relative social standing (Singh-Manoux et al. 2003). The linear measure,
which asks people to report where on a ladder they’d place themselves, with the best-off people at the top rung and the least well-off on the bottom, has been used in numerous population and
health surveys across many countries (Adler et al., 2000; Singh-Manoux et al., 2003; Operario et
al., 2004).
Some may be critical of such a linear measure of social status, arguing that a gradational
perspective on social hierarchy ignores issues of class position and class conflict supported by
neo-Marxist theory (Kelly and Evan 1995; Wright 1985). Neo-Marxist theory rejects the notion that a gradational subjective social measure could be an accurate scale, arguing that ideas of
subjective social status are influenced by reference groups (Kelly and Evans 1995) and other concepts that influence class consciousness (Wright 1985). Therefore, these perspectives suggest
others and their subjective understanding of equality (Kelly and Evans 1995). Still, these
previous works have focused on class groupings rather than a linear scale. Furthermore, a recent
study on subjective social status in young adulthood found support for the gradient model of subjective social status (Nielsen et al. 2015). Therefore, while I acknowledge these critiques, I
choose to rely on the gradation explanation of social status, particularly for my measure
subjective social status, for the reasons discussed below.
A linear measure of subjective social status abandons the need for charged categories and
instead creates room for more nuanced and subtle differences in social status to be reflected. Instead of simply reporting the quantity of education, wealth or income, subjective linear
measures can allow individuals to report a social standing that may also reflect the quality of education (Ivy League versus community college), the stability of one’s income, and the
persistence of wealth over generations (Braveman et al., 2005; Schnittker and McLeod 2005). Some concern has arisen that SSS reflects something besides strict objective SES and instead
encompasses a number of psychological processes in addition to the cognitive averaging of one’s
OSS (Sign-Manoux et al., 2003; Cundiff et al., 2013). However, as I further explore in later sections, I argue that this internalizing and psychosocial process of self-status assessment makes
SSS a more ideal measure rather than a more flawed one, especially for health research.
Subjective Social Status in the Life Course: From Adolescence to Young Adulthood
Of the few papers that have examined determinants of SSS, only one has done so in
young adulthood (Nielsen et al 2015), even though this measure of SES may do a better job than traditional markers of OSS of capturing socioeconomic status in a life course stage marked by
of their age, both children (Goodman et al., 2001, 2003, 2007) and the elderly (Hu et al. 2005),
or by their marginalized status, such as prisoners (Friestad 2010). While these groups may not
have their own incomes or occupations, they still have a sense as to where they fit into the social hierarchy (Goodman 2007). I argue that, even though we can rely on these OSS measures for
young adults, they may still not be as important or reliable for this life course stage as they are
later in the life course. Recent attention has been given to the lengthening of the transition to adulthood, as individuals are delaying or abandoning all together the traditional markers of
adulthood, such as marriage, buying a home and childbearing (Berlin et al. 2010). Thus, SSS in young adulthood may do a better job measuring SES during a critical transition in socioeconomic
status during a life stage marked by fluid change and identify formation.
I also argue that research should pay attention to intra- and intergenerational processes
that begin in adolescence in order to better understand SSS formation during the transition to young adulthood, a period marked by substantial individual and contextual change. From a life
course perspective, adolescence can be thought of as a sensitive period for development such that
certain exposures, such as socioeconomic disadvantage and family instability, may be particularly detrimental with irreversible impacts later in the life course. Beyond the health
outcomes that life course epidemiology focuses on, I apply the concept of sensitive periods to
understanding the relative importance of past socioeconomic status exposures for the development of subjective social status during this critical transition from adolescence into
young adulthood.
Adolescence, the life course stage sandwiched between the dependence on parents of
the family-dominated contexts of childhood and into broader social institutions, peers and other
adult figures besides their parents begin to play a larger role in their lives (Larson and Richards
1991). Inside this larger social context, adolescents may begin to consider their place in the social hierarchy for the first time as they interact with people from different socioeconomic
backgrounds. Just as adolescents begin to develop their own sense of identity independent of that
of their parents’ as they transition to adulthood, they also begin to develop their own sense of socioeconomic status, and thus their own SSS.
Without their own occupations or income, adolescents first turn to their parent’s OSS as a proxy for their own, and SSS among adolescents is strongly related to the OSS of their parents
(Goodman 2007). Because adolescence is the first time individuals become aware of their
socioeconomic position, this begins to shape their perceptions of their SSS across the rest of their
life course. Easterlin (1973) found that fertility decisions in young adulthood were shaped by the extent to which young adults felt they had reached a certain level of economic success, for which
their parent’s economic status served as a reference point. The concept of sensitive periods
suggests that throughout the entire life course, the objective social status of one’s parents will continue to cast a long shadow on SSS perceptions, even as individuals transition into adulthood
and have their own OSS markers to include in their cognitive averaging processes.
Scholars have theorized that SSS is the accumulation of personal reflections of past, current and ideas of future status (Jackman, 1979; Hu et al., 2005; Ghaed and Gallo, 2007) and
thus the formation of SSS is by definition a life course process, as objective and subjective status likely accumulate and interact across the early life course to affect SSS in young adulthood. The
young adulthood. However, a more nuanced understanding of why parental background may
continue to matter for SSS across the life course remains to be seen. The cumulative advantage
framework (DiPrete and Eirich 2006) and the status attainment model (Blau and Duncan 1967) would suggest that people with high parental OSS are likely to reach their own high level of OSS
in young adulthood. Since their OSS was consistently high across the life course, these young
adults may place themselves higher on the SSS ladder than others with similar current OSS but less advantaged family socioeconomic backgrounds. On the other hand, status-maximizing
theory (Plutzer and Zipp, 2001; Yamaguchi and Wang, 2002) would posit that as people with high parental OSS enter young adulthood, even if their own relatively low OSS would suggest
otherwise, they might still consider their own SSS high. Similarly, those who are upwardly mobile would abandon the shadow of low parental OSS to rely solely on their own relatively
higher OSS to identify with a higher personal SSS in young adulthood. Interrelationships between OSS, SSS and Health
Currently, our understanding of the interrelationships between OSS, SSS and health
outcomes are largely drawn from small, non-nationally representative studies. Nonetheless, these findings are a good starting point for this dissertation. First, the literature has confirmed a strong
correlation between SSS and the three typical sociological components of SES, including
personal education (Ostrove et al., 2000; Operario et al., 2004; Wright and Steptoe, 2005; Dunn et al., 2006; Goldman et al., 2006; Ghaed and Gallad, 2007; Cohen et al., 2008; Demakakos et al.,
and Gallo, 2007; Demakakos et al., 2008).
Decades of research have confirmed an OSS gradient in health, such that increases in
education, income and occupational grade are all associated with better health, as measured by a number of health outcomes (see Elo 2009 and Adler and Rehkopf 2008 for reviews). Within the
past decade, public health researchers have found SSS to have similar, if not greater, associations
with health (Adler et al., 2000; Ostrove et al., 2000; Singh-Manoux et al., 2005; Demakakos et al., 2008). When mutually adjusting for both OSS and SSS, the subjective assessment of status
often persists as the stronger predictor of health outcomes. Perhaps this greater association between SSS and health is because while we know that OSS predicts a portion of SSS, there is
still plenty of unexplained variance in the correlates of SSS. I aim to explore this yet unexplained variance in SSS before connecting it to objective health markers and relative objective status in
young adulthood with a uniquely appropriate data set with a wealth of sociodemographic, psychological and behavioral data.
Research Questions Chapter Two
The first empirical chapter provides a clearer understanding of what social forces shape
one’s perceptions of social status. The previous research on this topic has mainly focused on
concurrent markers of OSS and their cross-sectional relationship with SSS (Singh-Manoux et al., 2003; Wolff et al., 2010). However, while SSS has been theorized to be a cumulative construct
that reflects the “cognitive averaging” of not only current status but also past status and future prospects, little empirical evidence is available to support this claim (Nielsen et al 2015). This
course will have important associations with the development of a SSS identity, which I argue is
a product of the accumulation of status over the life course. In additional, I find psychosocial
variables to be also associated with SSS, which leads me to hypothesize that the SSS cognitive averaging process does not happen in a vacuum.
Chapter Three
Social status has long been connected to morbidity and mortality. SSS has been linked to a number of diseases (e.g. diabetes, respiratory illness, hypertension and cardiovascular disease),
mental health, mortality and self-rated health. This relationship is often stronger than similar relationships between OSS markers and health outcomes (Singh-Manoux et al., 2005; Dunn et al.,
2006; Ghaed and Gallo, 2007). With the widespread and growing collection of objective
biomarkers of physiological regulation in data sets, attention has turned to examining how SES is
related to markers of immune, cardiovascular and metabolic function (Wolfe et al. 2012). Yet no one has examined the relationship between SSS and these biomarkers in a nationally
representative sample of young adults. This second paper examines the associations between
SSS and objective health biomarkers, and compares these to the associations between more traditional OSS measures of SES and the biomarkers. I find that SSS is more strongly related to
these objective health measures, an indication that subjective status “gets under the skin” early in
the life course even before disease emerges. Chapter Four
The final empirical paper will introduce a third conceptualization of socioeconomic position, relative objective rank, in order to better understand SSS and how SES in general “gets
the comparison of SSS to actual objective relative standing. Secondly, including a third set of
SES measures regarding the rank ordering of SSS and OSS will allow me to address whether
objective socioeconomic status or relative social standing is more important for health disparities. Data
This dissertation uses the National Longitudinal Study of Adolescent to Adult Health
(Add Health) for all three papers. Add Health is a nationally representative data set that originally sampled 20,754 students ages 12 - 18 from 132 middle- and high schools across the
country during the 1994-1995. The first wave of data collection includes an in-school survey, a more detailed in-home interview, a parent questionnaire and Census data based on the
respondent’s home address. Thus, I have a rich set of variables from the adolescence life stage, including information from parents, peers and school and neighborhood contexts. Three
additional waves of data were collected to follow the original cohort as they aged: Wave II (1995 – 1996), Wave III (2001 – 2002), and Wave IV (2008 – 2009). Biomarker collection was part of
Wave IV, and nearly every respondent has some objective measures of physical health available
to analyze. Others studies that have examined the determinants and consequences of SSS differentials have not been able to utilize a data set as rich and representative at Add Health.
Thus, I am able to paint a truly life course, multidimensional and intergenerational portrait of the
determinants of SSS with widely applicable accuracy.
I draw on data from two waves of Add Health, Waves I and IV, which reflect two life
course stages of interest: adolescence and young adulthood, respectively. Both waves have data on OSS markers that are specific to the life course stage. For example, in Wave I, when the
OSS. Because of the wide variety of socioeconomic variables measured across waves, I can
select appropriate measures of OSS as the life course stage requires, making this study a true life
course and intergenerational investigation, improving upon previous studies limited by cross-sectional data.
Other studies on similar topics have been limited by incomplete data available on either
OSS measures and/or health outcomes. For example, other studies may have only had current income and education as OSS indicators. Add Health, as described above, not only has a variety
of measures across the life course, but also has a breadth of OSS measures within each life stage, including income, education, occupation, home ownership, assets, and financial strain. Thus, I
expand on the variety of OSS markers that may be related to SSS formation. Secondly, the health information that Add Health contains is also immense compared to other studies. In addition to
self-rated health across all four waves, Add Health also contains information about health diagnoses, mental health and health behaviors. Most importantly, however, is the inclusion of
objective biomarkers in Wave IV, including C - reactive protein, systolic blood pressure and
body mass index. The availability of objective biomarkers is especially important in a young adult sample. While diseases typical to an older cohort may not yet have emerged at this young
life stage, the biomarkers can capture increased inflammation, thus signaling disease risk. Thus,
Add Health data provides a unique, expanded, multidimensional perspective on both the predictors and consequences of SSS dipartites.
Operationalization Of Subjective Social Status
To measure SSS in this paper, I use the MacArthur Scale of Subjective Social Status,
to be a valid and reliable construct for gauging SSS in a number of populations and has been
adopted into a number of surveys and studies (Singh- Manoux et al., 2003; Operario et al., 2004;
Goldman et al., 2006; Cundiff et al., 2013). In Add Health, a picture of a ladder is provided (see Figure 1.1) and the following question is posed to respondents: “Think of this ladder as
representing where people stand in the United States. At the top of the ladder (step 10) are the
people who have the most money and education, and the most respected jobs. At the bottom of the ladder (step 1) are the people who have the least money and education, and the least
respected jobs or no job. Where would you place yourself on this ladder? Pick the number for the step that shows where you think you stand at this time in your life, relative to other people in the
United States.” The distribution of the responses to the ladder measure, presented in Figure 1.2, is normal, with a mean of 4.97 and a standard deviation of 1.75.
Contribution/ Significance
This dissertation contributes to the broad discussion of how and when social stratification
pathways develop over the life course by focusing on a subjective measure of socioeconomic
status in young adulthood that, while increasingly common and useful, has yet to be fully elucidated, both independently as a construct and in relation to health and context.
First, my empirical investigation of the determinants of subjective social status adds to
the theoretical discussion of personal perceptions of social standing by investigating additional life course data, including objective measures of socioeconomic status of family background in
adolescence and the respondents own OSS during the transition to adulthood. For now, the idea that SSS is an accumulation of many socioeconomic and psychosocial experiences across the life
course and psychosocial variables than are mostly unavailable in other data sets.
Secondly, this paper adds further evidence of a health gradient along socioeconomic lines,
while further elucidating the process of how exactly low SES “gets under the skin” to worsen health. Others have theorized that the stress of low status is internalized which, in turn, increases
physiological dysregulation (Marmot 2004). And, while OSS markers can serve as proxies for
low status, there is no better way to measure how one perceives their own status than by measuring SSS. I find a relationship between low SSS and greater physiological dysregulation
that strengthens Marmot’s (2004) argument about the stress of low status resulting in negative health outcomes.
Finally, while a provisional relationship between low SSS and high morbidity and mortality has been explored, the relationship between subjective SSS and objective biomarkers
has yet to be thoroughly examined with a diverse, nationally representative data set. In addition, most studies have focused on later adulthood, once disease has manifested. By utilizing a
nationally representative sample of young adult, I plan to demonstrate that SSS disparities in
CHAPTER 2. - SUBJECTIVE SOCIAL STATUS IN YOUNG ADULTHOOD: EXPANDING THE COGNITIVE AVERAGING FRAMEWORK Introduction
Most sociological research today that involves socioeconomic status (SES) uses some
combination of the three typical markers of objective SES: income, education, and occupation. These objective SES (OSS) markers are most often included in social surveys and reflect
material resources that individuals draw on to affect their life chances. OSS is highly correlated with a number of important life outcomes, including mental and physical health (Adler and
Rehkopf, 2008; Braveman et al., 2010), life expectancy (Lynch et al., 1994; Phelan et al. 2004),
academic achievement (White, 1982; Sirin, 2005) and residential location (Evans and Kantrowitz 2002). However, not all social and economic disparities are related to access to absolute material
resources (CITE - Wilkinson, 1997, 1999; Marmot, 2004). Researchers have therefore begun to utilize people’s own assessments of their relative social status to examine social location and
inequality.
Subjective social status (SSS) reflects the socio-psychological worth of one’s perceptions
of their status. SSS is mainly thought to encompass one’s cognitive averaging of their various aspects of objective socioeconomic status (Singh-Manoux et al. 2003). SSS may also be more
useful for certain populations for whom typical objective SES measures may be inappropriate or
incredibly fluid, including adolescents, young adults, and the elderly (Goldman et al 2007). While some research has assessed the associations between objective SES measures,
unknown regarding how individuals arrive at their assessments of SSS. In this paper, I theorize that SSS is far more than a reflection of a person’s current and personal OSS. Instead, SSS
development is an intra- and inter-generational process that includes many dimensions of
objective socioeconomic status, psychosocial resources and personal self-confidence.
This paper aims to further explore the early life course determinants of subjective social
status in young adulthood within an expanded cognitive averaging framework using The
National Longitudinal Study of Adolescent to Adult Health (Add Health), a nationally
representative, longitudinal data set of a cohort of middle and high schools students in 1994 who
were ages 24-32 in the most recent wave of data collection. Drawing on a number of socioeconomic, demographic and psychological variables, I argue for the importance of
considering the psychological contexts and schemas in which the process of subjective social status development occurs.
Background
Cognitive Averaging and SSS Formation
The development of subjective social status is typically thought to occur through a
process that Singh-Manoux et al. (2003) refer to as “cognitive averaging.” People tend to combine assessments of their past, current and future economic prospects, as measured by
objective socioeconomic factors like education, income and occupation, in a cognitive average
that represents their SSS. Singh-Manoux et al. (2003), using the Whitehall sample of middle-age British civil servants, found little to no effect of psychosocial factors contributing to SSS above
Relationship between Current Objective and Subjective Socioeconomic Status
The majority of work regarding the determinants of SSS has utilized a cognitive
averaging framework, typically using some number of OSS variables to assess the association
between SSS and current income, education and occupation (Ostrove et al., 2000; Singh-Manoux et al., 2003;Operario et al., 2004; Dunn et al., 2006; Ghaed and Gallad, 2007; Wolff et al., 2010;
Andersson 2015; Nielsen et al. 2015). Each of these three elements of OSS is highly correlated
with SSS. Higher household income is related to higher assessments of SSS (Ostrove et al., 2000; Operario et al., 2004; Dunn et al., 2006; Ghaed and Gallad, 2007; Cohen et al., 2008;
Wolff et al., 2010; Cundiff et al., 2013; Andersson 2015; Nielsen et al. 2015). Higher educational attainment is also associated with higher SSS (Ostrove et al., 2000; Operario et al., 2004; Wright
and Steptoe, 2005; Dunn et al., 2006; Goldman et al., 2006; Ghaed and Gallad, 2007; Cohen et al., 2008; Demakakos et al., 2008; Wolff et al., 2010; Andersson 2015; Nielsen et al. 2015).
Aspects of one’s occupation, particularly prestige, autonomy and satisfaction, have also been assessed, mostly in the UK. These studies also tend to exhibit positive relationships between SSS
and occupational prestige and autonomy (Ostrove et al., 2000; Singh-Manoux et al., 2003;
Singh-Manoux et al., 2005; Ghaed and Gallo, 2007; Demakakos et al., 2008; Miyakawa et al. 2012; Andersson 2015; Nielsen et al. 2015).
While each indicator of personal objective SES has been found to correlate with SSS, the
relative importance of each measure has been debated in the literature. Some have found income to be a stronger predictor of SSS in comparison with education (Ostrove et al., 2000;
Singh-Manoux et al., 2003; Operario et al., 2004; Dunn et al., 2006; Wolff et al., 2010), while others have shown that education is more predictive of subjective status (Dunn et al., 2006; Ghaed and
examined; in the more homogenous and smaller samples, education appears to matters more (Wolff et al. 2010). In addition to these three traditional markers of OSS, a number of other
objective measures of SES are associated with SSS. Several studies have investigated
correlations between SSS and various measures of assets and wealth (Singh-Manoux et al., 2003; Goldman et al., 2006; Demakakos et al., 2008; Nielsen et al. 2015), family savings (Chen and
Patterson 2006), and home ownership (Wolff et al. 2010; Nielsen et al. 2015).
Despite the strong focus on how personal aspects of OSS are related with SSS, some studies have expanded the idea of “cognitive averaging” to include the current OSS of other
people proximate to the individual. In a sense, all previously mentioned studies involving
household income indirectly evaluate the extent to which the OSS of the entire household affects
individually assessed SSS (Ostrove et al., 2000; Operario et al., 2004; Dunn et al., 2006; Ghaed and Gallad, 2007; Cohen et al., 2008; Wolff et al., 2010; Cundiff et al., 2013). More overtly,
others have evaluated the extent to which one’s spouse’ education and occupation relate to their own SSS (Ostrove et al., 2000; Goldman et al.; 2006).
SSS across the Life Course: Inter- and Intra- Generational Processes
Nearly all of the previously discussed literature on the correlates of subjective social status has relied on cross-sectional analyses of current objective SES or psychosocial covariates
of SSS. The importance of the life course concept of the “cognitive averaging process”
(Singh-Manoux et al. 2003) draws not only on current SES but also future expectations and past experiences. As adolescents transition away from the family-dominated contexts of childhood
and into broader social institutions, peers and adult figures besides their parents begin to play a larger role in their lives (Larson and Richards 1991). Inside this larger social context, adolescents
begin to consider their place in the social hierarchy for the first time. Just as adolescents begin to develop their sense of identity (independent of their parents) as they transition to adulthood, they
also begin to develop their own sense of socioeconomic status, and thus their own SSS. While
young children necessarily rely on their parents OSS as a proxy for their own OSS (Goodman et al. 2007), parental OSS continue to position adolescents in social environments, such as schools
and neighborhoods (Massey and Denton, 1988; Jencks and Mayer, 1990) and extracurricular
activities and peer groups (Lareau 2003). These environments provide adolescents with reference groups for SSS comparisons across the rest of the early life course (Easterlin 1973).
Thus the objective social status of one’s parents, both directly as a reference point and indirectly as a structural determinant of educational and peer experiences, continue to cast a long shadow
on SSS perceptions, even as individuals transition into adulthood and have their own OSS markers to include in cognitive averaging processes.
Psychosocial Determinants of SSS
Research on how psychosocial factors relate to SSS has been less extensive than that on
the relationship between OSS and SSS, perhaps due to Singh-Manoux et al.’s (2003:1331)
declaration that the SSS development process “is not driven by psychological biases.” Indeed, their study of British civil servants aged 45 - 69 failed to find any association between
psychosocial variables and subjective status. It is true that the majority of psychosocial factors,
though significantly associated with SSS, are typically reduced to little or no effect on SSS when OSS variables are included in the analysis. Evidence for relationships between SSS and negative
affect (Adler et al., 2000; Operario et al., 2004), self-esteem (Chen and Paterson, 2006; Goodman et al., 2007; Lundberg and Kristenson, 2008), mastery (Lundberg and Kristenson
Kristenson, 2008), optimism (Chen and Paterson 2006), perceived control (Chen and Paterson 2006), discrimination (Chen and Paterson 2006), and hostility (Chen and Paterson 2006) have all
been examined, and few, if any, significantly predict SSS when accounting for objective
measures. Somewhere between objective and subjective, a number of variables relating to perceptions of the quality of one’s economic resources and occupation are also associated with
SSS. Perceptions about one’s financial situation have repeatedly been found to relate to SSS
(Singh-Manoux et al., 2003; Wright and Steptoe, 2005; Miyakawa et al., 2012; Andersson 2015). The Psychological Consequences of Unmet Expectations on Subjective Social Status
Singh-Manoux et al. (2003) theorized that SSS was derived from a process of “cognitive averaging” of not only current and past OSS markers, but also expectations of future OSS
attainment. Similarly, it is reasonable to expect that individuals are simultaneously assessing the extent to which they are currently meeting past expectations of OSS attainment, which is another
reason why early life, when these expectations begin to develop, may matter for SSS
development. While no study has examined how failing to meet expectations is related to SSS,
Hardie (2014) did find that young adults who failed to meet their occupational expectations
exhibited more depressive symptoms. While this study focused on depression as the result of internalized psychological experiences such as dejection, subjective social status is likely to also
be impacted by similar psychological distress. Thus, failure to meet expectations may be
included in the cognitive averaging of SSS in young adulthood. Subjective Social Status in Young Adulthood
Only one study to date has focused on the determinants of subjective social status in young adulthood. Using Add Health data, Nielsen et al. (2015) use a typical cognitive averaging
objective socioeconomic status. They did find that early life variables, such as parental income in adolescence and high school GPA remained significant to SSS in young adulthood. However,
key questions remain, particularly if and how psychosocial resources matter for young adult SSS
and how ideas about nonmaterial status figure into the cognitive averaging process. This paper builds off of the Nielsen et al (2015) paper by testing life course models of SSS development that
also investigate additional non-OSS variables that support an expanded framework of cognitive
averaging.
Expanding the Concept of Cognitive Averaging
In this paper, I aim to expand the concept of “cognitive averaging” to fit the life course perspective and include not just current and personal OSS measures, but also parental OSS,
which likely shapes young adults perceptions of their own status. I also will address some unexplored psychosocial variables than may be more predictive for SSS than previous attempts,
especially for the young adult cohort that I examine. Finally, in addition to examining additional concepts included in the process of cognitive averaging, I will also examine some indicators of
nonmaterial status that may shape the contexts in which this SSS development occurs.
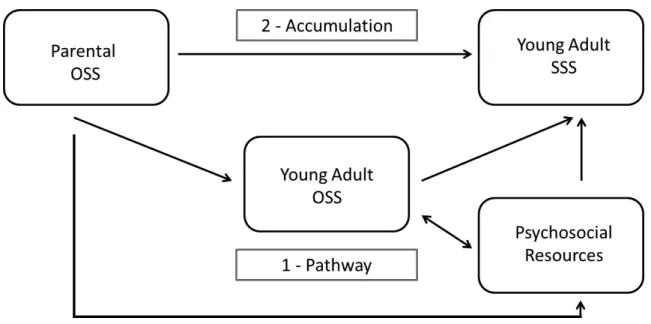
Figure 1 depicts two life course mechanisms -- parental OSS and own OSS – that young adults use during the process of “cognitive averaging” to assess their own SSS (Pudrovska and
Anikputa 2014). The pathway model (#1) asserts that the only reason parental OSS may matter
for SSS development is by supporting the OSS attainment of the child, as the status attainment model would suggest (Blau and Duncan 1967). On the other hand, the accumulation model (#2),
maintains that both parental and own OSS will independently influence SSS development. This builds off the idea that cognitive averaging includes not just current but also past OSS
have their own, independent socioeconomic status. As is common with these life course mechanisms, both may be operating at once to some extent, and thus it may be difficult to
empirically sort out these two mechanisms. In a nationally representative sample of Swedish men
and women, childhood financial difficulties reduced SSS independently of current OSS, supporting an accumulation of risk model (Miyakawa et al. 2012). Nielsen et al. (2015) found
that while parental education was not independently related to young adult SSS, parental income
was positively associated with young adult SSS when adjusted for young adult SSS.
In addition to exploring these life course indictors of objective socioeconomic status,
nonmaterial perceptions of status and psychosocial resources will be included in and shape the process of cognitive averaging. To my knowledge, no one has examined these types of variables
using a nationally representative sample of young adults in the US. In a time of fluid objective socioeconomic status during the transition to adulthood, these psychological factors may be
important for young adults. By expanding the framework of cognitive averaging to allow for additional non-OSS variables, we can better understand how material and nonmaterial
conceptualizations of status interact to elucidate the process SSS development.
Hypotheses
I frame SSS in young adulthood as a multidimensional concept that develops over the life
course and is influenced by parental OSS, individual-level OSS, and psychosocial characteristics
of adolescence. I test the following hypotheses:
1. Current objective socioeconomic status, including educational attainment, personal and
household income and occupation status, will be highly correlated with subjective social status, such that those with more money and education and more prestigious jobs have
2. Parental objective socioeconomic status in adolescence will exhibit a positive relationship
with subjective social status in young adulthood, independent of own OSS, supporting an
accumulation hypothesis.
3. Psychosocial and nonmaterial variables will also be related to subjective social status,
independent of parental and individual objective socioeconomic status:
1. Mastery, optimism and confidence in personal intelligence and attractiveness will
be positively associated with SSS.
2. Dissatisfaction with current education level, financial strain, perceptions of stress,
and depressive symptoms will be negatively associated with SSS Data And Methods
I use data from three waves of the National Longitudinal Study of Adolescent Health (Add Health). Add Health is a nationally representative, multistage stratified survey begun in
adolescence, sampling students in grades 7 through 12 during the 1994-1995 school year. The sample is drawn from and clustered within 132 schools (80 high schools and the middle schools
and junior high schools that feed into them). In addition to the original study, three additional
waves of data collection have been conducted, following these students from adolescence through the early portion of their life course. I use data from Waves I and IV of Add Health.
Dropping all respondents without the relevant variables or sample weights leaves me with a
sample size of 10,895. Most missing data comes from those missing information on own assets (620), parent education (877), and occupational prestige (306).
My analysis begins with descriptive statistics, which are presented in Table 1 of this paper. To explore bivariate relationships between SSS and my explanatory variables, I calculated
using the appropriate survey weights and commands in Stata 13.1, to test the multivariate relationships between the explanatory variables and SSS. In Table 3, I build three separate
models that test the three hypotheses regarding the main predictors of SSS: 1) parental OSS, 2)
own OSS, and 3) psychosocial/nonmaterial variables. The final model in Table 3 assess the extent to which the explanatory variables remain significant when mutually adjusted, or which
measures are independently important for the cognitive averaging process of SSS development.
, I introduce own OSS and own psychosocial variables in a stepwise fashion to test whether the relationships between these variables and SSS persist in the multivariate, fully adjusted models.
Measures
Dependent Variable:
Subjective Social Status: My dependent variable is a linear operationalization of subjective social status, as measured by the MacArthur Scale of Subjective Status included in Wave IV of
Add Health. Respondents were shown a picture of a ladder and asked to place themselves on a rung based on how their education, income and job compared to others in the United States,
ranging from 1 (lowest on ladder) to 10 (highest on ladder).
Independent Variables:
Current OSS:
Current objective socioeconomic status of the respondent comes from the in-home portion of the
Wave IV interview.
Education: Respondent education was measured by asking respondents to report the highest level of education they have yet obtained. I collapse the 13 categorical responses into five substantively meaningful categories: less than high school, high school graduate, some college,
Income: I will investigate two types of income: respondents reported their personal earnings from the past year as well as their household income. Both questions provided income categories,
from which I assign the midpoint value to create linear variables, in thousands of dollars.
Examining each one of them separately will contribute to the assessment of the extent to which personal OSS and related OSS matter for SSS.
Occupation: Respondents reported their current or most recent occupation. Add Health reported the 6 digit Standardized Occupational Classification codes (SOC codes) for the respondent. Using these codes, I matched each occupation with its Nakao and Treas (1994) prestige score
(range 0 – 100). I choose to use a measure of prestige rather than a composite measure of the typical income and educational attainment associated with each occupation in order to capture
another dimension of OSS not measured by the respondent’s income and education.
Wealth: Respondents were asked to indicate their “best estimate of the total value of [their] assets and the assets of everyone who lives in [their] household and contributes to the household budget”. Wealth responses were also in ranges, from which I use the midpoints to create a linear
assets measure, in thousands of dollars.
Home Ownership: I create a dummy variable of home ownership based on respondents answers to the following question: “Is your house, apartment, or residence owned or being bought by you
and/or your spouse/partner?”
Financial Strain: Using six questions regarding whether in the past 12 months the respondent reported that they or their household 1) “were without phone service because [they] didn't have
enough money?” 2) “didn't pay the full amount of the rent or mortgage because [they] didn't have enough money?” 3) “were evicted from [their] house or apartment for not paying the rent or
have enough money?” 5) “had the service turned off by the gas or electric company, or the oil company wouldn't deliver, because payments were not made?” 6) “worried whether food would
run out before [they] would get money to buy more?”, I created three categories of financial
strain: no financial strain (no indicators of strain), some financial strain (1 or 2 indicators) or much financial strain (3 or more).
Parental OSS in Adolescence Markers:
Measures of objective socioeconomic status of the respondent’s family in adolescence come from Wave I.
Parental Household Income: Parental household income status is a categorical variable taken from the parental questionnaire from Wave I, where a parent or parent figure (most often the
respondent’s mother) reported their 1994 annual household income in thousands. Because of the large amount of missing data, I created a categorical variable that includes poor (household
income below $15,000, approximately the federal poverty line of 1994: $14,800), near poor ($16,000 – $30,000: twice the federal poverty line in 1994), not poor ($31,000 or more) or
missing.
Parental Education: I use the highest reported education for either the resident mother or father in the Wave I in-home interview. If a respondent only reported the educational attainment
information for one parent, that is the education level used. This categories mirror the
operationalization of individuals’ own education. Psychosocial Factors:
All psychosocial variables described in this section are from Wave IV.
in my life”, Other people determine most of what I can and cannot do”, “There are many things that interfere with what I want to do”, “I have little control over the things that happen to me”
and “There is really no way to solve the problems I have”. I create a scale of personal mastery
from these questions by summing responses (which range from 1 to 5) over the five items so the scale ranges from 5 – 25, with higher values representing more mastery.
Optimism: Add Health asked respondents the extent to which they agree with the following statements regarding optimism: “I’m always optimistic about my future”, “I hardly ever expect things to go my way”, "Overall I expect more good things to happen to me than bad” and “I
rarely count on good things happening to me”. I create a scale of optimism from these questions by summing responses (reverse coded when needed, which range from 1 to 5) over the four
items so the scale ranges from 4 – 20, with higher values representing more optimism.
Perceived stress: Add Health includes questions to measure the Cohen Perceived Stress scale, including how often in the last 30 days the respondent felt unable to control the important things in their life, how confident they felt able to handle personal problems, how often they felt thing
were going their way, and how often they felt their difficulties were too hard or too many to
overcome. I create a scale of perceived stress from these questions by summing responses (which range from 1 to 5) over the four items so the scale ranges from 4 – 20, with higher values
representing more stress.
Depression: Add Health contains variables that can be used to create a linear scale that reflects the normative Center for Epidemiological Studies Depression (C-ESD) Scale. The CESD scale at
Self-Esteem: I use two variables that measure two aspects of personal confidence, perceived attractiveness and perceived intelligence. In Wave IV, respondents were asked to rate their
attractiveness and intelligence relative to people their own age. I recode perceived attractiveness
into four categories: not attractive, slightly attractive, moderately attractive and very attractive. Intelligence is categorized as above average, average and below average.
Add Health Picture Vocabulary: Add Health administered an abridged version of the Peabody Picture Vocabulary Test to respondents in Wave I, which was then standardized to mirror an IQ scale, with a mean of 100 and standard deviation of 15. The AHPVT is a measure of verbal
ability and ranges from 13 – 146.
Satisfaction with educational attainment: In Wave IV, respondents reported that they either have received their desired amount of education or that they have not yet reached their desired educational attainment. Those who have not reached their desired educational level are coded as
“1”, while those who have are coded as “0”. Controls:
I control for age, sex, race/ethnicity (White, Black, Asian, Native American/Other and Hispanic),
family structure (living with both biological parents; two-parents, step; single mother; single father; or other), and immigrant status (first, second or third+ generation) at baseline and marital
status at Wave IV. I also control for respondents’ living situations with a dummy variable for
those who are living with their parents, as this may inflate the household income reported by respondents. I also control for Add Health Picture Vocabulary (AHPVT) score, an abridged
Results
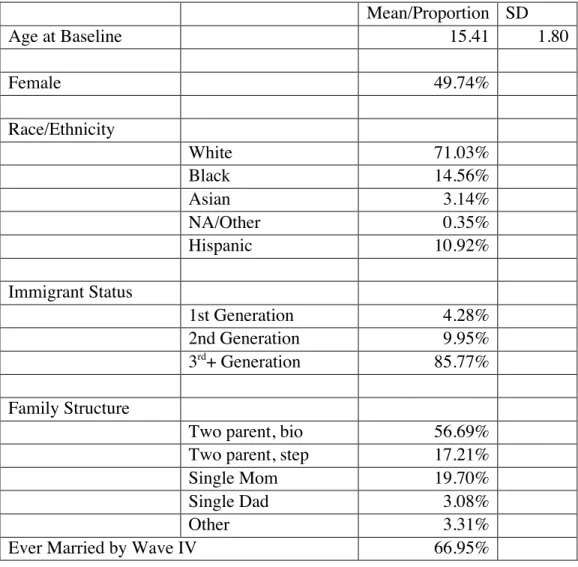
Table 2.1 shows the basic demographic make-up of the analytical sample. The mean age
at Wave I was 15.41 and just less than 50% of the sample is female. The majority of the sample
is White (71.03%), with large portions of Blacks (14.56%) and Hispanics (10.92%). The remainder of the sample was Asian (3.14%) or some other race, typically Native American
(0.35%). Most of the respondents were 3rd
or greater generation Americans (85.77%), with the
rest of the sample being children of immigrants (9.95%) or immigrants themselves (4.28%). Most lived with both biological parents during Wave I (56.69%), but many also lived with one
biological parent and a step-parent (17.21%). Of those living with only one parent, the majority lived with single mothers (19.70%), though some did live with a single father (3.08%). The rest
(3.31%) lived in some other family arrangement, typically living with one or both grandparents. By Wave IV, over two-thirds of the sample was married.
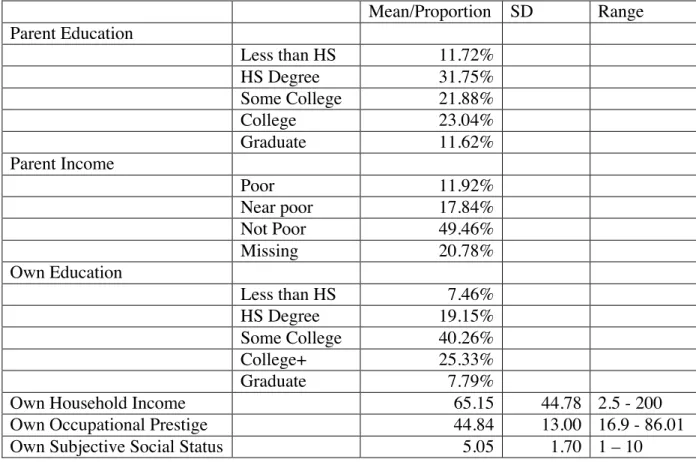
Table 2.2 describes the distributions of the OSS variables within the analytical sample. Just under a third of respondents had a parent with at least a high school degree; about a fifth of
the parents of the respondents had some college, while another fifth had a college degree.
11.76% had at least some graduate education, while the remainder had less than a high school education. The modal category of parent income was not poor (49.75%), while 12.04% of
respondents had parents who were poor, and 17.65% who were near poor. About a fifth of
respondents were missing parental income data, but to maintain sample size I include them as a category on the income dummy measure. The respondents themselves were slightly more
educated than their parents (approximately three-fourths had at least some college). Mean personal earnings were $35,960, but mean household income was almost twice as much,
respondents was 45.00 and 45.40% of respondents owned their own home in Wave IV. Approximately 16% of respondents reported less than $5,000 in assets, and 7.70% of
respondents had more than $250,000 in assets.
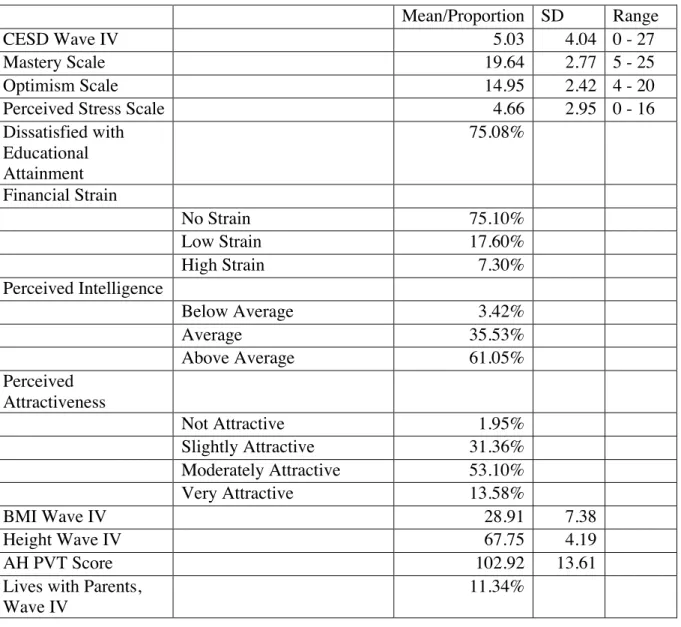
Table 2.3 presents the descriptive statistics for the psychosocial variables. The mean CESD score at Wave IV was fairly low (5.03), and mastery was fairly high (mean=19.64). The
mean optimism scale score was 14.95, and perceived stress was fairly low (mean = 4.6). Over
75% of the sample reported not yet reaching their desired level of educational attainment. Most reported no financial strain, though 7.30% reported high strain. Over 60% of the sample
considered themselves of above average intelligence, while the majority of the sample (53.10%) considered themselves moderately attractive. Average BMI at Wave IV was 28.91 and average
height was about 67 inches. Finally, the average AH PVT score in this sample was 102.92, and just over 11% of the respondents lived with their parents at Wave IV.
Table 2.4 shows the mean SSS score across the categories of key covariates. The older respondents (age 29-32 in Wave IV) had slightly higher SSS, but there are no gender differences
in SSS. Blacks reported the lowest average SSS (4.72), Hispanics were slightly above that (4.98),
and Whites in the middle (5.14). Asians and Native Americans/Others reported the highest mean SSS (5.50 and 5.35, respectively). 3rd+ generation immigrant respondents had slightly lower
SSS than first and second-generation respondents. Those from two biological parent households
had the highest SSS compared to other family structures. Those with highest parental SES (not poor, college degree or more) had the highest SSS, and those with high OSS of their own (higher
personal and household income, college or more education, professional/ managerial occupation, owns home, and highest assets bracket) also had the highest SSS. SSS also has a relationship
high strain having the lowest SSS. Finally, both measures of personal confidence were associated with SSS, as those who consider themselves of above average intelligence and very attractive
had the highest SSS scores. These bivariate, unadjusted associations are in the expected
directions, exhibiting preliminary support for my three hypotheses.
Table 2.5 presents the multivariate regression analysis that tests my hypotheses and the
extent to which each hypothesized measure is independently and additively associated with SSS
in young adulthood. Model 1 tests the associations between SSS and parental OSS. Both parental education and income are related to SSS in young adulthood. Less than HS parental
education was associated with a 0.180 reduction in SSS, while those with parents reporting any level of education higher than high school had increased SSS. Those with a parent with
postgraduate education had increased SSS of almost an entire ladder rung (0.909). In addition, those with “poor” or “near poor” parental incomes had lower SSS, 0.362 and 0.342 respectively,
while missing parental income was statistically unrelated to SSS.
Model 2 in Table 2.5 examines the associations between respondents’ own OSS measures
in young adulthood and their SSS. Education is highly and positively related to SSS, as is
household income, personal income and occupational prestige score. Compared to those with HS degrees, respondents without a HS degree had 0.214 lower SSS and those with postgraduate
education had 1.211 higher SSS. A $1,000 increase in household income is associated with a
0.006 increase in SSS, and each additional $1,000 in personal income was associated with a 0.003 unit increase in SSS. Other measures of current socioeconomic status, including measures
of wealth, like owning a home and other assets, are positively associated with SSS in young adulthood, while financial strain, is negatively associated with SSS (those with the highest level