The Strategic Value of Public Sector Analytics: A Framework and a
Showcase Study
Tobias Brandt (corresponding author), Rotterdam School of Management, Erasmus University Rotterdam, PO Box 1738, 3000 DR Rotterdam, The Netherlands, [email protected]
Sebastian Wagner, Geospin GmbH, Kartäuserstr. 39a, 79102 Freiburg, Germany, [email protected]
Dirk Neumann, University of Freiburg, Platz der Alten Synagoge, 79098 Freiburg, Germany, [email protected]
Abstract: The public value of information technology has received increasing attention in recent years. While most research focuses on mediating e-government technologies, we investigate the strategic value of big data and analytics in public sector decision-making. Using the strategic triangle of value, legitimacy, and operational capacity as a starting point, we derive a framework to assess the strategic value of public sector analytics, along with six guiding questions that structure the assessment process. We apply the framework to an illustrative example of a spatial analytics application developed to optimize strategic investments in urban electric vehicle charging infrastructure. While our results show that analytics helps cities to manage the trade-off between economic and ecological value more efficiently, we also discuss other types of public value, such as health and social equity. We further outline how analytics may improve the legitimacy of public sector decision-making through transparency and objective, data-driven criteria. As a final point, we suggest that collaborations with academia to create lightweight analytics applications may aid in strengthening organizational readiness for the use of big data and analytics in public sector organizations.
Keywords: Decision Support Systems, Public Value, Analytics, Smart City, Spatial Analysis, Electric Mobility
1. Introduction
In recent years, companies across industries have begun to leverage big data and analytics to improve both operational processes and strategic decision-making. Examples range from industrial firms, such as General Electric (Winig 2016), equipping machinery with sensors to optimize operations, to emerging companies using analytics to disrupt service sectors (Raube 2015). In general, companies utilize data on internal processes, (potential) customers, suppliers, and environmental factors to identify operational weaknesses, design new products and services, and base long-term strategies on a solid foundation. However, while private sector companies often embrace analytics to reinvent themselves and improve their competitive position, adoption in public sector management proceeds at a slower pace. Levine (2012) points out several reasons for this phenomenon, including financial constraints that limit the ability to compete for analytical talent with the private sector and limited information sharing among public institutions and departments. He also argues that public agencies are accountable to a wider variety of stakeholders (e.g. administrators, elected officials, citizens) and that measuring the value analytics generates is more challenging than in the business sector, since success metrics are more varied and complex. In effect, public management faces additional obstacles that restrict the adoption of analytics to improve decision-making.
In this paper, we seek to understand and alleviate these challenges by employing Moore’s (1995) public value framework as a theoretical starting point. Moore argues that strategies in public management need to be aligned with the triangle of net value, legitimacy, and operational capacity. Building upon these dimensions, we derive a framework for assessing the strategic value of big data and analytics in the public sector. We apply the framework to an illustrative example, namely a prescriptive analytics application that supports strategic decision-making regarding investments in urban charging infrastructure for electric vehicles. We use this example to demonstrate how the use of analytics by public sector organizations can provide public value, but also present insights into how analytics applications may affect and are affected by the legitimacy and operational capacity dimensions of Moore’s strategic triangle.
In the remainder of this section, we will first describe Moore’s original framework in more detail and contrast public value considerations with research that has been conducted on the business value of IT. We will then summarize related work on the public value of information technology (IT) in general. These considerations serve as a foundation for our Public Value of Analytics (PVA) framework, which we will introduce in the subsequent section.
1.1 Contrasting Public Value and Business Value
The business value of IT is a well-established research stream within management science. For example, more than two decades ago, Mukhopadhyay et al. (1995) estimated the annual cost savings at a large automotive company that result from electronic data interchange technology. More recent work
includes research on specific ways in which IT affects business value as measured through, for instance, return on investment and market share (Wang et al. 2012), and the effect of IT on productivity (Tambe and Hitt 2012). While some work extends analyses to include additional performance measures, such as risk (Otim et al. 2012, Wagner et al. 2014) and the Baldrige criteria (Mithas et al. 2011), overall, the business value of IT is most prominently linked to financial performance. This aligns with the notion that private sector enterprises are judged by the long-term value they provide to shareholders. However, Moore (2000) argues that performance measures are not as clear-cut for non-profit and governmental organizations. The value these organizations provide is often linked to some social purpose or politically mandated missions. While for-profit firms derive justification of their existence from the financial returns to their shareholders, public sector organizations derive justification from this purpose or mission.
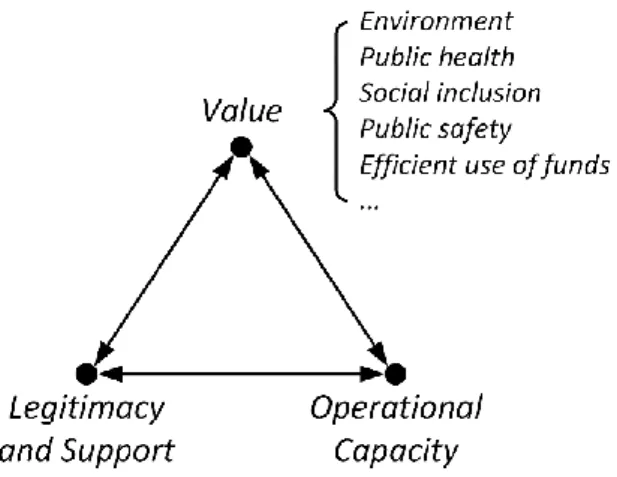
Moore (1995, 2000) frames this broader perspective on public value through the strategic triangle, stating that organizations need to devise and follow strategies that provide a substantial net value to the public, are sustainably legitimated by their authorizing environment (e.g. the electorate, supporters), and are operationally feasible for the organization. As illustrated in Figure 1, these dimensions are interdependent. Examples of public value that can be pursued by public organizations include environmental sustainability, public health, or social inclusion. Whichever combination of value forms a strategy aims for, it needs to be legitimized by the authorizing environment. For instance, citizens elect representatives that are ideologically close to themselves and pursue similar objectives; through taxes they also provide the funding to realize these objectives. These funds, in turn, constrain the degree to which public value can be attained, since they effectively limit the operational capacity of the organization. While public organizations often seek to maximize public value subject to a given budget, it is equally possible to minimize public spending while achieving a given set of public value targets. This makes economic value an explicit public value (e.g. by reducing the tax burden) as opposed to an implicit constraint on the attainability of other forms of public value.
1.2 The Public Value of IT
In principle, IT affects the generation of public value along all three of these dimensions. For instance, governmental websites can ease the interaction with government services, such as application for licenses, filing of taxes, or payment of fines (Tan et al. 2013). Making these necessary transactions less cumbersome creates value to citizens, but can only be realized if the websites are well-designed, maintained, and integrated into the processes of the responsible agencies. This reflects the dimension of operational capacity, which is also central in research on outsourcing of IT functions by public agencies (Cordella and Willcocks 2010, 2012). Furthermore, IT affects the authorizing environment directly, providing stakeholders with new means to voice their preferences. This is reflected in research on forms of IT-enabled, direct democracy (Kakabadse et al. 2003), but also in the emergence of grassroots political movements that self-organize through social networks (Wattal et al. 2010, AlSayyad and Guvenc 2015).
While not as broadly researched as the business value, the public value of IT has garnered increased interest in management research over the past decade. This development is reflected in Petter et al.'s (2012) statement that traditional success measures applied within research should be expanded to capture “public value as determined by citizens individually and collectively” (p. 355). Belanger and Carter (2012) argue in their historical review of e-government research that the field has sufficiently matured to “move from technology adoption studies to value-based studies” (p. 378). In fact, most of the research on the public value of IT has been conducted in context of e-government initiatives (e.g Ravishankar 2013, Smith 2010). While various definitions of e-government exist (Grönlund and Horan 2005, Yildiz 2007), the World Bank's (2015) definition as “the use by government agencies of information technologies […] that have the ability to transform relations with citizens, businesses, and other arms of government” best reflects the focus of recent research. This is evident in Carter and Belanger’s (2005) definition of e-government as “the use of information technology to enable and improve the efficiency with which government services are provided to citizens, employees, businesses and agencies” (p. 5). Effectively, e-government research is focused on the relationship between a governmental institution and other stakeholders it interacts with. Examples include the aforementioned work by Tan et al. on the design of e-government websites (Tan et al. 2013), Scott et al.’s work assessing the public value of such websites (Scott et al. 2016), but also the use of IT to improve relationships between prosecutor and police, as described by Cordella and Iannacci (2010). In comparison, articles published in public sector management journals embrace a broader perspective on the public value of IT. For instance, Bryson (2010) and Hackler and Saxton (2007) outline the importance of IT for improving strategic decision-making in public sector and non-profit organizations. Lavertu (2016) lays out the issues arising from the use of big data to evaluate public administration performance, while Zuiderwijk et al. (2015) discuss the role of open data technologies. Open data, big data, decision-making—these topics emphasize the growing role of big data and analytics in public management
research and practice and demonstrate the necessity of investigating their impact on the generation of public value in more depth. We begin addressing this research gap by extending Moore’s framework to the context of analytics applications in the next section and outline how the use of big data and analytics can contribute to the creation of public value.
2. Assessing the Public Value of Analytics: A Framework
Clearly, the primary purpose of analytics is improved decision-making (Davenport et al. 2010). Thereby, analytics constitutes the next evolutionary step of decision support systems, a notion that is also reflected in recent publications from this field (e.g. Angalakudati et al. 2014, Demirkan and Delen 2013). In a public sector context, Pang et al. (2014) describe public intelligence analytics as the tools and abilities necessary “to gather information from the public and the environment and […] to analyze and derive knowledge and insights from the information” (p. 196). These considerations illustrate how analytics applications differ from the aforementioned e-government solutions studied over the past decade. While the latter serve to mediate the relationship between government institutions and other stakeholders, analytics tools are employed to improve decision-making within the government organization. Notwithstanding this distinction, analytics and mediating e-government applications also affect each other. For instance, government websites can provide analytical systems with data on citizens’ preferences, while data-driven decision-making may ultimately affect the way public services are provided.
In the public sector, as in companies, big data and analytics can improve decision-making at both the operational and strategic levels. For instance, Athey (2017) and Glaeser et al. (2016) point out how cities can use analytical systems to more efficiently allocate building and health inspectors based on predicted probabilities of violations occurring, improving day-to-day operations and contributing to public safety and health as forms of public value. Similarly, predictive policing systems (Gerber 2014, Shapiro 2017) seek to improve police operations by allocating resources to areas of anticipated crimes in advance and waste management systems (Perera et al. 2014, Castro Lundin et al. 2017) help cities to perform waste collection and disposal more efficiently. Analytics systems such as these leverage big data and the Internet of Things (IoT) to improve operational performance, but they need to be built up and require substantial investments and training. Hence, there is a clear strategic dimension to the adoption decision and the long-term strategic value of these operational analytics systems needs to outweigh the associated investment, maintenance, and training costs.
There is also a second fundamental source of strategic value derived from public sector analytics, namely employing analytics directly at the strategic level to improve strategic decision-making. For instance, Brandt et al. (2017) demonstrate how municipalities can use social media analytics to develop strategies for the development of urban tourism. In general, long-term strategic decisions in the public sector—particularly in a municipal context—frequently relate to infrastructure investments (e.g. roads or public transport) and city development. Novel data sources that reflect urban
dynamics in conjunction with advanced analytics techniques can potentially provide a solid, evidence-based foundation for these decisions.
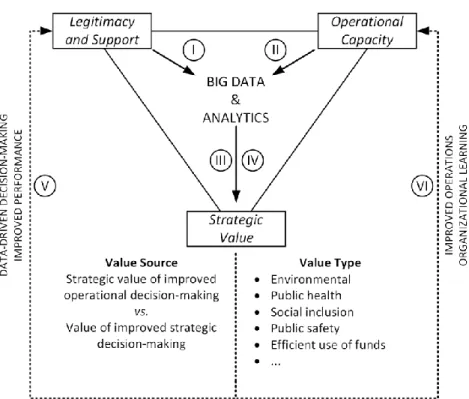
We assemble these considerations, along with key elements from Moore’s strategic triangle, into a framework to assess the public value of big data and analytics applications (PVA framework), which is depicted in Figure 2. As illustrated, in order for a public sector entity to create value through big data and analytics, the application must be both legitimized and operationally feasible for the organization. Legitimacy may, for instance, be violated if sensitive personal data is used without a clear mandate, such as mobile phone traces for predictive policing. On the other hand, the analytics application may be operationally infeasible if the organization cannot attract sufficiently qualified personnel to work with it and fully leverage its potential.
As discussed in the previous section, the type of value that is generated may take various shapes, including a cleaner environment and healthier citizens, public safety, or a stronger sense of community and social inclusion. Regardless of the type, we argued that strategic value is either derived from improved operational decision-making—in which case the strategic decision is whether to adopt or not—or from improved decision-making at the strategic level. The most interesting questions emerge when considering how prospective and realized value affect the other dimensions from Moore’s strategic triangle. For instance, the promise of improved, objective, and data-driven decision-making may serve as a basis to garner the necessary support for implementing the analytics solution in the first place, just as realized value may rally support for future analytics-driven measures. Similarly, analytics systems that improve operational decision-making clearly strengthen the general operational capacity of the organization, although not necessarily regarding big data and analytics. For instance, predictive
policing systems likely improve the police force’s capacity to combat crime. However, by familiarizing itself with analytics systems and recruiting specialized personnel, the organization may also directly strengthen its ability to utilize additional analytics tools in the future. These considerations illustrate the potential of a virtuous cycle, in which the value derived from a particular big data and analytics solution may affect the other dimensions of Moore’s strategic triangle in a way that supports the adoption of other data-driven solutions in the future.
(I) Overall, the PVA framework provides a theoretical lens to assess the strategic value of public sector analytics applications. The following guiding questions relate the building blocks of the framework to each other and serve to structure this assessment process: (II) Is there legitimacy / support from the authorizing environment for the use of the analytics
application?
(III) Is the analytics application operationally feasible?
(IV) Does the strategic value of the analytics application derive from improved strategic decision-making or from improved operational excellence?
(V) What type(s) of public value is/are created?
(VI) Does the use of the analytics application strengthen public support for employing big data and analytics in public sector decision-making?
(VII) Does the use of the analytics application improve the operational capabilities of the organization?
In the next section, we proceed by presenting an illustrative, practical example of using analytics in strategic decision-making in the public sector. We first introduce showcase and methodology, followed by a summary of key results. In the subsequent discussion section, we will then return to the aforementioned guiding questions and apply them in order to assess the strategic value of the showcase analytics application.
3. Efficient Investments in Electric Charge Point Infrastructure through Spatial Analytics
Transportation infrastructure is an essential element of a successful economy. However, while the construction of a single infrastructure project may cost several billions of dollars, its benefits are difficult to assess and accumulate over a long time span. Thus, infrastructure planning faces immense initial investments coupled with tremendous, but uncertain, payoffs to businesses and society as a whole. It is also an area of the economy in which the public sector plays a very crucial role. Although public-private partnerships for infrastructure projects are on the rise (Ng et al. 2013), the provision of roads, railways, or sanitation systems continues to be a core function of the state.
Our example focuses on a type of infrastructure investment that currently concerns city planners and companies around the globe—the construction of charge point (CP) networks for electric vehicles
(EVs), particularly cars. Such cars, charged with energy from renewable sources, have been hailed as a milestone in the move towards cleaner, environmentally friendly mobility. Hence, the primary public value associated with electric vehicles is of an environmental nature, combating climate change. However, they also improve public health through a reduction in emissions and noise levels (Woodcock et al. 5, Chen et al. 2017). A major obstacle to the widespread adoption of electric mobility results from battery constraints that limit the range of EVs quite severely. To successfully promote electric driving and encourage people to switch, an extensive network of public charging stations, i.e. those not limited to a specific household or employer, is necessary (Ahn et al. 2013, Bonges Iii and Lusk 2016, Neubauer and Wood 2014). With public CPs often costing between USD 10,000 and USD 60,000 apiece (Agenbroad and Holland 2014), this leads to investment decisions that aggregate to several million US dollars for a large city, costs that are often substantially borne by the municipality or other subsidizing public agencies (Lutsey et al. 2015). Hence, cities face strategic decisions between the economic costs of public charge points on the one hand and other value types, such as environmental and health benefits, on the other. The value of analytics lies in supporting this decision-making process by identifying those locations at which, for a given cost, these benefits can be maximized. In the context of this study, we reflect this rationale by positioning charge points such that the expected utilization rate is maximized. Clearly, there are other objectives that could be pursued, as well, such as positioning charge points for visibility and advertising electric mobility, or placing them at short, regular intervals to combat range anxiety, i.e. the fear of running out of power. However, we argue that these aspects become less relevant when considering large-scale deployment of charging infrastructure. Instead, focusing on utilization rates allows decision-makers to place charge points in those areas where demand is highest and where they provide the greatest benefit to adopters of environmentally friendly electric vehicles.
While various research studies have investigated the optimal placement of electric vehicle charging infrastructure, most of these studies are based on constructed (Mak et al. 2013, Avci et al. 2015) or very specific datasets (Capar et al. 2013, Chen et al. 2013, Chung and Kwon 2015). This limits their applicability to real-world cities or their generalizability, respectively. The analytics application presented in the next subsection is, in principle, applicable to any city or urban area in the world.
3.1 System Design
Our application leverages three concepts that are intimately linked to the emergence of big data and analytics—the Internet-of-Things (IoT), open data, and crowdsourced data. First, the IoT implies that machines are increasingly equipped with information and communication technology that enable sensor readings to be taken and automatically communicated. Charge points are usually equipped with sensors that allow operators to observe in real-time whether the CP is in use or not. We chose the city of Amsterdam in the Netherlands for our showcase study, since this real-time data on charge point usage within the city was made openly available through an API. In 2009, the city of Amsterdam launched
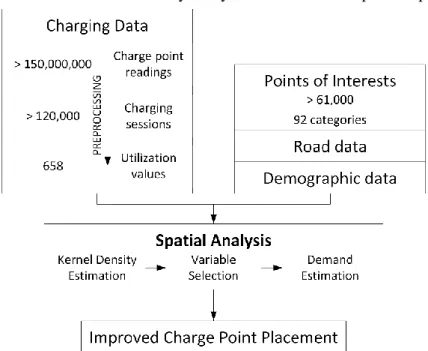
the Amsterdam Electric initiative, which aimed to have 200 charge points within city limits by 2012. By early 2014, Amsterdam was offering several hundred charge points to electric drivers, which are used on a daily basis. Over the course of seven months, we accessed the current state of each charge point outlet every minute, resulting in more than 150 million observations. As illustrated in Figure 3, during pre-processing these observations were first cleaned and summarized into approximately 120,000 charging sessions, which ultimately gave us insight into the utilization of each charge point outlet in the city. Effectively, utilization is the result of charging demand and supply within a given area; hence, the optimal (value-maximizing) distribution of charge points is the one that maximizes the average utilization across a given number of charge points.
To identify the drivers of charge point utilization, we make use of a specific characteristic of electric vehicle charging. While a stop at a gas station is usually completed in five to ten minutes, recharging an EV battery may take between 20 minutes and several hours, depending on the type of vehicle and the charging technique used. The range of a full tank of gasoline far exceeds that of most EV batteries, which means that recharging is a frequently recurring and time-consuming aspect of electric mobility. With the increased time requirement for electrical charging, drivers are more likely to combine it with other activities, i.e. charging the vehicle while it is parked and the drivers are running errands. As outlined in Figure 3, we capture this relationship through the use of crowdsourced points of interest (POIs) from map services such as Google Maps or openstreetmap. POIs from these sources are divided into dozens of different categories—for instance restaurants, schools, museums, or parks. The density of a particular POI category in a given area is clearly related to the appeal of that area in terms of activities that relate to that category. For instance, an area with a high number of restaurants likely attracts many people who are interested in dining. In addition, we use demographic data and information on major roads as control variables. The analytics system first resolves spatial dependencies between
the POIs using a kernel density estimation. Subsequently, the system identifies those categories and activities that contribute to a high demand for EV charging as measured by actual charging data, which is captured by the step Variable Selection in Figure 3. These categories can subsequently be used to estimate demand across the city and determine ideal charge point locations accordingly.
The availability of POI data through online services for essentially any city in the world makes this approach applicable and replicable for any city in the world, improving their operational capacity to efficiently plan a charging infrastructure. While charging data for cities that are just building up their infrastructure is usually not available, insights and empirically verified relationships from other cities can be used as a baseline and subsequently be updated with data from the first set of CPs in the new city. In the next subsection, we provide a detailed description of the data constructs used in our study.
3.2 Data
Using the Google Places API we captured data on more than 61,000 POIs within the city centre of Amsterdam. This data includes the geo-coordinates of the POI, as well as one or more of 92 category tags that further describe the POI. Each POI 𝑝𝑖 ∈ 𝑃 is defined as a 3-tuple pi= (ϕi, λi, γi), where 𝜙𝑖 is the latitude and 𝜆𝑖 the longitude coordinate. 𝛾𝑖 is an n-tuple whose elements are those categories the POI is tagged with. The tuple of all categories is 𝛾 = (accounting, airport, … , zoo) with |𝛾| = 92.
Charge points are ordered in a similar manner. Each outlet of a charging station 𝑐𝑗∈ 𝐶 is defined as a 4-tuple 𝑐𝑗 = (𝜙𝑗, 𝜆𝑗, 𝑢𝑗, 𝑢𝑗). 𝜙𝑗 and 𝜆𝑗 again represent the geo-coordinates, while 𝑢𝑗 is the utilization of the charge point, i.e. the ratio between the time the CP was used and the total time it was available. Since we consider each outlet of a charging station as a separate data point, we also calculate the average utilization of all data points with the same coordinates, 𝑢𝑗. For instance, if a charging station has two outlets which are utilized at 𝑢1= 0.5 and 𝑢2= 0.2, we regard each outlet as a distinct charge point with a utilization of 𝑢1= 𝑢2= 0.35. This reflects the fact that differences in the utilization of outlets of a single charge point are likely a result of the location of the outlet on the charge point (one may be closer to the parking spot) and not the location of the charge point. Real-time data on whether a specific outlet is in use is openly accessible (https://www.nuon.nl/ev/publiek/kaartoplaadpunten.do). Data was collected between July 01, 2013 and January 31, 2014. The dataset includes the geo-coordinates and detailed information on the utilization of 296 charge points with 675 outlets. During data cleaning, the duration of every charging session was recorded, as well as the total time the outlet was available for charging (excluding, for instance, maintenance times). However, some of the charging stations were built during the data collection period. Since it is likely that new CPs require some time for consistent usage patterns to emerge, we excluded all outlets with an active time of less than 60 days, bringing the total down to 658. From the charging sessions we calculated the utilization of each outlet and, subsequently, the average utilization of each station. This variable is limited to the interval [0,1]
Consequently, for the analysis, the analytics application employs a beta regression model as proposed by Ferrari and Cribari-Neto (2004), which has been specifically designed for modelling rates and proportions.
As previously mentioned, we include demographic data provided by the Dutch Central Bureau of Statistics (http://www.cbs.nl/) as a control variable. It includes information on average income, population density, and car density for every neighbourhood (“buurt”) in Amsterdam. Consequently, we associated each charge point with the neighbourhood in which it is located. Demographic data was not available for 12 outlets, which were subsequently excluded from the sample. An additional control variable that was included is the distance to the centre of the city. Furthermore, Amsterdam provided traffic information for major roads in the city proper. Since not all CPs are directly adjacent to such a road, we include the proximity to the nearest major road as a proxy for traffic volume.
3.3 Geospatial Pre-processing and Modelling
The analytics application seeks to identify relationships between the utilization of a charge point and POIs in its vicinity. For this purpose, both the vicinity and the relevance of a POI depending on its position within the vicinity need to be defined.
What constitutes a vicinity is generally defined by the distance or the time necessary to travel between two points. For instance, in a study of parking behaviour in the Dutch city of Haarlem, van der Goot (1982) uses an upper bound of 40 minutes walking time as a determinant of parking spot selection. A radius of forty minutes walking time thus defines the vicinity of a parking spot. Within these 40 minutes, the appeal of a parking spot is linearly decreasing. We have previously argued that the decision regarding electric vehicle charging is very closely linked to parking decisions since EV owners are likely to combine charging with other activities in the area. Therefore, we follow van der Goot’s general premise; however, we adapt it, as it appears to exaggerate the willingness of drivers to walk. After all, even a twenty-minute walk from the parking lot would still be half as attractive as a space right in front of the intended destination. Hence, we limit the vicinity to a radius of one kilometre, representing a ten minute walk for the average walking speed in the Netherlands (Levine and Norenzayan 1999). As a result, a POI that is right next to a charge point has the maximum impact on its utilization while all POIs at a distance of more than one kilometre have no relevance.
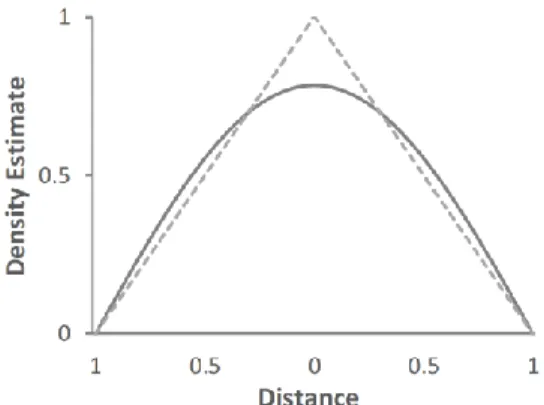
The relevance of a POI to the charge point decreases the further they are apart. This simply reflects the assumption that EV drivers want to minimize walking time from the parking spot to their destination. Hence, the appeal of a charging station decreases the further away it is from the destination of a specific EV driver. Van der Goot (1982) assumes a linear decrease, resulting in a triangular kernel density estimation (KDE). We adapt this approach slightly to incorporate the inherent uncertainty of the POI coordinates. Each POI is represented by longitude and latitude coordinates; however, this naturally represents only one specific location in the building. It does not necessarily represent the entrance to the building, which could be much closer to a parking spot than the coordinates would
indicate. This is especially valid for larger buildings, such as museums, stadiums, or shopping malls. Instead of the triangular kernel, we use a cosine kernel since the density estimate—the relevance of the POI to the charge point—remains approximately constant for the first 100 meters. It decreases at an accelerating rate afterwards, effectively mimicking the triangular kernel for the latter two thirds of the bandwidth of 1,000 meters (Figure 4). Hence, we define the density 𝜌𝑖𝑗 of point of interest 𝑝𝑖∈ 𝑃 at the location of charge point 𝑐𝑗 ∈ 𝐶 as:
𝜌𝑖𝑗= { 𝜋 4cos ( 𝜋 2 𝑑𝑖𝑗) if 𝑑𝑖𝑗 ≤ 1 0 otherwise (1) with 𝑑𝑖𝑗 as the distance between 𝑝𝑖 and 𝑐𝑗.
We next define the density 𝜌𝑙𝑗 of a particular POI category 𝑙 ∈ 𝛾 at the location of charge point
𝑐𝑗 as:
𝜌𝑙𝑗 = ∑ 𝜌𝑖𝑗
𝑝𝑖∈𝑃:𝑙∈𝛾𝑖
. (2)
As a result, rather than saying that there are 10 restaurants within 1000 meters of charge point
𝑗, the analytics application considers the distances between each restaurant and the charge point. For instance, if all restaurants are at a distance of 999 meters from the CP, 𝜌restaurant,𝑗—what we refer to as the restaurant-density at charge point 𝑗—is only 0.012. A different CP 𝑗∗ that is only 10 meters from each of these restaurants would have a restaurant-density of 7.85, close to the maximum. While 𝑗∗ is much more likely to be appealing to an EV driver planning to dine out than 𝑗, they would be equally attractive if they were not weighted by distance.
As the POI data is partly user-generated, it is susceptible to errors. For instance, certain POIs and enterprises may have shut down but remain listed, or they could simply have incorrect tags associated with them. This is especially a problem for categories with only a few entries. For instance, there are 12 POIs tagged with the category airport, but most of them are very far from the Amsterdam
Schiphol airport and appear to have no relationship with it. While a few faulty tags have only a marginal effect on categories with hundreds or thousands of entries, they completely distort smaller categories. A similar issue occurs when only a small subset of the POIs that belong to a certain category are actually tagged with that category. For instance, the category local government office has only nine POIs associated with it, yet one would expect a substantially larger number of such buildings in Amsterdam, a city of 800,000 inhabitants. Last of all, some categories are very heterogeneous with respect to the size of the POI they cover. The category stadium includes both the 53,000-seat Amsterdam Arena of the Ajax Amsterdam soccer club and several small neighbourhood practice courts spread throughout the city. For these reasons, we choose to exclude from the analysis any category with fewer than 50 entries or with an obvious heterogeneity of the size of POIs it covers. For the regression analysis, removing these small and ambiguous categories should improve the understanding of general CP utilization patterns across the city1. As a final step, the pre-processing routine removes outliers from the charge point set. For instance, charging stations are occasionally built in places that are difficult to access but highly visible, such as pedestrian zones. The primary objective of such a CP is to promote the idea of electric mobility, but it would skew the regression results. To reduce the influence of such biases, the bottom and top three percent of outlets with respect to average utilization are eliminated.
These pre-processing steps of the analytics application provide two inputs for the regression analysis—the vector of the dependent variable 𝐮 and the covariate matrix 𝐀. 𝐮 contains the utilization of each charging outlet, averaged over all outlets that share a specific charging station: 𝐮 = (𝑢̅̅̅, 𝑢1 ̅̅̅, … , 𝑢2 ̅̅̅̅̅)|𝐶| 𝑇 . 𝐀 is defined as follows: 𝐀 = [ 1 𝛿1 𝜌accounting,1 … 𝜌zoo,1 𝑥1,1 … 𝑥ℎ,1 1 𝛿2 𝜌accounting,2 … 𝜌zoo,2 𝑥1,2 … 𝑥ℎ,2 ⋮ ⋮ ⋮ ⋱ ⋮ ⋮ ⋱ ⋮ 1 𝛿|𝐶| 𝜌accounting,|𝐶| … 𝜌zoo,|𝐶| 𝑥1,|𝐶| … 𝑥ℎ,|𝐶|] . (3)
The first column of matrix 𝐀 represents the intercept, while the second column reflects 𝛿𝑗, the charge point density at the position of charge point j. It is calculated in the same way as the POI categories and followed by columns for the density of every POI category. The inclusion of the charge point density is necessary, since utilization as the dependent variable reflects the alignment between charging supply and demand in a given area. While demand is not directly observable, it can be inferred from utilization and CP density values. Essentially, if outlets in areas with high CP density values experience comparatively low utilization values, this implies that demand is overserved and the number of charge points in the area could be reduced without negatively affecting service quality. Finally, the
1 A threshold of 50 constitutes an experience value from working with the Amsterdam data; thresholds for other cities depend on the respective spatial extent and population size.
variables 𝑥1,𝑗 to 𝑥ℎ,𝑗 are demographic factors, such as population density or income, and the distance from the city centre at the location of the charge point.
3.4 Regression Analysis
As previously described, the distribution of CP utilization approximately follows a beta law within the interval [0,1]. The beta regression model assumes that the expected charge point utilization can be expressed as
𝑓(E(𝐮)) = 𝐀 𝜷, (4)
where 𝜷 is the transposed vector of regression coefficients and 𝑓(⋅) is a link function that maps [0,1]
onto ℝ. The regression estimation is performed by maximum likelihood with a logit transformation,
𝑓(𝑧) = ln ( 𝑧
1−𝑧), as a link function since it provides easily interpretable coefficients. Specifically, for a given utilization 𝑢𝑗, the effect of a change in a single covariate Δ𝐀𝑗,𝑣 equals the odds ratio
exp(𝛽𝑣⋅ Δ𝐀𝑗,𝑣) =
𝑢𝑗∗/(1 − 𝑢𝑗∗)
𝑢𝑗/(1 − 𝑢𝑗)
(5) with 𝑢𝑗∗ as the utilization after the change.
The first step of the spatial analysis is a variable selection procedure, which is conducted to reduce the inherent multicollinearity between POI categories. This multicollinearity results from two issues. First, there is a very large overlap between some categories. For instance, almost all restaurants are also labelled with the category food. The same is true for cafés and bars—often a single establishment is a restaurant, a café, a bar, and a place where one can get food. The second reason concerns the fact that even when POIs are described by a single category tag, some categories exhibit a similar geographical clustering since they often occur in the same setting. Examples include pedestrian zones in the city centre and shopping malls. Here different kinds of shops are often in very close proximity to one other. This may result, for instance, in a certain degree of collinearity between shoe store and clothing store. Even if they are different stores, they are often located close to each other (e.g. in a shopping mall), resulting in their densities behaving in a similar manner.
To address this issue, the analytics application executes a stepwise regression procedure that maximizes the adjusted pseudo-R2 while keeping variance inflation factors below the threshold of five. Table 1 summarizes descriptive statistics of variables that survive this procedure and the resulting regression output is illustrated in column (2) of Table 2. While preprocessing was done in Python, the regression was conducted using the betareg package in R.
Comparing these results to column (1), which reflects the regression output when including only “traditional” demographic and traffic data, emphasizes the tremendous increase in explanatory power resulting from the inclusion of point of interest data. This underscores the benefit that novel, crowd-sourced data sources like points of interest can contribute to the analysis of urban phenomena. Compared to traditional demographic factors, they do not capture where specific types of people live,
but rather where people go for specific activities. Depending on the phenomenon under investigation, the latter question may prove more powerful in identifying determinants or both types of data may complement each other.
Considering the coefficients in column (2), they are generally theoretically supported. The charge point density has a significantly negative influence, which represents the degree to which a new charge point draws a share of demand from those in its vicinity. The distance to the centre is significantly positive, which can be interpreted as a result of pedestrian zones in the city centre, better availability of public transport options, or more traffic the closer one gets to the centre.
As POIs are often tagged with several categories, their coefficients should generally be interpreted in relation to each other. Due to the high number of POIs associated with it (and the resulting comparatively high values, cf. Table 1), the category establishment provides a baseline and all other coefficients should be interpreted with this category in mind. Establishment effectively provides a general notion of potential trip destinations in Amsterdam, while other categories adjust the level of detail. On the one hand, POIs where people are likely to stay for an extended period of time, such as libraries, places of worship, or beauty salons, exhibit positive coefficients. On the other hand, coefficients for painters and contractors are negative, since these professions usually provide their services outside their premises.
3.5 Charge Point Placement
The final component of the analytics application is a prescriptive module that recommends locations for charge points depending on expected demand. We will first describe the demand projection in detail and then introduce the algorithm used to allocate charge points, along with its application to Amsterdam.
Table 1. Descriptive statistics
Mean Min Max S.D. Mean Min Max S.D.
CP-Density 19.27 2.00 40.09 9.91 Gym 3.16 0.00 8.92 2.36
Car Density 2.99 0.34 5.64 1.28 Hair Care 3.23 0.00 15.17 3.83
Dist. to Center 2.97 0.16 8.11 1.72 Health 112.01 3.32 224.27 64.01
Log Income p.P. 3.25 2.59 3.76 0.27 Hospital 2.37 0.00 6.67 1.54
Major Road 250 0.58 0.00 1.00 0.49 Jewelry Store 5.90 0.00 36.01 8.32
Accounting 5.69 0.08 17.72 4.11 Library 2.01 0.00 11.30 2.25
Art Gallery 7.85 0.00 52.70 12.49 Museum 7.53 0.00 41.88 9.86
Bakery 5.94 0.00 17.44 4.39 Painter 1.31 0.00 6.08 1.11
Bar 5.08 0.00 37.37 8.40 Parking 1.80 0.00 8.71 2.13
Beauty Salon 12.60 0.17 41.62 9.37 Pharmacy 2.70 0.00 5.87 1.50
Bus Station 6.00 0.00 29.97 4.90 Physiotherapy 6.50 0.02 15.80 3.89
Car Repair 3.40 0.00 11.39 2.79 Place of Worship 1.29 0.00 10.19 1.85
Clothing Store 13.31 0.00 70.84 16.80 School 34.20 4.35 65.66 15.86
Establishment 319.8 110.92 540.04 85.92 Shoe Store 7.73 0.00 57.23 11.85
Furniture Store 7.45 0.00 24.79 6.19 Store 138.41 11.59 438.68 108.56
Gen. Contractor 2.08 0.00 13.20 2.07 Travel Agency 11.73 0.00 51.41 10.97 The table displays mean (Mean), minimum value (Min), maximum Value (Max), and standard deviation (S.D.) for each covariate.
Table 2. Regression output
(1) (2) (3)
Intercept -2.279 (0.279) *** -2.396 (0.439) *** -3.021 (0.204) ***
Charge Point Density 0.002 (0.004) -0.013 (0.006) ** -0.014 (0.006) **
Car Density -0.010 (0.018) -0.026 (0.023)
Distance to Center 0.033 (0.020) * 0.108 (0.024) *** 0.104 (0.023) ***
Log Income per Person 0.143 (0.088) -0.212 (0.126) *
Major Road within 250m 0.013 (0.043) 0.054 (0.047)
Accounting 0.038 (0.011) *** 0.031 (0.010) *** Art Gallery -0.038 (0.008) *** -0.046 (0.006) *** Bakery 0.052 (0.020) ** 0.050 (0.019) *** Bar 0.020 (0.012) * 0.024 (0.011) ** Beauty Salon 0.024 (0.011) ** 0.033 (0.009) *** Bus Station 0.022 (0.007) *** 0.020 (0.006) *** Car Repair 0.052 (0.013) *** 0.060 (0.012) *** Clothing Store 0.041 (0.009) *** 0.035 (0.007) *** Establishment 0.004 (0.000) *** 0.003 (0.000) *** Furniture Store 0.074 (0.016) *** 0.077 (0.016) *** General Contractor -0.024 (0.014) * -0.024 (0.012) * Gym 0.031 (0.022) 0.047 (0.019) ** Hair Care 0.043 (0.018) ** Health 0.008 (0.003) *** 0.005 (0.002) ** Hospital -0.075 (0.027) *** -0.057 (0.026) ** Jewelry Store -0.024 (0.016) Library 0.107 (0.026) *** 0.085 (0.022) *** Museum 0.021 (0.009) ** 0.029 (0.008) *** Painter -0.043 (0.030) Parking 0.048 (0.031) 0.049 (0.029) * Pharmacy -0.132 (0.034) *** -0.118 (0.032) *** Physiotherapy -0.058 (0.016) *** -0.068 (0.015) *** Place of Worship 0.061 (0.034) * School -0.009 (0.005) * Shoe Store -0.035 (0.009) *** -0.026 (0.008) *** Store -0.005 (0.002) ** -0.006 (0.002) *** Travel Agency -0.081 (0.010) *** -0.073 (0.010) *** Pseudo-R2 0.011 0.28 0.262
10-fold CV improvement vs. naïve -0.01 % 7.68 % 7.99 %
MCCV improvement vs. naive -0.01 % 6.53 % 7.22 %
The dependent variable is Charge Point Utilization. Standard errors are in parentheses. Significance is indicated at 10% (*), 5% (**), and 1% (***) levels. 10-fold cross validation (CV) and Monte Carlo cross validation (MCCV) values show the reduction of the root-mean-square error compared to the naïve model. MCCV was run 1,000 times with 70/30 splits.
3.5.1 Demand Projection
Expected demand is calculated for the entire city using the coefficients in column (3) of Table 2. Column (2) contains several variables that have no significant influence and whose relevance needs to be clarified. On the one hand, the application should not exclude variables that might provide substantial explanatory power; on the other hand, it would be unwise to include irrelevant categories, since they might skew the regression results. Therefore, insignificant variables are sequentially eliminated until none remain, resulting in the coefficients summarized in column (3). Since some multicollinearity between variables remains and is unavoidable given the spatial characteristics of a city, some variables
that were not significant in column (2) become significant as other variables are eliminated. Since placing charge points based on expected demand in a given area contains a predictive element, we also analyse the out-of-sample performance of our model by conducting 10-fold cross validation and Monte Carlo cross validation (repeated random subsampling) (Shao 1993, Pant and Sheng 2015). As shown in Table 2, predictive performance and explanatory performance are largely aligned. The model based on “traditional” demographic data provides no insights into the dynamics of charge point utilization while the models based on points of interest reduce the root-mean-square error by approximately seven percent. It is noteworthy that the smaller model in column (3) outperforms the large model in column (2). This confirms that the third model is superior to the second model for predictive purposes.
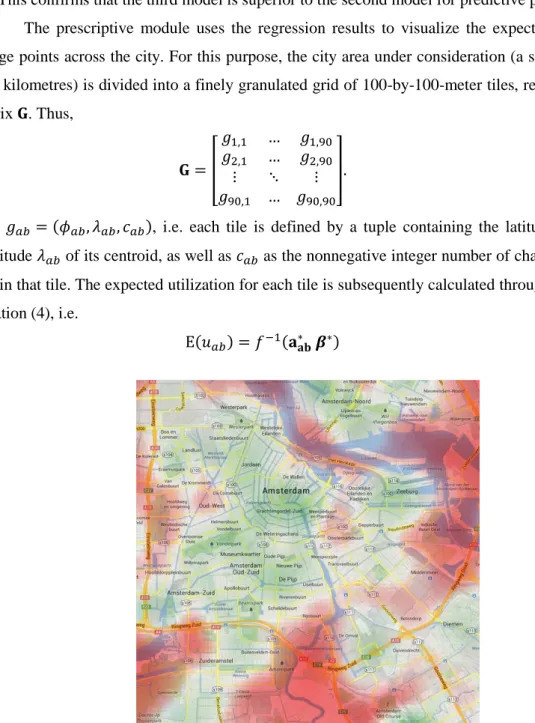
The prescriptive module uses the regression results to visualize the expected utilization of charge points across the city. For this purpose, the city area under consideration (a square of nine by nine kilometres) is divided into a finely granulated grid of 100-by-100-meter tiles, represented by the matrix 𝐆. Thus, 𝐆 = [ 𝑔1,1 … 𝑔1,90 𝑔2,1 … 𝑔2,90 ⋮ ⋱ ⋮ 𝑔90,1 … 𝑔90,90 ]. (6)
with 𝑔𝑎𝑏 = (𝜙𝑎𝑏, 𝜆𝑎𝑏, 𝑐𝑎𝑏), i.e. each tile is defined by a tuple containing the latitude 𝜙𝑎𝑏 and the longitude 𝜆𝑎𝑏 of its centroid, as well as 𝑐𝑎𝑏 as the nonnegative integer number of charge point outlets within that tile. The expected utilization for each tile is subsequently calculated through the inverse of equation (4), i.e.
E(𝑢𝑎𝑏) = 𝑓−1(𝐚𝐚𝐛∗ 𝜷∗) (7)
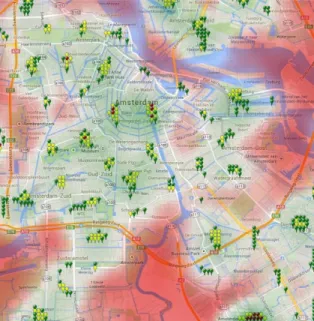
Figure 5. Green-field estimation of charge point utilization in Amsterdam (green areas represent high utilization while red areas represent low utilization)
with 𝐚∗ as a vector containing the values of the covariates listed in column (3) of Table 2 at the location of tile 𝑔𝑎𝑏, 𝜷∗as the transposed vector of regression coefficients listed in the same column, and 𝑓−1(⋅) as the inverse of the logit transformation. Executing this calculation for each tile, the module visualizes the results in the form of a heat map, as illustrated in Figure 5. Green areas indicate high expected utilization while red areas represent low demand. Here, the heat map represents the green-field estimate, i.e. the expected utilization if no charge point existed. In this case, if only one charge point would need to be set, it would be placed at the location with the highest expected utilization. In the vicinity of this location, expected utilization would subsequently decrease due to the negative coefficient of charge point density. This reflects the fact that the charge point satisfies part of the demand in the area— utilization for further charge points, as a measure of balance between supply and demand, decreases. 3.5.2 Charge point placement in Amsterdam
Placement becomes substantially more complex if some CPs already exist (as is currently the case in Amsterdam) or if multiple charge points need to be allocated at once (as would be expected in a city that starts building up infrastructure). Following equation (5) and the negative coefficient from Table 2, a new charge point cannot simply be placed based on expected utilization, since it will increase the charge point density for all already-existing charge points in its vicinity, reducing their utilization by drawing some of their demand. We tackle this issue by employing a greedy algorithm that corrects for this effect.
To maximize the aggregate utilization of 𝑧 charge point outlets within the city, with the city represented by matrix 𝐆, the following optimization problem defined by equations (8), (9), and (10) needs to be solved. Note that 𝐂 is a matrix that contains the 𝑐𝑎𝑏-values for each 𝑔𝑎𝑏 in 𝐆, i.e. it is a matrix of the number of charge points in each tile of the grid.
max 𝐂 ∑ ∑ 𝑐𝑎𝑏⋅ 𝑓 −1 ( 𝛽0 ⏞ intercept + 𝛽⏞ 2⋅ 𝑑(𝑔𝑎𝑏, 𝑔0) distance to center + ∑(𝛽𝑘+2⋅ 𝜌𝑘,𝑎𝑏) 22 𝑘=1 ⏞ POIs ⏞ part 1 + 𝛽⏞ 1⋅ 𝛿𝑎𝑏 CP density ⏞ part 2 ) 𝑛 𝑏=1 𝑚 𝑎=1 . (8) 𝛿𝑎𝑏= ∑ ∑ 𝑐𝑖𝑗⋅ 𝜌𝑎𝑏,𝑖𝑗 𝑛 𝑗=1 𝑚 𝑖=1 . (9)
In this objective function, 𝑓−1(⋅) is the inverse link function, producing the expected utilization of a charging outlet at the location of cell 𝑔𝑎𝑏, which is multiplied by the number of outlets in that cell
𝑐𝑎𝑏. For any particular cell 𝑔𝑎𝑏, the terms summarized as “part 1” in the function input are fixed; they represent the impact of the regression intercept, the distance to the centre 𝑔0 from the tile 𝑔𝑎𝑏, and the influence of the POIs in the final regression model at tile 𝑔𝑎𝑏, respectively. The only dynamic component is summarized as “part 2,” containing the influence of other charge points in the vicinity on
expected utilization, as detailed in equation (9). Hence, as previously mentioned, whenever a new charge point is placed, the expected utilization for surrounding existing charge points decreases. The optimization problem is subject to constraint (10), which restricts the sum of outlets placed to 𝑧.
∑ ∑ 𝑐𝑎𝑏 𝑛 𝑏=1 𝑚 𝑎=1 ≤ 𝑧, (10)
If we vectorise matrix 𝐂into a vector 𝒄, we can express the problem as:
max 𝒄 ∑ 𝑣𝑎(𝒄) ⋅ 𝑐𝑎 𝑚𝑛 𝑎=1 (11) s.t. ∑ 𝑐𝑎 𝑚𝑛 𝑎=1 ≤ 𝑧 𝜕𝑣𝑎 𝜕𝑐𝑎′≤ 0 ∀𝑎, 𝑎 ′ ∈ {1 … 𝑚𝑛} 𝑐𝑎∈ {0,1, … , 𝑧} ∀ 𝑐𝑎∈ 𝒄.
Essentially, this is equivalent to a combinatorial allocation problem with multiple homogeneous items (charge points) (Parkes 2001), but with interdependent valuation functions that are also nonlinear. Specifically, the valuation (utilization) in tile 𝑎 decreases (according to the inverse link function) if the number of charge points in tile 𝑎 increases, but also if it increases in any tile 𝑎′ within a one kilometer radius of 𝑎. This results in a highly complex problem that is, even for very small instances, difficult to solve through brute force.
We propose a heuristical approach to finding a solution for this maximization problem. Specifically, we apply a greedy algorithm, developed and implemented in Python, that takes these interdependencies between the tiles into account. It corrects the utilization of a new outlet in a given tile by the detrimental impact exerted on the utilization of existing outlets in the vicinity. Figure 6 provides a simplified example of this process. Currently, two outlets exist in the central tile (expected utilization of 20 percent) and one outlet in the bottom left tile (expected utilization of 23 percent). An additional outlet in the central tile would decrease the utilization there to 18 percent and to 22 percent in the bottom left tile. Hence, the net utilization effect of this additional outlet is 13 percent. The greedy
Figure 6. Sample calculation of utilization effect resulting from an additional outlet in the central tile
algorithm executes this calculation for every tile and chooses the tile with the highest net utilization gain for the new outlet.
This ensures that the algorithm selects the optimal tile in each step. However, there remains the possibility that simultaneous optimization would provide a better overall allocation, if feasible. Table 3 shows that the allocation resulting from the greedy algorithm already provides a substantial increase of the average utilization across all charge points. Expected utilization is projected to increase by 15 percent, from 0.17 to 0.20. Figure 7 illustrates the resulting distribution of charge points in Amsterdam compared to the existing infrastructure. Clearly, the algorithm produces a spatial distribution that is much more clustered at specific hot spots than the existing infrastructure. This indicates that city planners in Amsterdam may have not only been concerned with utilization, but also other objectives. For instance, they may have intended to reduce range anxiety in EV drivers. Also, some of the charge points in Amsterdam have been set up at locations that are very visible in order to promote electric mobility, even if they are impractical for charging. Interestingly, Table 3 also shows that range anxiety does not become more of a problem for the recommended infrastructure. The median, average, and
Table 3. Comparison between actual and recommended distribution
Actual infrastructure Ideal infrastructure
Average utilization over all CPs 0.17 0.20
Distance to nearest CP
- Median 323m 410m
- Average 460m 485m
- Maximum 1,957m 2,082m
(a) Actual infrastructure (b) Recommended distribution
Figure 7. Actual infrastructure in Amsterdam compared to recommended distribution (a green marker represents 1 outlet, yellow 2 outlets, and red 3 outlets)
maximum distances to the nearest CPs increase only very slightly compared to the existing infrastructure.
4. Discussion and Implications
Our showcase illustrates the potential benefit cities and municipal governments can derive from data-driven decision-making. As part of smart city transformations around the globe, cities are becoming increasingly sentient. For instance, streetlights, busses, or waste containers are equipped with sensors that provide data on their usage or position. However, cities only become truly smart if this data is used for smart decision-making. As we outline in our PVA framework (Figure 2), this can be achieved either at an operational or a strategic level. Our showcase provides an illustrative example of the latter case. While we do not suggest that Amsterdam tear down its existing infrastructure, future expansions of the charge point network may be placed more efficiently through data-driven recommendations from the analytics application. Furthermore, other cities that are just building up their charging networks can effectively learn from the experiences of Amsterdam. They can use the Amsterdam training set as the foundation of their planning strategies since POI data is globally available through services such as Google Maps or openstreetmap.
4.1 Applying the PVA Framework
As previously mentioned, the guiding questions of the PVA framework allow for a structured approach to an overall assessment of the strategic value of big data and analytics applications in public sector decision-making. We will illustrate this process using our showcase example and by grouping the questions into three categories: requirements (questions I and II), value creation (III and IV), and reinforcement (V and VI).
4.1.1 Requirements
Both, question I (Is there legitimacy / support from the authorizing environment for the use of the analytics application?) and II (Is the analytics application operationally feasible?) relate to fundamental requirements that need to be met before the analytics application can be implemented and used. Regarding legitimacy and support, there has been a clear mandate for fostering electric mobility in many countries around the globe, further strengthened by recent issues and scandals surrounding diesel engines (Bailey 2015). An extensive charging infrastructure is indispensable for this process and, as we have argued, using analytics supplies it with objective, data-driven input. Legitimacy may be lost if other rights are violated by the use of analytics—for instance, data privacy. However, the data used in our showcase is openly available and demographic variables are aggregated such that the identification of specific individuals is impossible.
Now that it has been developed, our application can be easily applied to any city in the world without substantial requirements with respect to IT infrastructure and data science knowledge.
However, the question concerning the capacity to originate such an analytics project in the first place is less clearly answered. As initially mentioned, facing strong competition from the private sector, the public sector fights an uphill battle in trying to attract analytics talent—the people necessary to realize these kinds of projects. Our showcase suggests two measures to address this challenge. First, making urban sensor data openly accessible connects the city to a global community of data scientists and helps to potentially outsource the actual development of analytics algorithms. Our study would have been substantially more difficult if charging data was not openly accessible and would have had to be acquired through bureaucratic processes. Second, while Vidgen et al. (Vidgen et al. 2017) argue that companies need to work with academia to successfully leverage analytics, this notion is even more relevant for public sector organizations. Algorithms need to be developed and tailored to specific urban challenges and data environments, which requires a high level of expertise, while the impact of the data-driven decisions needs to be evaluated over time. Both aspects—system design and evaluation—align well with academic research projects.
4.1.2 Value Creation
Questions III and IV cover how and which strategic public value comes into play. Regarding the how, it is clear that strategic value from analytics is derived by improving strategic decision-making, since we consider major investment decisions. Concerning the which, we initially argued that the analytics application discussed in our study can mainly be perceived by focusing on the trade-off between environmental value—optimizing the placement of charge points to encourage electric mobility given a fixed budget—and economic value—ensuring a given level of aggregate utilization at minimal cost. From the latter perspective, the spatial analytics application enables the city and its utilities to provide a fixed level of demand coverage at 15 percent lower investment costs. For instance, the 296 charge points within the city of Amsterdam that constitute our dataset provide approximately 880,000 hours of charging per year, assuming an average of two outlets per charge point and a utilization of 17 percent. If this utilization is increased to 20 percent through prescriptive analytics, the same number of charging hours could be supplied through just 252 charge points. Public curbside charge points are substantially more expensive than at-home chargers and total investment costs can vary between USD 10,000 and 60,000 (Agenbroad and Holland 2014), depending on type, protection, equipment, and required installation labour. Assuming an intermediate price of USD 20,000, a city such as Amsterdam can save about USD 880,000 in necessary investments, as outlined in Table 4.
The environmental value follows from the fact that public budgets for specific projects are often fixed, so the city may have to build all 296 charge points. In this context, we can think of the showcase as placing charge points in areas where people can actually use them, thus making the switch to electric mobility more appealing and inducing public demand for EV charging. In part B of Table 4 we calculate a CO2 footprint reduction of 15 percent as a result of more renewable energy used for driving instead of gasoline. At a standard type 2 charger with 3.3 kW power, the resulting 513,500 kilowatt-hours of
energy that can be charged per year translate into 150,100 litres of gasoline saved, using data from the Chevrolet Volt. Overall, the city of Amsterdam can reduce annual CO2 emissions by 422 metric tons. Given that annual CO2 emissions of the average European household stand at approximately five tons (European Environment Agency 2008), placing charge points strategically based on analytics allows the city to reduce its environmental footprint by the equivalent of a medium-sized residential area. In addition to this directly measurable impact, an increase in the adoption of electric mobility will also affect public health, since noise levels and other pollutants beyond CO2 will be reduced. However, these effects manifest over a long time and are more difficult to measure than the directly quantifiable effect on CO2 emissions.
Nevertheless, public officials need to consider other public value aspects, as well, before blindly implementing the suggested allocation. For instance, focusing on utilization may leave large parts of the city uncovered, possibly contributing to range anxiety, or may exclude certain parts of the population from adopting electric vehicles. While we cannot observe such an effect in our example case of Amsterdam, public officials need to be aware of these considerations.
Regarding system costs, the application introduced in this paper is lightweight and has been developed through a combination of different types of open-source software—Python for data collection and the placement algorithm, R for the data analysis, and QGIS for visualization—keeping system costs comparatively low. As a result, the economic and ecological benefits outlined above are effectively net benefits since system costs are negligible in comparison. For instance, for a city replicating the Amsterdam system, we estimate system costs to be an order of magnitude lower than the potential benefit.
4.1.3 Reinforcement
Questions V and VI investigate how analytics and the strategic value it generates affect the other two Table 4. Calculating economic and ecological benefits of showcase analytics application
A Potential Cost Savings for Amsterdam
(1) Price per charge point (Agenbroad and Holland 2014) 20,000 USD
(2) Number of charge points saved 44
(3) (1) × (2) 880,000 USD
B Approximation of CO2 Reduction in Amsterdam (Assuming Electric Energy from Renewable Sources)
(4) Three percentage point increase in annual charging hours 155,600 h
(5) Corresponding increase in annual energy charged at 3.3 kW
charging
513,500 kWh
(6) Corresponding liters gasoline saved using EPA specifications for
Chevrolet Volt 2015 (U.S. Environmental Protection Agency 2016)
150,100 l
(7) Well-to-wheels CO2-equivalent emissions from gasoline (U.S.
Department of Energy 2016)
2.81 kg/l
dimensions from Moore’s original strategic triangle, potentially encouraging a virtuous cycle that fosters the use of big data and analytics in public sector management. From a legitimacy perspective, analytics can make decision-making more transparent. For instance, the municipality can publish the data and methodology used to determine charge point placement, as well as the main drivers of utilization that were identified. It can further clarify how these results were then incorporated into the final decision. By increasing transparency and using objective criteria, support for the use of analytics in other areas, such as road or public transportation planning, can be strengthened.
With respect to operational capacity, the analytics application can serve as a seed project (Gust et al. 2017) that familiarizes public employees with data-driven decision-making. An illustrative example of analytics at work that provides a tangible benefit to the city may provide incentives to reduce personal, organizational, and technical barriers within the city government. Examples include a change in the mind-set of employees, cross-departmental work, and data integration. Thus, the analytics application may serve as a catalyst to improve organizational readiness for big data and analytics.
4.2 Limitations and Implications for Research
The PVA framework provides a starting point for research on the use and impact of big data and analytics in public management. Both the framework itself and the showcase indicate several areas for future research. First, the implications derived from the showcase of charge point placement in Amsterdam need to be applied to other contexts to improve them and to verify their general validity. On the one hand, this includes the application of our algorithm for data-driven charge point placement to other cities. Cities in different countries may differ with respect to the drivers of charging demand, public transportation alternatives, and the willingness to walk. Data analytics can help to uncover these dynamics and provide decision-makers with recommendations tailored to local mobility needs. On the other hand, spatial analytics applications such as the one introduced in this paper may provide new insights for a variety of other smart city challenges. While our research touches on several of the Four V’s of Big Data (IBM 2013)—for instance, volume (large number of charge point readings), variety (point, line, and area data; sensor and crowdsourced data), and veracity (errors in crowdsourced data and sensor readings)—it is just a beginning and the increasing availability of location data will continue to offer new opportunities for research and practice. Examples include predicting urban crime (Gerber 2014), analysing novel mobility services (Wagner et al. 2016), and uncovering the dynamics of urban tourism (Brandt et al. 2017). Leveraging spatial urban data, academia can contribute to making cities safer, more efficient, and more liveable. Future work may also seek ways to further improve the methods and algorithms used in our study. For instance, it may be possible to improve predictive power by separating POIs within a category into different groups (e.g. based on rating) or by analysing temporal variations.
Second, the PVA framework emphasizes that the strategic use of analytics in public management cannot be assessed only from a value perspective, but must also take equally into account
the dimensions of legitimacy and operational capacity. For instance, further research is needed to assess how citizens perceive the use of analytics by city governments—whether it truly improves trust in public decision-making and how privacy concerns factor into the equation. Furthermore, our showcase makes an argument for open data as a way for cities to acquire outside, project-specific analytics talent. By offering (semi-)open data platforms, cities can potentially create an ecosystem of analytics providers and academic institutions that use these datasets to supply public management with the analytical expertise necessary to address specific challenges. Nonetheless, the development and maintenance of such platforms is an operational challenge on its own. Through their experience with tackling such challenges, with IT services, and with digital business models, management scholars are able to assess how such ecosystems can function in an economically sustainable manner and which specific capabilities cities need in order to support these ecosystems.
5. Conclusion
Overall, this paper develops and applies a comprehensive framework to assess the strategic value of analytics in public sector decision-making based on Moore’s (1995, 2000) strategic triangle. In a first step, we summarize work that relates information technology and the concept of public value. In this context, we outline how analytics applications differ from e-government services, which have been the focus of research up to this point. In a second step, we extend Moore’s work into the realm of analytics and derive the framework, along with guiding questions that structure the assessment process. We then introduce the demonstration case of a prescriptive spatial analytics application that supports investment decisions regarding public charging infrastructure for electric vehicles in the city of Amsterdam. Leveraging open sensor data and crowdsourced data on points of interest, the application identifies key drivers of charging demand and provides recommendations on the ideal locations for charge points.
As a final step, we use the guiding framework to understand how analytics creates strategic value in the showcase. We illustrate how legitimacy and operational feasibility are requirements for the application of analytics on the one hand, but also how successful analytics projects, in turn, can improve support and operational capacity for the use of big data and analytics.
6. References
Agenbroad, J, Holland, B (2014) Pulling Back the Veil on EV Charging Station Costs. Rocky Mountain Institute, https://rmi.org/news/pulling-back-veil-ev-charging-station-costs/. Retrieved January 18, 2018.
Ahn S, Suh NP, Cho D-H (2013) Charging up the road. IEEE Spectrum 50(4):48–54.
AlSayyad N, Guvenc M (2015) Virtual Uprisings: On the Interaction of New Social Media, Traditional Media Coverage and Urban Space during the 'Arab Spring'. Urban Studies 52(11):2018–2034.