Innovation and Development around the World, 1960-2000
Daniel Lederman
Laura Saenz
Office of the Chief Economist Latin America and the Caribbean
The World Bank
Abstract
This paper presents a database of indicators of innovative activity around the world since the early 1960s. The data include measures of innovation outcomes as well as variables related to innovation effort. The main indicator of innovation outputs is patents. The main variables related to innovation inputs are investment in research and development (R&D) and technical personnel (engineers, scientists) working in R&D activities. The sources of these data are publicly available (OECD, UNESCO, etc.), yet there have been few attempts at double checking the consistency of these data and digitizing observations dating back to the 1960s. After discussing the sources and definitions of the data, the paper examines trends and patterns of innovation outputs and inputs by looking at the over-time behavior of the relevant series and comparing the performance of developing and high-income countries. The authors also provide cross-regional comparisons and a detailed examination of trends in selected countries. In turn, the authors provide estimates of the impact of innovation on long-run development by following an emerging empirical literature on the determinants of levels of GDP per capita. The econometric results
suggest that innovation might indeed have strong positive effects on long-run
development, which might be stronger than the direct effects of institutions. The analysis pays close attention to issues related to the potential endogeneity of innovation (and institutions) with respect to the level of development.
World Bank Policy Research Working Paper 3774, November 2005
The Policy Research Working Paper Series disseminates the findings of work in progress to encourage the exchange of ideas about development issues. An objective of the series is to get the findings out quickly, even if the presentations are less than fully polished. The papers carry the names of the authors and should be cited accordingly. The findings, interpretations, and conclusions expressed in this paper are entirely those of the authors. They do not necessarily represent the view of the World Bank, its Executive Directors, or the countries they represent. Policy Research Working Papers are available online at http://econ.worldbank.org.
I am grateful to Laura Saenz for her dedicated research assistance. She patiently constructed the database
from original and computerized sources. I am also grateful to William F. Maloney for his guidance and invaluable suggestions. José L. Guasch, Lauritz Holms-Nielsen, Guillermo Perry, Andrés Rodríguez-Clare, and Luis Servén provided helpful discussions and comments at various stages.
WPS3774
Public Disclosure Authorized
Public Disclosure Authorized
Public Disclosure Authorized
Innovation and Development around the World, 1960-2000
Daniel Lederman with Laura Saenz LCRCE
World Bank
I. Introduction
The role of technological progress has intrigued economists for many decades if not centuries. In Solow’s (1956) neo-classical treatment of the components of economic growth all countries face a common rate of technological progress. Thus poor countries were thought to be able to
catchup to the levels of development in rich countries as a consequence of diminishing returns to capital accumulation. Romer (1990) and many other proponents of modern growth theory
subsequently argued that the rate of technological progress is endogenous. Aghion and Howitt (1998) is perhaps the most comprehensive review of endogenous growth theories that focus on how growth and innovation interact, including how institutions and incentives affect the scope and pace of technological innovation across countries.
Endogenous growth theories quickly led to a growing empirical literature aiming to understand the factors that affect the rate of long-term economic growth across countries (Barro 1991; Caselli et al. 1996; many others). This literature argues that the neo-classical paradigm is still valid. These authors arrived at this conclusion by pointing out that poor countries tend to growth faster towards their steady-state level of income, which in turn is determined by a series of policy-related factors such as financial development, education, and openness to international trade.
2 In the late 1990s, Klenow and Rodríguez-Clare (1997) pointed out that growth
accounting exercises that ignore the complementarity between technological progress and capital accumulation tend to underestimate the role of technological progress in development. Likewise, Acemoglu and Zilliboti (2001) highlighted the role of complementarities between human capital and technological progress. It is now well understood that long-term development is driven mostly by productivity growth, or the portion of growth that is unrelated to capital accumulation (Easterly and Levine 2001). These theories and empirical evidence suggest that economic convergence or catch-up by poor countries toward the levels of income per capita observed in developed economies is not guaranteed. Growth seems to depend crucially on factors that determine the rate of technological progress that might be country specific as opposed to common to all countries. In spite of this, there are few studies of the impact of innovation on long-run national development. Lederman and Maloney (2003) provide estimates of the social rates of return to research and development (R&D) based on data presented in this paper.
The race to identify the main drivers of endogenous growth through cross-country growth regressions has recently been the subject of much criticism (e.g., Solow 2001). In part, the
criticism of this literature has been driven by the fact that these studies tend to focus on a rather long list of correlated explanatory variables. Moreover, the econometric techniques used for these analyses have grown in sophistication but still seem to be unconvincing to readers who believe that many of the explanatory variables are endogenous or not strictly related to policy interventions (Rodrik 2003). This growing skepticism of cross-country growth regressions seems to have led to an emerging empirical literature that attempts to explain the level of development (GDP per capita), rather than its growth rates. Hall and Jones (1998), Frankel and Romer (1999), Acemoglu et al. (2001) and a series of subsequent papers (Easterly and Levine 2003, Rodrik et
al. 2002) are notable examples of analyses of the determinants of levels of development. These analyses can be further justified by theories that propose mechanisms through which the stocks of capital (human, equipment, and knowledge capital) affect only the steady-state level of income, rather than the growth rate (Howitt and Mayer 2002; Klenow and Rodriguez-Clare 2004). The main empirical challenge of this emerging literature seems to be the identification of the impact of the exogenous portion of various factors, including the quality of public institutions (rule of law, corruption, etc.) and international trade (Acemoglu et al. 2001; Frankel and Romer 1999), on the level of GDP per capita. There is no existing study of the impact of innovation on long-run development along the lines proposed by this literature.
This vacuum in the development literature is striking because indicators of innovation output, such as patents, have been used as a measure of technological innovation output for quite some time. For example, the review article by Grilliches (1990) highlighted some advantages and disadvantages of the use of patent counts as indicators of innovation, and reviewed micro-econometric literature pointing to the role of R&D and patenting activity as correlates of
productivity growth across firms in the U.S. and other industrialized countries (see also Jaffe and Trajtenberg 2002). The rest of this paper is organized as follows: Section II presents the
database. Section III provides a descriptive analysis of worldwide trends in innovative activity, by looking at inter-regional and intra-regional trends. Section IV explains the findings of
empirical exercises to measure the impact of innovation on growth vis a vis other variables, such as institutions. Section V presents some conclusions and suggestions for other uses of this database.
4 II. Data: Definitions of Innovation Variables
As mentioned, our key variables are patent counts and R&D investment across countries and over time. The definition and sources used for each variable are found in the Annex. The following paragraphs briefly discuss variable definitions and coverage.
A. Patents
We use patents as indicators of the output of innovation. For this purpose we gathered data from the U.S. Patent and Trademark Office (USPTO) and from the European Patent Office (EPO). These countries presumably have the best existing intellectual property system and the high costs involved in the patent application process reflect the high potential economic returns to patenting in these markets (Maskus 2000). With data from these two sources, future research can address the question of whether the location of the patent request changes the empirical determinants and consequences of patents.
Data from the USPTO are available for the period 1963 to 2000 for 164 countries. Granted patents are assigned to countries based on the country of residence of the first inventor. The total number of observations was 8,372.1 Patents granted by the EPO are available for the period 1980-2000. The country of origin of a granted patent is also classified by the country of residence of the first inventor. Granted patents data were obtained for 172 countries (including Puerto Rico). The total number of observations for patents granted is 3,423.
1 For Germany, patents granted to inventors residing in the former East and West Germany were combined together
under “Germany" by the USPTO. In the case of former Czechoslovakia, USSR, and former Yugoslavia, patents grants are registered after they stopped existing. This happens because patents are classified by the country of residence of the inventor at the time of the application.
B. R&D investment
The main sources of data on R&D investment based on comparable definitions are
UNESCO, OECD, and RICYT for Latin American countries.2 These sources use surveys of
government agencies to compile information based on a common definition of R&D, which “includes fundamental and applied research, as well as experimental development.” However, R&D does not include investments in mining exploration or soil analysis, and thus might imply a bias against natural resource activities and agriculture.3
To check the consistency of the data, we compared country data across sources whenever possible. In addition, we examined the over-time variation within countries of the resulting series and discarded data that seemed not to follow reasonable patterns. For example, we discarded observations that were substantially (more than 50% in US dollar values at constant US prices) above or below preceding or subsequent observations. The resulting total number of observations for total R&D investment is 1,453.
In addition, future research could focus on the composition or structure of R&D funding and performance across countries. R&D funded and/or performed by productive firms might be more efficient than investments undertaken by government entities that are not tied to productive activities. Thus the database also covers the distribution of national R&D effort across sources of funding and the agents that perform the R&D activities. The available information covers the shares of total R&D funded and performed by the “productive” sector, as well as higher education and the “public” sector. The productive sector, however, includes private and public
2
RICYT is the Spanish acronym for Ibero American Science and Technology Indicators Network (Red
Iberoamericana de Indicadores de Ciencia y Tecnología). This source provides two alternative definitions of R&D, but these are actually two sub-components of R&D – investments in research and investments in development for a handful of countries. We use the total, which is available for most countries of the region. The data for Taiwan (China) are from the Taiwan (China) Statistical Yearbook.
3 UNESCO Statistical Yearbook (1980, p. 742). Definitions are common to the OECD, RICYT, and all are based on
6 firms and not-for-profit organizations engaged in production. The public sector relates to
organizations not engaged in production but belonging to the executive branch of governments. An additional category of the sources of R&D funding is foreign financing or “funding from abroad.” The final number of observations on the structure of R&D is broken down as follows:
- R&D funded by the productive sector: 1143 observations - R&D funded by the public sector: 924
- R&D funded from abroad: 924
- R&D performed by the productive sector: 878 - R&D performed by the public sector: 872
- R&D performed by higher education (as percent of total expenditure): 1020 C. R&D personnel
The number of scientists and engineers working in R&D activities is another proxy for innovation inputs. Some of UNESCO’s yearbooks had them classified under “researchers.” As with R&D investment, we had difficulties when we had two different sources for a country with different numbers for a given year. This was common for some Latin American countries when we used RICYT in addition to UNESCO since they use slightly different definitions (see
Annex). Again, we examined the time variation of the resulting series to ensure consistency. The total number of observations obtained was 1,393.
III. Data: International Comparisons
A. Country coverage and long-run regional comparisons
High-income countries have the best coverage in the database, followed by the regions of Latin America and the Caribbean and East Asia and the Pacific. Sub-Saharan Africa and Middle East and North Africa are under-represented.
Table 1 provides summary statistics of the patents and R&D variables in each region, as well as the countries with the highest and lowest means within each group.4 High-income countries have the highest levels of patents per 10,000 inhabitants granted by the American and European patent agencies, with averages equal to .55 and .29 respectively, and medians of .35 and .15. The standard deviation for these variables is also the highest in this group of countries. In contrast, South Asia has the lowest means for patents granted by both agencies: .0001 for USPTO patents and 0.00005 for European patents.
4 This table does not include countries with populations with 500,000 people or less in order to avoid overestimation
In the case of R&D investment as a percentage of GDP, high-income countries also have the highest mean and median values (1.55% and 1.58%). The regions with the lowest mean and medians are Sub-Saharan Africa (0.31% and 0.25%) and Latin America and the Caribbean (0.37% and 0.31%). For R&D personnel per 10,000 inhabitants, Europe and Central Asia has the highest mean and median values (22.18 and 20.04), and South Asia has the lowest values (.93 and .87).
With respect to the sectors that perform R&D, the productive sector has the highest levels in Europe and Central Asia and high-income countries with means of around 1% of GDP,
followed by the Middle East and North Africa and East Asia and the Pacific regions with means of approximately 0.7%. The rest of the regions have means between 0.10% and 0.20%. With respect to R&D performed by the public sector, most regions have means around 0.30%, except Latin America and the Caribbean and Sub-Saharan Africa, which have means of about 0.15%. The incredibly high shares of R&D performed by the productive sector in ECA countries are due to the fact that the productive sector includes public enterprises.
R&D financed by the productive sector is higher in all the regions than the R&D financed from abroad. R&D financed by the productive sector has the highest mean and median in high-income countries (0.83% and 0.74% of GDP), followed by East Asia and the Pacific (0.71% and 0.52%). Conversely, the lowest means and medians are found in South Asia (0.05%) and in Latin America and the Caribbean (0.07% and 0.06%). Please note that the share of R&D financed by the public sector is the remaining portion.
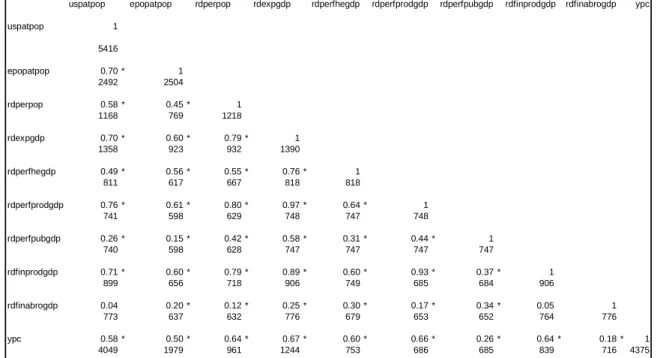
10 B. Correlations among innovation variables and the level of development
Table 2 shows pair-wise correlations among the innovation indicators and GDP per capita. Most of the correlations in the table are statistically significant, except in some cases for R&D financed from abroad. The table shows that patents granted by the USPTO and EPO are highly correlated with a correlation coefficient of 0.70. It also suggests that total R&D investment is highly correlated with patents as reflected in correlation coefficients of 0.70 and 0.60, with respect to U.S. and European patents respectively. R&D financed or performed by the productive sector are also highly correlated with patenting activity, with coefficients 0.61 and 0.76. However, it cannot be overstated that productive sector R&D includes state owned enterprises. The variables that show the lowest correlation coefficients with respect to patents are R&D performed by the public sector and R&D financed from abroad (coefficients between 0.15 and 0.26). R&D performed by the productive sector and R&D financed by the same sector are virtually identical (0.93). These two variables are also highly correlated with total R&D investment and personnel (correlations range from 0.80 to 0.97).
Table 2. Bi-Variate Correlations
uspatpop epopatpop rdperpop rdexpgdp rdperfhegdp rdperfprodgdp rdperfpubgdp rdfinprodgdp rdfinabrogdp ypc
uspatpop 1 5416 epopatpop 0.70 * 1 2492 2504 rdperpop 0.58 * 0.45 * 1 1168 769 1218 rdexpgdp 0.70 * 0.60 * 0.79 * 1 1358 923 932 1390 rdperfhegdp 0.49 * 0.56 * 0.55 * 0.76 * 1 811 617 667 818 818 rdperfprodgdp 0.76 * 0.61 * 0.80 * 0.97 * 0.64 * 1 741 598 629 748 747 748 rdperfpubgdp 0.26 * 0.15 * 0.42 * 0.58 * 0.31 * 0.44 * 1 740 598 628 747 747 747 747 rdfinprodgdp 0.71 * 0.60 * 0.79 * 0.89 * 0.60 * 0.93 * 0.37 * 1 899 656 718 906 749 685 684 906 rdfinabrogdp 0.04 0.20 * 0.12 * 0.25 * 0.30 * 0.17 * 0.34 * 0.05 1 773 637 632 776 679 653 652 764 776 ypc 0.58 * 0.50 * 0.64 * 0.67 * 0.60 * 0.66 * 0.26 * 0.64 * 0.18 * 1 4049 1979 961 1244 753 686 685 839 716 4375 Confidence level: *99%
Number of observations are shown under correlation coefficients
uspatpop Patents granted by the USPTO* epopatpop Patents granted by the EPO* rdperpop R&D personnel*
rdexpgdp R&D expenditure**
rdperfhegdp R&D performed by high education** rdperfprodgdp R&D performed by the productive sector** rdperfpubgdp R&D performed by the public sector** rdfinprodgdp R&D financed by the productive sector** rdfinabrogdp R&D financed from abroad**
ypc Real GDP per capita for year 2000 (1985 U.S.$ PPP)
* Per 10,000 inhabitants ** As percentage of G.D.P.
C. Inter-regional comparisons over time
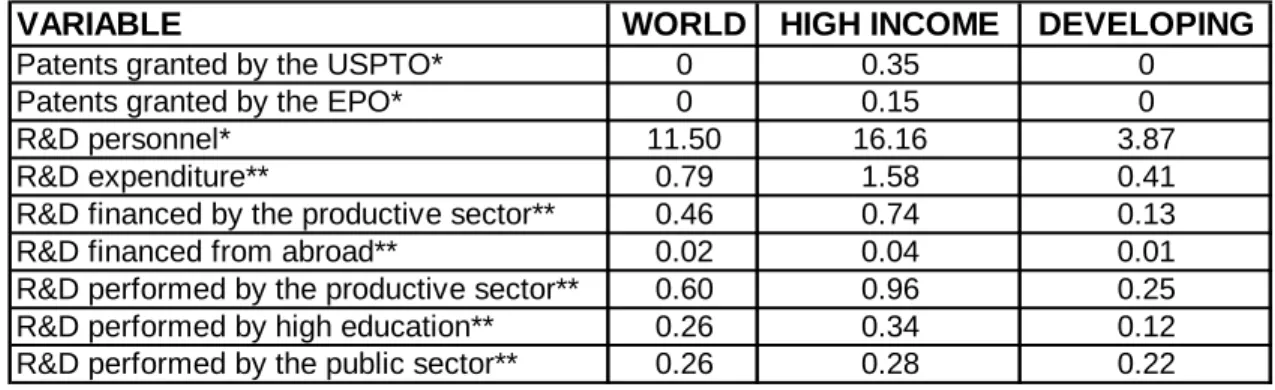
During the period of study, high-income countries show higher levels of R&D inputs as well as patent grants than the world as a whole and developing countries. Table 3 provides the median values for each innovation variable for the world as a whole, high-income countries, and developing countries (all remaining regions). High-income countries have much higher levels of patents granted by both patent agencies than the median for the world. This pattern is also observed in the rest of the R&D variables. In general, the median for the former group is between 30-100% higher than the world compared to levels of 50-70% lower than the world median in developing countries. For example R&D investment in high-income countries is
12 almost twice the level of the world median, whereas developing countries have half the world level. The only variable in which both groups of countries have a similar median with respect to the world is R&D performed by the public sector. Excluding this variable and patent grants, when we compare high-income countries and developing countries, the level of the R&D variables in the second group is roughly 20 to 35% of the levels observed in high-income countries.
Table 3. Innovation (Medians) in High-Income and Developing Countries
VARIABLE WORLD HIGH INCOME DEVELOPING
Patents granted by the USPTO* 0 0.35 0
Patents granted by the EPO* 0 0.15 0
R&D personnel* 11.50 16.16 3.87
R&D expenditure** 0.79 1.58 0.41
R&D financed by the productive sector** 0.46 0.74 0.13
R&D financed from abroad** 0.02 0.04 0.01
R&D performed by the productive sector** 0.60 0.96 0.25
R&D performed by high education** 0.26 0.34 0.12
R&D performed by the public sector** 0.26 0.28 0.22
* Per 10,000 inhabitants
** As percentage of G.D.P.
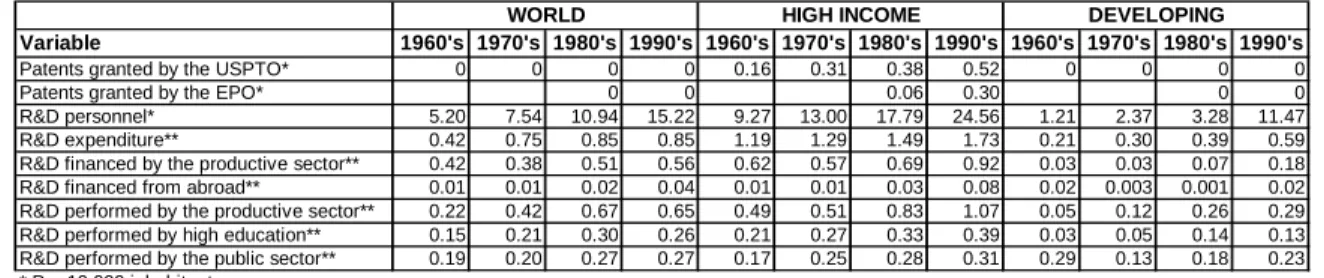
When we look at this data across time we observe the same pattern. High-income countries attained higher median levels of innovation indicators than the world and developing countries. Table 4 shows the medians for the variables from the previous table by decades. The world levels for some variables doubled or more between 1960 and 1990. This is the case for R&D performed by the productive sector, R&D personnel, R&D financed from abroad, and total R&D. When we compare each group of countries against the world median, we find that patent grants in high-income countries show considerably higher levels. Concerning the rest of the innovation indicators, high-income countries have on average, across the four decades, values of 30 to 100% higher than the world’s median, compared to levels of 15 to 50% of the world median in developing countries. For example, total R&D investment in high-income countries is
on average twice the median of the world throughout the four decades, compared to the 50% of the world median value observed in developing countries.
Table 4. Innovation (Medians) in High-Income and Developing Countries overt Time
Variable 1960's 1970's 1980's 1990's 1960's 1970's 1980's 1990's 1960's 1970's 1980's 1990's
Patents granted by the USPTO* 0 0 0 0 0.16 0.31 0.38 0.52 0 0 0 0
Patents granted by the EPO* 0 0 0.06 0.30 0 0
R&D personnel* 5.20 7.54 10.94 15.22 9.27 13.00 17.79 24.56 1.21 2.37 3.28 11.47 R&D expenditure** 0.42 0.75 0.85 0.85 1.19 1.29 1.49 1.73 0.21 0.30 0.39 0.59 R&D financed by the productive sector** 0.42 0.38 0.51 0.56 0.62 0.57 0.69 0.92 0.03 0.03 0.07 0.18 R&D financed from abroad** 0.01 0.01 0.02 0.04 0.01 0.01 0.03 0.08 0.02 0.003 0.001 0.02 R&D performed by the productive sector** 0.22 0.42 0.67 0.65 0.49 0.51 0.83 1.07 0.05 0.12 0.26 0.29 R&D performed by high education** 0.15 0.21 0.30 0.26 0.21 0.27 0.33 0.39 0.03 0.05 0.14 0.13 R&D performed by the public sector** 0.19 0.20 0.27 0.27 0.17 0.25 0.28 0.31 0.29 0.13 0.18 0.23 * Per 10,000 inhabitants
** As percentage of G.D.P.
WORLD HIGH INCOME DEVELOPING
Looking at what happened in each group of countries, we see positive trends for most of the variables. In high-income countries, the median values for patents granted by the U.S.PTO tripled between the 1960s and the 1990s. European patents granted to inventors residing in high-income countries quadrupled during 1980-2000. Other variables, such as R&D financed from abroad, R&D personnel, and R&D performed by the productive sector, increased by more than 100% from the 1960s to the 1990s. R&D financed from abroad increased by more than 500%. In the case of developing countries, increases were not observed in the median of patents, but the corresponding medians did increase for the rest of the R&D variables. For example, R&D
personnel and R&D financed and performed by the productive sector increased by more than 500% during this period. Also, total R&D investment and R&D performed by higher education increased by more than 100%. On the other hand, R&D performed by the public sector and R&D financed from abroad decreased over time in developing economies.
During the period 1960-2000, the gaps between developed and developing countries increased for patents, R&D financed from abroad, and R&D performed by the public sector by more than 100%. For the rest of the variables, especially for R&D personnel and R&D financed and performed by the productive sector, the gaps decreased by 50 to 80%. Despite this reduction,
14 high-income countries still show levels between 2 and 5 times larger than developing countries in the1990s.
D. Overview of country-specific trends in R&D effort
There are considerable cross-country differences not only between high income and developing countries, but also within each group. Since country data availability varies within regions, here we examine over-time trends of selected countries with substantial data coverage in order to provide a dynamic view of the evolution of the structure of R&D investments. The selected economies cover most regions of the world and include Argentina, Brazil, Finland, France, Hungary, India, Israel, Korea, Madagascar, Mexico, Philippines, South Africa, Sweden, Taiwan (China), and the United States. Table 5 shows the evolution of total R&D effort and its structure over five-year periods.
Table 5. Total R&D and R&D Financed by the Productive Sector -- Selected Countries
1960-64 1965-69 1970-74 1975-79 1980-84 1985-89 1990-94 1995-99
ARGENTINA R&D (% of GDP) 0.595 0.560 0.704 0.936 0.392 0.382 0.315 0.413 ARGENTINA Financed by Productive Sector (% of GDP) 0.087 0.060 0.031 0.071 0.113
BRAZIL R&D (% of GDP) 0.344 0.608 0.481 0.380 0.828 0.844
BRAZIL Financed by Productive Sector (% of GDP) 0.000 0.107 0.112 0.215 0.331
MEXICO R&D (% of GDP) 0.168 0.194 0.543 0.285 0.255 0.354
MEXICO Financed by Productive Sector (% of GDP) 0.016 0.007 0.010 0.043 0.068
FRANCE R&D (% of GDP) 1.490 2.039 1.778 1.704 1.990 2.235 2.375 2.239
FRANCE Financed by Productive Sector (% of GDP) 0.447 0.654 0.661 0.701 0.828 0.945 1.084 1.145
SWEDEN R&D (% of GDP) 1.180 1.270 1.463 1.735 2.361 2.835 2.965 3.663
SWEDEN Financed by Productive Sector (% of GDP) 0.664 0.701 0.799 1.018 1.421 1.717 1.833 2.360
U.S.A. R&D (% of GDP) 2.806 2.804 2.369 2.161 2.499 2.760 2.588 2.581
U.S.A. Financed by Productive Sector (% of GDP) 1.028 0.981 0.953 0.953 1.222 1.347 1.443 1.608 HUNGARY R&D (% of GDP) 1.776 1.833 2.459 2.889 2.508 2.335 1.082 0.694 HUNGARY Financed by Productive Sector (% of GDP) 0.055 0.070 0.082 1.965 1.810 0.602 0.247
INDIA R&D (% of GDP) 0.192 0.256 0.376 0.434 0.621 0.818 0.713 0.621
INDIA Financed by Productive Sector (% of GDP) 0.023 0.050 0.065 0.090 0.094 0.136
ISRAEL R&D (% of GDP) 0.892 1.080 1.359 2.126 3.229 2.840 2.571 3.229
ISRAEL Financed by Productive Sector (% of GDP) 0.094 0.144 0.466 0.721 0.983 1.240
KOREA R&D (% of GDP) 0.240 0.366 0.357 0.529 0.833 1.692 2.098 2.565
KOREA Financed by Productive Sector (% of GDP) 0.046 0.040 0.224 0.455 1.371 1.746 1.876 PHILIPPINES R&D (% of GDP) 0.144 0.170 0.158 0.233 0.173 0.178 0.177 PHILIPPINES Financed by Productive Sector (% of GDP) 0.028 0.000 0.000 0.027 0.004
TAIWAN R&D (% of GDP) 0.829 0.879 1.168 1.739 1.896
TAIWAN Financed by Productive Sector (% of GDP) 0.263 0.358 0.524 0.873 1.131 MADAGASCAR R&D (% of GDP) 0.425 0.463 0.675 0.186 0.181 0.263 0.293 0.170
MADAGASCAR Financed by Productive Sector (% of GDP) 0.000 0.000 0.000
SOUTH AFRICA R&D (% of GDP) 0.820 0.773 0.724
SOUTH AFRICA Financed by Productive Sector (% of GDP) 0.414 0.320 0.362
FINLAND R&D (% of GDP) 0.713 0.849 0.978 1.321 1.737 2.136 2.764
FINLAND Financed by Productive Sector (% of GDP) 0.325 0.442 0.524 0.735 1.031 1.177 1.726 IRELAND R&D (% of GDP) 0.420 0.591 0.706 0.683 0.699 0.824 1.062 1.342 IRELAND Financed by Productive Sector (% of GDP) 0.213 0.264 0.228 0.281 0.408 0.675 0.893
One group of countries stands out for low level of total R&D investment as a share of GDP. Some countries invested less than 1% of GDP in R&D, with wide fluctuations, during 1960-2000. These countries are Argentina, Brazil, Mexico, India, Philippines, Madagascar, and South Africa. Within this group, the highest levels (between 0.5 and 0.8% of GDP) are observed in Argentina, Madagascar, South Africa, Brazil, and India, in different decades with different durations. It is interesting to note that India increased its R&D expenditure by over 300% between 1960 and 1989. The lowest levels of R&D expenditure (0.3% of GDP or less) within this group are found in Madagascar and Mexico at different points in time. In this group of countries, the participation of the productive sector in financing R&D has increased considerably in South Africa (since the early 1980s) and Brazil (in the 1990s), reaching levels of 0.30% of GDP and higher. In this last country, the productive sector financing tripled between the 1970s and 1990s. Productive sector financing also increased in Argentina, Mexico, and India, but reached lower rates than in the previously mentioned countries (0.15% of GDP or less).
Another group is composed of countries that reached a level of R&D investment of 2% of GDP and have either stayed at this high level or increased this ratio during the period of study. These economies are the U.S., France, Israel, Sweden, Finland, Korea, and Taiwan (China). Table 5 shows that the last four countries had an uninterrupted growth in total R&D. During 1960-1990, Sweden and Finland increased their investment in R&D by more than 200% and Korea by 900%! Between the late 1970s and 1990s, Taiwan (China) increased total R&D by more than 100%. Levels of 2.5% of GDP reached in the U.S. since the 1960s were reached by Sweden and Israel in the 1980s and by Finland and Korea in the late 1990s. Within East Asia and the Pacific, the trends experienced by Korea and Taiwan (China) greatly contrast with the
16 During 1960-2000 the participation of the productive sector in conducting research has been on average 0.80% of GDP in France and 1.20% in the U.S. An upward trend was
experienced by Sweden and Finland, where productive sector participation in R&D grew briskly and reached levels of 2.4% and 1.7% of GDP respectively. In Korea the participation of the productive sector also increased from 0.05% of GDP in the late 1960s to 1.88% in the late 1990s; in Taiwan (China) R&D financed by the productive sector grew by 300%, and in Israel by 900%.
In other cases, R&D trends have been negative. This is the case of the ECA region. Hungary, for example, reached levels of R&D investment of 2.5% of GDP in the 1970s and early 1980s, but suffered a severe reduction, reaching levels of less than 1% in the late 1990s. Also, this country experienced a reduction in the share of the productive sector R&D. These trends were thus associated with the decline of public expenditures and reduction in the incidence of state owned enterprises in the productive economy.
IV. Innovation and Development: Econometric Evidence
Thus far the analysis of the data has been descriptive, although patenting activity and R&D effort are both positively correlated with the level of development. A key question to address is whether innovative activity has an effect on long-term development, after controlling for other determinants of the level of development.
To approach this question the subsequent analysis follows an emerging literature that examines the empirical determinants of the levels of GDP per capita across countries. By focusing on the levels of development, this literature addresses the determinants of long-run development. In fact, there are strong theoretical reasons to expect that certain factors, such as geography, trade, institutions, and even innovation might explain levels of development but not
necessarily the observed growth rates of GDP per capita. For example, in theoretical models by Aghion and Howitt (1998), Howitt and Mayer (2002), and Klenow and Rodriguez-Clare (2003), all countries grow at the same rate in their steady states, but those with higher innovative activity have higher steady state levels of development. These dynamics are due, in theory, to the way in which technological improvements are diffused across borders. Innovation leaders push the technological frontier forwards, and subsequently the followers can benefit from the growth of productivity. But the leaders are permanently richer in these models and thus there is not convergence of income levels between followers and leaders. In any case, here we follow the empirical literature.
A. The empirical literature
An important challenge in the empirical literature is to identify the impact of exogenous components of various variables on the level of development. Frankel and Romer (1999) used a trade gravity model to estimate the share of trade over GDP that is due to geographical factors, such as distance to the major consumption markets. In turn, they estimated the effect of this exogenous portion of trade shares on GDP per capita. Acemoglu et al. (2001) instigated a growing number of studies that used settlers’ mortality rates in the 17th and 18th century as an historical determinant of institutional quality. Other studies that followed this line of inquiry include Rodrik et al. (2002) and Easterly and Levine (2003). These studies also control for geographic factors such as the condition of being a landlocked territory and latitude (as a proxy for proximity to the equator). Dollar and Kraay (2003), however, have raised some doubts about the ability of these models to truly identify the impact of trade and institutions on levels of development due to the fact that the instrumental variables (settlers mortality rates and
18 institutional quality (see Kaufmann and Kraay 2002). Sachs (2003) further argued that
“institutions do not rule” in terms of being the only statistical significant determinant of levels of development. This author argues that the incidence of malaria is also a robust predictor of GDP per capita levels.
In spite of the potential pitfalls of this emerging literature, here we follow it in order to assess the extent to which levels of innovation outputs (the accumulated stock of patents per capita) are good predictors of the level of development. We use Park’s (2001) index of
intellectual property rights as an instrument for patents per capita. The use of this variable as an instrument of innovation was suggested by Barro (1999). In addition, we include the explanatory variables suggested by all of the aforementioned authors. Finally, the results discussed below include a series of specification tests to assess the adequacy of the instrumental variables. The summary statistics of all the variables used in the econometric experiments are reported in the Annex.
B. Methodology and specification tests
We use instrumental variables to capture the supposedly exogenous components of various potential determinants of the level of GDP per capita across countries. The models to be estimated contain two endogenous explanatory variables: the index of rule of law in the year 2000 provided by Kaufmann and Kraay (2002) and our indicator of the stock of patents per capita in the same year the sum of all patents received from both the U.S. PTO and the EPO. To identify the exogenous component of rule of law we try two alternative instruments: Acemoglu et al.’s (2001) settlers’ mortality rates and the alternative used by Rodrik et al. (2002), which is the portion of the population that speaks European languages. As mentioned, we use the (log of the) average of Park’s (2001) index of IPR protection during 1960-1995 to capture the
exogenous portion of the accumulated stock of patents per capita since the 1960s. The variable to be explained is the (log of the) PPP-adjusted GDP per capita in 2000.
The estimation strategy is to first estimate the standard Acemoglu et al. (2001) regression, where the key explanatory variable is rule of law. The basic specification also includes Sach’s index of the incidence of malaria, plus a set of standard geographic and trade- structure control variables. We then re-estimate the model with the same sample of countries but with the stock of accumulated patents per capita. The final specification includes both the rule of law and the innovation variable. This three-step procedure is applied twice, one with settlers’ mortality rate as the instrument for rule of law and another with the fraction of the population that speaks European languages as the instrument for rule of law. The advantage of the second specification is that it has a broader country and regional coverage.
To assess the validity of the instruments, the exercises include a set of specification tests. First, the Hausman test compares the OLS coefficients to the IV coefficients. If the null
hypothesis of similar coefficients cannot be rejected, then it is questionable that the rules of law and/or patents per capita variables are endogenous. Second, we present results from an auxiliary regression concerning the direct impact of the portions of rule of law and patents that are not explained by the instruments on GDP per capita. This is an alternative test of the endogeneity of these explanatory variables. If these residuals are not significant, then it is possible that rule of law and patents are not endogenous, and thus the OLS regression results are informative. Third, we present the coefficient of the partial effect of the chosen instruments on the supposedly endogenous variables (e.g., rule of law and patents). The instruments are adequate if they are significant determinants of the endogenous explanatory variables. Fourth, the analysis includes an estimate of the partial correlation between the chosen instruments and the dependent variable.
20 If there is a significant correlation, then the instruments themselves are either endogenous or should be included as direct determinants of GDP per capita. Fifth, the final specification test is due to Shea (1997). This statistic is the “partial R-squared,” which is an indication of how much of the variance of the endogenous variables (rule of law and patents) are explained by the chosen instruments. “High” partial R-squares are an indication that the chosen instruments are relevant in the sense that they do explain a significant portion of the variance of the endogenous variables after controlling for the correlation between the instruments and between the instruments and the two endogenous variables. This is important to consider, as explained by Dollar and Kraay (2003), because if there are high correlations among the instruments and between them and the two endogenous variables, it is possible that the remaining variance of the endogenous variables explained by instruments might be too small to really be helpful in identifying a major portion of the endogenous variables. The results of these exercises and the corresponding specification tests are presented in Table 6.
C. Results
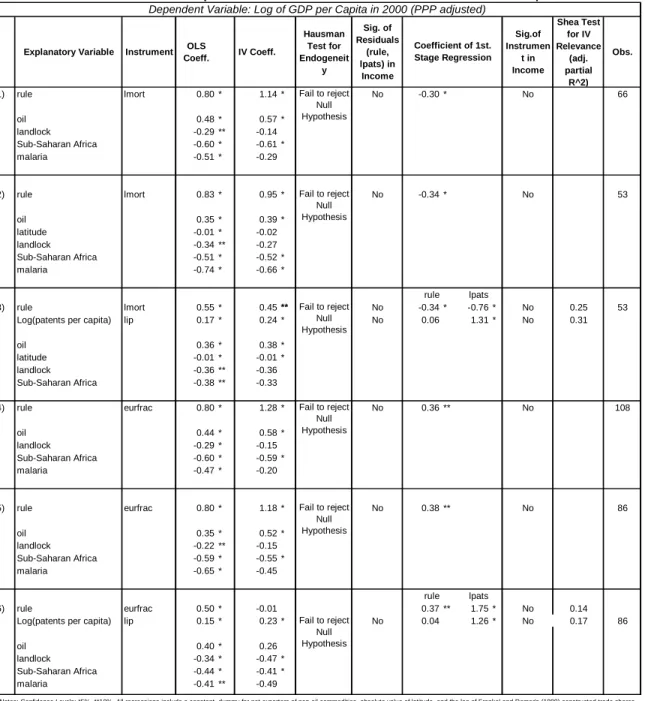
The first column of the Table lists the explanatory variables that were statistically significant. Some variables that were not significant in any specification are not listed. The second column lists the instrumental variables used in each of the six regressions. The rest of the columns contain the estimated coefficients for each explanatory variable and the specification tests discussed above.
Explanatory Variable Instrument OLS Coeff. IV Coeff. Hausman Test for Endogeneit y Sig. of Residuals (rule, lpats) in Income Sig.of Instrumen t in Income Shea Test for IV Relevance (adj. partial R^2) Obs. 1) rule lmort 0.80 * 1.14 * No -0.30 * No 66 oil 0.48 * 0.57 * landlock -0.29 ** -0.14 Sub-Saharan Africa -0.60 * -0.61 * malaria -0.51 * -0.29 2) rule lmort 0.83 * 0.95 * No -0.34 * No 53 oil 0.35 * 0.39 * latitude -0.01 * -0.02 landlock -0.34 ** -0.27 Sub-Saharan Africa -0.51 * -0.52 * malaria -0.74 * -0.66 * rule lpats 3) rule lmort 0.55 * 0.45 ** No -0.34 * -0.76 * No 0.25 53
Log(patents per capita) lip 0.17 * 0.24 * No 0.06 1.31 * No 0.31
oil 0.36 * 0.38 * latitude -0.01 * -0.01 * landlock -0.36 ** -0.36 Sub-Saharan Africa -0.38 ** -0.33 4) rule eurfrac 0.80 * 1.28 * No 0.36 ** No 108 oil 0.44 * 0.58 * landlock -0.29 * -0.15 Sub-Saharan Africa -0.60 * -0.59 * malaria -0.47 * -0.20 5) rule eurfrac 0.80 * 1.18 * No 0.38 ** No 86 oil 0.35 * 0.52 * landlock -0.22 ** -0.15 Sub-Saharan Africa -0.59 * -0.55 * malaria -0.65 * -0.45 rule lpats 6) rule eurfrac 0.50 * -0.01 0.37 ** 1.75 * No 0.14
Log(patents per capita) lip 0.15 * 0.23 * No 0.04 1.26 * No 0.17 86
oil 0.40 * 0.26 landlock -0.34 * -0.47 * Sub-Saharan Africa -0.44 * -0.41 * malaria -0.41 ** -0.49 Fail to reject Null Hypothesis
Notes: Confidence Levels: *5%, **10%. All regressions include a constant, dummy for net exporters of non-oil commodities, absolute value of latitude, and the log of Frankel and Romer's (1999) constructed trade shares.
Fail to reject Null Hypothesis Fail to reject Null Hypothesis Fail to reject Null Hypothesis Fail to reject Null Hypothesis
Table 6. Results: The Impact of Rule of Law and Innovation on the Level of Development
Dependent Variable: Log of GDP per Capita in 2000 (PPP adjusted)
Coefficient of 1st. Stage Regression
Fail to reject Null Hypothesis
The results reported in the first two rows show that the results reported in most studies that followed Acemoglu et al. (2001) are reproduced with our data and sample. The impact of rule of law on income per capita is positive and significant in both OLS and IV estimates. Also, the IV coefficient is larger than the OLS coefficient, which might indicate that the OLS estimates suffer from attenuation bias possibly due to measurement error in the rule of law indicator. Furthermore, the Hausmann specification tests suggest that the whole set of estimated
22 coefficients from the OLS and IV estimates are not statistically different. Hence it is not
absolutely clear that the OLS estimates suffer from severe endogeneity problems. This is also suggested by the fact that the residuals of rule of law are not significant in the auxiliary regression that includes this portion of the institutional indicator. When the patents per capita variable is included (row 3), the results change a bit with respect to the second regression, which is based on the same sample of countries. Of particular relevance is the finding that in both OLS and IV estimates, the magnitude of the rule of law coefficient is significantly below those previously obtained from the models that ignored the role of innovation.
If readers do not trust the OLS estimates, even though the endogeneity tests cannot reject the possibility that the explanatory variables are exogenous, the subsequent specification tests associated with the validity of the instruments are satisfactory. The settlers’ mortality rates are good predictors of rule of law; the log of the IPR index is a good predictor of patents per capita. Also, the instruments themselves do not seem to be correlated with GDP per capita. Furthermore, Shea’s partial R-squares are quite high. The unexplained (by the other exogenous variables) portion of settlers’ mortality rate seems to explain about 25% of the variance of the unexplained portion of rule of law. Similarly, the unexplained portion of the log of the IPR protection index explains about 30% of the unexplained part of the log of patents per capita. Thus the instruments seem quite relevant in terms of having strong partial effects on the endogenous variables.
To check for robustness of these results, the regressions reported in rows 4-6 were derived from a different sample and a different instrumental variable for rule of law, namely the fraction of the population that speaks a European language. The results in rows 4 and 5 show the same result concerning rule of law when patents are not included. That is, the estimated impact of rule of law on the level of development is larger in the IV models than in OLS. Similar to the
previously discussed specifications, we cannot reject the possibility that the explanatory
variables are exogenous, which is suggested by the Hausman test and the lack of significance of the residuals of rule of law (and patents per capita in regression 6) as direct regressors of income. In the OLS regression, the magnitude of the rule of law coefficient maintains its significance when patents are included, but, again, its magnitude is curtailed. However, when patents per capita are included – row 6 – rule of law is not significant in the IV regression.
Since we have two competing explanatory variables – rule of law and log patents per capita – it is worthwhile to assess the economic magnitude of the estimated effects of each of these on the level of development. To accomplish this, the coefficients reported in regression 3 and 6 can be used to simulate the impact of a one standard deviation increase in each variable.5 The standard deviation (reported in the Annex) of rule of law is 0.92, whereas the standard deviation of log patents per capita is 3.14. Multiplication of these values with the corresponding OLS and IV coefficients indicate that in all specifications the magnitude of the effect of
innovation on the level of development is either slightly higher than that of rule of law or much higher. The OLS estimates of model 3 imply that a standard deviation improvement in rule of law is associated with a 0.51% increase in income per capita. The same improvement in innovation is associated with a slightly higher 0.53% increase in the level of development. The corresponding IV estimates imply a much larger difference: 0.41% increase from rule of law versus 0.75% increase in GDP per capita as a consequence of a one standard deviation
improvement in innovation. Very similar estimates of the magnitude of these effects are obtained from the coefficients from model 6, except that in this case rule of law would have no impact on development if we consider the IV estimates. In sum, innovation seems to be positively and
5 Due to the fact that these two variables are measured in different units, it is not economically meaningful to assess
24 significantly correlated with the level of development, and its impact seems to be either similar or much larger in economic magnitude than that of institutions. Thus innovation should be considered a fundamental determinant of long-run development, which is at least as important as one of the most popular explanatory variables.
V. Summary of Findings and Other Uses of the Data
This paper presented a revised and expanded data set on innovation indicators around the world. The data indicates that patenting activity and R&D effort are highly correlated. Also, rich countries seem to have much higher levels of patents and R&D than developing economies. However, there is a select group of countries that experienced dramatic improvements in both patenting activity and R&D effort over time. Latin American and Caribbean countries are not in that group. Transition economies seem to have reduced their historically levels of innovative activity during their economic transformation. Also, not all Asian economies are innovation superstars. Yet there are various relatively poor countries that invest a lot in R&D, such as China and India. Finally, many countries that underwent innovation take-offs seem to have relied on an increasing share of R&D financed and/or performed by the productive sector, but India seems to be an important exception. In contrast, the countries from Eastern and Central Europe (ECA) that experienced severe reductions in total R&D effort also seemed to have been driven down by dramatic reductions in the share of R&D financed or performed by the productive sector.
The econometric analysis reported in this paper suggests that innovation capital is positively correlated with the level of development. In fact, it is likely that the impact of innovation on long-term development is at least as important as that of rule of law, which has attracted a lot of academic attention in the literature.
Our hope is that these data can be fruitfully used to further our understanding of how national economies innovate and learn, including how the structure of financing of R&D evolves over the course of development, and how innovation affects development outcomes. For
example, by utilizing this database, Lederman and Maloney (2003) found that the social rates of return to R&D can be significantly higher in developing countries than in industrialized
economies. But econometric analysis indicates that developing countries fail to raise their R&D effort due to financial underdevelopment, poor IPR protection, and other factors. Bosch et al. (2005) extended a literature on the link between R&D and patents that had previously been circumscribed to firm-level panel data (e.g., Hausman et al. 1984) that cannot assess the social returns of R&D at the national level, and utilized our database to estimate the impact of national R&D investment on patenting activity and investigated the determinants of the low patent elasticities with respect to R&D in various regions of the world. Surprisingly, there seem to be constant returns to scale in developed countries but slightly lower returns in developing countries. Furthermore, these authors found that factors such as the collaboration that exists between universities and the private sector, as well as the quality of the research institutions have a positive impact on patenting elasticities.6 The data has also been used to conduct simulations of R&D-driven growth models with externalities (Klenow and Rodriguez-Clare 2004).
Nevertheless, these modest contributions are admittedly the tip of iceberg of the research
question on development and innovation that we can investigate with internationally comparable and consistent data from around the world. What is clear from the theoretical literature and from the empirical evidence, including the econometric evidence discussed herein, is that innovation should be placed at the top of the research agenda.
6 The data on the quality of research institutions and links between the private sector and universities used by Bosch
26 ANNEX. Definitions and Sources of Data
1.Definitions Patents
USPTO: Property right granted by the Government of the United States of America to an inventor “to exclude others from making, using, offering for sale, or selling the invention
throughout the United States or importing the invention into the United States” for a limited time in exchange for public disclosure of the invention when the patent is granted.
EPO: Legal title granting its holder the exclusive right to make use of an invention for a limited
area and time by stopping others from, amongst other things, making, using or selling it without authorization. A European patent can be obtained by filing a single application in one of the official languages of the European Patent Office (English, French or German) in a unitary procedure before the EPO and is valid in as many of the contracting states as the applicant cares to designate. A European patent affords the same rights in the designated contracting states as a national patent granted in any of theses states.
The following definitions were obtained from UNESCO’s Statistical Yearbooks: Research and experimental development (R&D)
In general R&D is defined as any creative systematic activity undertaken in order to increase the stock of knowledge, including knowledge of man, culture, and society, and the use of this knowledge to devise new applications. It includes fundamental research, applied research, and experimental development.
Fundamental Research: Any activity directed towards the increase of scientific knowledge or discovery of new fields of investigation, without any specific practical objective.
Applied research: Any activity directed towards the increase of scientific knowledge but with a specific practical aim in view.
Experimental development: Systematic use of the results of fundamental and applied research and of empirical knowledge directed towards the introduction of new materials, products,
devices, processes and methods, or the improvement of existing ones, including the development of prototypes and pilot plants.
R&D Investment
The measurement of R&D investment is calculated on the basis of intramural current
expenditure, including overheads, and intramural capital expenditure. The sum of the intramural expenditures incurred by the national institutions provides the total domestic expenditure which is the information presented at the international level. Total domestic expenditure on R&D activities refers to all expenditure made for this purpose in the course of a reference year in institutions and installations established in the national territory as well as installations physically situated abroad. The total expenditure for R&D as defined above comprises current expenditure, including overheads, and capital expenditure.
*RICYT divides Science and Technology expenditure in two categories: Scientific and
Technological Activities (Actividades Científicas y Tecnológicas) and Experimental Research and Development (Investigación y Desarrollo Experimental). The first category includes experimental research and development, scientific and technical teaching and training, and scientific and technical services. The second category includes: basic research, applied research, and experimental development.
28 Sectors of performance and source of funds
The sectors of performance identify those areas of the economy in which R&D work is
performed. There are three sectors of performance in our database: the productive sector, higher education, and the public sector . Also, the following sources of finance for domestic
expenditure on R&D activities permit the identification of the financial supporters of such activities: the productive sector and foreign funds. The definitions for these sectors are the following:
The productive sector includes both domestic and foreign-owned industrial and trading
establishments located in the country, which produce and distribute goods and services for sale, and organizations directly serving them, whatever their form of ownership, private, non-profit, or government. It also includes government monopolies and nationalized industries, particularly public utilities, transport undertakings, post offices, communications and broadcasting, and all other government establishments which function as productive units. Also included are
governmental or non-governmental organizations and private non-profit institutions mainly or exclusively serving industrial or trading establishments, except those institutes, experimental stations, etc., operating under the direct control of, or being associated with institutions of higher education. In former socialist countries, R&D institutes of branch ministries were classified in this sector.
The higher education sector relates to establishments of education at the third level and also includes those research institutes, experimental stations, etc, serving them.
The public sector, or general service sector, includes various public or government establishments serving the community as a whole.
*The OECD and RICYT basically provide the same definitions for sectors that finance and perform R&D. The OECD refers to the productive sector as “Business Enterprise Sector”, which covers private and public enterprises.
R&D Personnel
The data on R&D personnel corresponds to scientists and engineers, comprising persons working in those capacities, i.e. as persons with scientific or technological training (usually completion of third level education) in any field of science, who are engaged in professional work on R&D activities, administrators and other high-level personnel who direct the execution of R&D activities.
*RICYT divides R&D personnel in the following categories: Researchers (professionals who create new knowledge, methods and systems, and administer them), Graduate Students, and Support Personnel (technicians and other support personnel).
2. Database on Innovation: Variables and Sources
Variable Definition Units Source
R&D Variables
Pat Total patents
granted by the USPTO by year for each country
Unit U.S. Patent & Trademark Office
Patepo Total patents
granted by the EPO by year for each country
Unit European Patent Office
Royal Royalties and
license fees, payments
Current U.S. dollars -World Development Indicators through
World Bank electronic databases Rdexp R&D
expenditure
Constant U.S. dollars -UNESCO:printed and electronic
versions of Statistical Yearbook.
30
Rdper R&D personnel Number of researchers
(scientists and engineers)
(including electronic versions available through the World Bank electronic databases)
-OECD: Science and Technology Indicators in electronic and printed format
-RICYT7
- Taiwan (China) Statistical Data book Rdfinprod R&D
expenditure financed by the productive sector
Percentage of total R&D expenditure
-UNESCO Statistical Yearbooks (electronic and printed formats)
-OECD Main Science and Technology indicators (electronic and printed formats)
-RICYT
-Taiwan (China) Statistical Data book -Database developed by Furman et al. Rdfinabro R&D
expenditure financed with funds from abroad
Percentage of total R&D expenditure
-UNESCO Statistical Yearbooks (electronic and printed formats)
-OECD Main Science and Technology indicators
-RICYT
- Taiwan (China) Statistical Data book Rdperfprod R&D
expenditure performed by the productive sector
Percentage of total R&D expenditure
-UNESCO Statistical Yearbooks
-OECD Main Science and Technology indicators
-RICYT
-Taiwan (China) Statistical Data book Rdperfhe R&D
expenditure performed by higher education
Percentage of total R&D expenditure
-UNESCO Statistical Yearbooks
-OECD Main Science and Technology indicators
-RICYT
-Taiwan (China) Statistical Data book - Database developed by Furman et al. Rdperfpub R&D
performed by the public sector
Percentage of total R&D performed by the public sector
-UNESCO Statistical Yearbooks
-OECD Main Science and Technology indicators
-RICYT
stockpat, stockpatEPO Stock of patents
granted by the USPTO and EPO
Sum of patents from the first year that the patenting office granted a patent to time “t”
Author’s calculations
Variable Obs Mean Std. Dev. Min Max lypc 121 8.05 1.17 5.25 10.03 rule 162 -0.04 0.92 -2.17 1.91 lpats_pop 127 -11.79 3.14 -17.98 -4.66 lmort 76 4.70 1.22 2.15 7.99 lip 116 0.83 0.62 -2.30 1.46 eurfrac 172 0.20 0.36 0 1.00 oilprueba2 183 0.20 0.40 0 1 cen_latabs 173 25.69 17.12 0.42 67.47 landlock 191 0.20 0.40 0 1 ssa 201 0.25 0.43 0 1 lcts 150 2.92 0.75 0.83 4.44 malfal94 149 0.29 0.41 0 1 Description lypc rule lpats_pop lmort lip eurfrac oilprueba2 cen_latabs landlock ssa lcts malfal94
Rule of Law index. Source: Kaufmann, Kraay, and Zoido-Lobatón (2002)
Log (patents granted in the U.S. and Europe/ total population). Sources: USPTO, EPO, and World Bank. Log (settler mortality). Source: Acemoglu, Johnson, and Robinson (2001)
Log (Income per capita in 2000, 1985 U.S.$ PPP) Source: Calderón, Fajnzylber, and Loayza (2005)
Absolute value for country centroid latitude.
Log (average IP index 1960-1995). Source: Park and Ginarte (2001)
Fraction of population speaking one of the major languages of Western Europe: English, French, German, Portuguese, or Spanish. Source: Hall and Jones(1999).
Dummy variable taking value of 1 if country is net exporter of oil. Dummy variable taking value of 1 lacks of access to the sea. Log (Constructed Trade Share). Source: Frankel and Romer (1999). Malaria Index, year 1994. Source: Gallup and Sachs (1998).
32 REFERENCES
Acemoglu, Daron, Simon Johnson, and James A. Robinson. 2001. “The Colonial Origins of Comparative Development: An Empirical Investigation.” American Economic Review 91(5): 1369-1401.
Acemoglu, Daron, and Fabrizio Zilbotti. 2001. “Productivity Differences.” Quarterly Journal of Economics 116(2): 563-606.
Aghion, Philippe, and Peter Howitt. 1998. Endogenous Growth Theory. Cambridge, Massachusetts: The MIT Press.
Barro, Robert. 1991. “Economic Growth in a Cross Section of Countries.” Quarterly Journal of Economics 106(1): 407-443.
Bosch, Mariano, Daniel Lederman, and William F. Maloney. 2005. “Patenting and Research and Development: A Global View.” World Bank Policy Research Working Paper 3739, Washington, DC.
Calderón, César, Pablo Fajnzylber, and Norman Loayza. 2005. Economic Growth in Latin America and the Caribbean: Stylized Facts, Explanations, and Forecasts. Wasghington, D.C.: The World Bank.
Casseli, Francesco, Gerardo Esquivel, and Fernando Lefort. 1996. “Reopening the Convergente Debate: A New Look at Cross-Country Growth Empirics.” Journal of Economic Growth 1(3): 363-90.
Dollar, David, and Aart Kraay. 2003. “Institutions, Trade, and Growth.” Journal of Monetary Economics 50(1): 133-62.
Easterly, William, and Ross Levine. 2003. “Tropics, Germs, and Crops: How Endowments Influence Economic Development.” Journal of Monetary Economics 50:3-39.
Easterly, William, and Ross Levine. 2001. “It’s Not Factor Accumulation: Stylized Facts and Growth Models.” The World Bank Economic Review 15(2): 177-220.
Frankel, Jeffrey, and David Romer. 1999. “Does Trade Cause Growth?” American Economic Review 89(3): 379-99.
Griliches, Zvi. 1990. “Patent Statistics as Economic Indicators: A Survey.” Journal of Economic Literature 28(4): 1661-1707.
Hall, Robert, and Chad I. Jones. 1999. “Why Do Some Countries Produce so Much More Output per Worker than Others?” Quarterly Journal of Economics 114(1):83-116.
Hausman, Jerry, Bronwyn H. Hall, and Zvi Griliches. 1984. “Econometric Models for Count Data with an Application to the Patents-R&D Relationship.” Econometrica 52(4): 909-938. Jaffe, Adam B., and Manuel Trajtenberg. 2002. Patents, Citations & Innovations A Window on the Knowledge Economy. The MIT Press.
Klenow, Peter, and Andres Rodriguez-Clare. 1997. “Economic Growth: A Review Essay.” Journal of Monetary Economics 40:597-617.
Klenow, Peter, and Andres Rodriguez-Clare. 2004. “Externalities and Growth.” NBER Working Paper 11009, Cambridge, Massachusetts. Forthcoming in Handbook of Economic Growth. Lederman, Daniel, and William F. Maloney. 2003. “Research and Development (R&D) and Development.” World Bank Policy Research Working Paper 3024, Washington, DC.
Maskus, Keith E. 2000. Intellectual Property Rights in the Global Economy. Washington, DC: Institute for International Economics.
Park, Walter G. 2001. “Intellectual Property and Patent Regimes”. In Economic Freedom of the World 2001 Annual Report: The Fraser Institute.
Rodrik, Dani. 2003. “Growth Strategies.” NBER Working Paper 10050, Cambridge, Massachusetts. Forthcoming in Handbook of Economic Growth.
Rodrik, Dani, Arvind Subramanian, and Francesco Trebbi. 2002. “Institutions Rule: The Primacy of Institutions Over Geography and Integration in Economic Development.” Mimeographed. Harvard University, Cambridge, Massachusetts.
Romer, Paul. 1990. "Endogenous Technological Change." Journal of Political Economy 98(5): 71-102
Solow, Robert. 2001. “Applying Growth Theory across Countries.” The World Bank Economic Review 15(2): 283-88.
Solow, Robert. 1956. "A Contribution to the Theory of Economic Growth." Quarterly Journal of Economics 50: 65-94.
Statistical Sources European Patent Office
Global Competitiveness Report 1996-2000, 2001-2002.
34 OECD, “Science and Technology Indicators, Basic Statistical Series, Selected Science and Technology indicators 1979-1983”, Paris:1984
OECD, “Science and Technology Indicators, Basic Statistical Series, Volume D, Research and Development in the Business Enterprise Sector 1963-1979”, Paris:1983
RICYT 2001 El Estado de la Ciencia. Principales Indicadores de Ciencia y Tecnología Iberoamericanos
Taiwan (China) Statistical Data Book, Council for Economic Planning and Development, Executive Yuan, Republic of China, Editions 1992 and 2002.
U.S. Patent & Trademark Office
UNESCO Statistical Yearbooks (electronic and printed formats) years: 1969, 1970,1972, 1973,1977, 1980, 1982, 1983, 1986, 1987,1988,1990,1992, 1995, 1998, and 1999