Data Extraction from MRI Image Using Modified K
Means and Cellular Automata Algorithms
Sruthi K
*
Department of Computer Science. KMCT College of Engineering,Calicut, Kerala
Abstract- In this paper, I present a fast and robust practical tool for segmentation of solid tumors with minimal user interaction to assist clinicians and researchers in radio surgery planning and assessment of the response to the therapy. K Means based seeded tumor segmentation method on contrast enhanced T1 weighted magnetic resonance (MR) images, which standardizes the volume of interest (VOI) and seed selection, is proposed. And the result is compared against Cellular automata based tumor segmentation method. Seed points are selected as the intersection of maximum white points row wise and column wise . First the seed pixels of tumor and background are fed to the algorithm. Using this seeds, the algorithm finds the strength maps for both tumor and background image .This maps are then combined to get the tumor probability map. Comparison studies on both clinical and synthetic brain tumor datasets for both this methods demonstrate 80%–90% overlap performance of the proposed algorithm( K Means)in terms of, its efficiency and accuracy.
General Terms
Image processing ,Segmentation
Index Terms- Brain tumor, Segmentation, Medical image ,Cellular Automata, Modified K Means.
I. INTRODUCTION
MAGING plays a central role in the diagnosis of brain tumors. Early imaging methods—invasive and sometimes dangerous— such as pneumoeno cephalography and cerebral angiography, have been abandoned in recent times in favor of non-invasive, high-resolution techniques, such as computed chorography (CT)-scans and especially magnetic resonance imaging (MRI). Neoplasms will often show as differently colored masses (also referred to as processes) in CT or MRI results .Segmentation of brain tissues in gray matter , white matter ,and tumor on medical images is not only of high interest in serial treatment monitoring of― disease burden in oncologic imaging, but also gaining popularity with the advance of image guided surgical approaches .Outlining the brain tumor contour is a major step in planning spatially localized radiotherapy(e.g.,Cyberknife,iMRT) which is usually done manually on contrast enhancedT1-weighted magnetic resonance images(MRI) in current clinical practice .On T1 MR images acquired after administration of a contrast agent (gadolinium), blood vessel sand parts of the tumor ,where the contrast can pass the blood–brain barrier are observed as hyper intense areas. There are various attempts for brain tumor segmentation in the literature which use a single modality,
combine multi modalities and use priors obtained from population atlases.
Modalities which give relevant information on tumor and edema/infiltration such as Perfusion Imaging ,Diffusion Imaging, or Spectroscopic Imaging provide lower resolution images compared toT1orT2 weighted sequences ,and the former are generally not preferable for geometric measurements .One of the main reasons to use multimodality images such as T2 weighted MRI is to segmented ema /infiltration region which is generally not observable in T1 images. Although the tumors infiltrate beyond the enhanced margin and edema/infiltration region might be of interest to fractionated radio therapy in general ,it is not possible to distinguish edema and infiltration, so usually this region is not included in primary target planning of radio surgery ,particularly in Cyber knife.
On the other hand, population atlases provide an important Prior to improve segmentation by measuring the deviation from the normal brain. Deformable registration of brain images with tumor to the population atlas is an extremely challenging problem and still an active research are a due to intensity variations around the tumor mainly caused by edema/infiltration, and the tumor mass effect ,which also deforms the healthy tissue morphology. In some studies, affine registration has been used for this purpose ,however misalignment issues arise, especially where there is a large deformation of the brain structures .Comparison to the works in the literature that use different Approaches and other image types is difficult as that would require the use of the same data sets by different groups with evaluation performed by similar measures. For this reason, only the results of some studies are given ,instead of a detailed comparison .Although, using manual expert segmentations as the ground truth, different performance measure such as Dice Overlap ,JaccardIndex ,false positive and negative volume fractions(FPVF,FNVF) we reused in the literature, (Dice) Over lap issued as a common measure for a comparison to previous methods here With their automatic, multimodal, atlas based method, Prastawaetal. have reported 86.7%average overlap on a small dataset of only three patients with an average1.5 h processing time.
www.ijsrp.org sources to obtain a better segmentation. However, attempts to
develop better algorithms from the image processing perspective that work on a particular MRI protocol continue in parallel not only to obtain proper information from each channel to be combined, but also due to the practical need to routinely quantify tumors in a clinical environment . Therefore, in this study, we focused on an efficient and robust segmentation of brain tumors on contrast enhanced T1 weighted MRimages with minimal user interaction.
Region-based active contour models are widely used in image segmentation. In general, these region-based models have sever advantages over gradient-based techniques for segmentation, including greater robustness to noise. However, classical active contours had the problem of being― only as good as their initialization, ‖even when using level-set surfaces in 3D. Because the tumor class does not have a strong spatial prior, many small structures, mainly blood vessels, are classified as tumor as they also enhance with contrast. Hoetal .used fuzzy classification of pre-and post-contrast T1 images to obtain a tumor probability map to evolve a level-set surface. Liuetal.
Have adapted the fuzzy connectedness framework for tumor segmentation by constructing a rectangular volume of interest selected through identifying the first and last slice of the tumor and specifying a set of voxels in the tumor region.
Interactive algorithms have become popular for image segmentation problem in recent years. Graph basedseededsegmentationframeworkhasbeengeneralizedsuchthat graph-cuts (GC), random walker(RW), shortest paths, and power water sheds have been interpreted as special cases of a general seeded segmentation algorithm, which solves a minimization problem involving a graph’s edge weights constrained by adjacent vertex variables or probabilities .In, the connection between GC, RW, and shortest paths was shown to depend on different norms: (GC); (RW); (shortest paths) ,in th energy that is optimized. Geodesic distances between foreground and background seeds were also in corporate in to other shortest path-based segmentation algorithms .
Although i t was reported that the shortest paths and RW produce relatively more seed-dependent results, it can be argued that the global minimum of an image segmentation energy is worth as good as the ability of its energy to capture underlying statistics of images, and a local minimum may produce a solution closer to the ground truth than that of a global minimum. Hence, with good prior information provided as in the case of a seeded image segmentation problem, efficiently finding good local minima becomes meaningful and worthwhile. On the other hand, cellular automata(CA) algorithm motivated biologically from bacteria growth and competition, is based on a discrete dynamic system defined on a lattice ,and iteratively propagates the system states via local transition rules. It was first used by Vezhnevetsetal. (Grow-cut)for image segmentation, this showed the potential of the CA algorithm on generic medical image problems. However, Grow-cut was not designed for specific structures, such as tumors, which display heterogeneous content such as necrotic and enhancing tissue. Moreover, anatomic structures typically have relatively smooth boundaries, however, Grow-cut tends to produce irregular and jagged surface results, and only an ad hoc way of smoothing was introduced.
K-Means algorithm was introduced by name in 1967 . It is safe to assume that the algorithms existed previously without formalization or a complete explanation of the theory involved. K-Means can be thought of as an algorithm relying on hard assignment of information to a given set of partitions. At every pass of the algorithm, each data value is assigned to the nearest partition based upon some similarity parameter such as Euclidean distance of intensity. The partitions are then recalculated based on these hard assignments. With each successive pass, a data value can switch partitions, thus altering the values of the partitions at every pass. K-Means algorithms typically converge to a solution very quickly as opposed to other clustering algorithms.
In this paper, were-examine the CA algorithm to establish the connection of the CA-based segmentation to the graph-the-oretic methods to show that the iterative CA framework solves the shortest path problem with a proper choice of the transition rule. Next, as our application is in the clinical radio surgery planning, where manual segmentation of tumors are carried out on contrast enhanced T1-MR images by a radio-oncology expert, we modify the CA segmentation towards the nature of the tumor properties undergoing radiation therapy by adapting relevant transition rules. A smoothness constraint using level set active surfaces is imposed over a probability map constructed from resulting CA states. Then we examine the K means method for brain tumor segmentation .Finally we compare the results. Following a brief background on seeded segmentation methods in Section2, we present our frameworks for brain tumor segmentation in Section 3, and compare their performance via validation studies on both synthetic, and radiation therapy planning expert-segmented data sets in Section 4,followed by conclusions in Section5.
II. BACKGROUND
A . Seeded image segmentation
Given a undirected graph with
vertices and edges .In image segmentation problems , vertices are corresponding to image pixels,while edge weights are similarity measures between neighboring pixels based on image features(e.g. Intensities).Each vertex has an attribute, which is an indicator of the probability of a label(e.g.,a foreground and a background label).With the foreground F and background B seeds supplied by the user, the labeling problem is solved by
In the final solution, the vertices which have the value are labeled as foreground and are labeled as back-ground .We will Show that this optimization problem for can be solved by a CA- based algorithm.
A cellular automata is basically a computer algorithm that is discrete in space and time and operates on a lattice of cells Since it was first proposed by Von Neumann and Ulam, Cellular Automata has attracted researchers from various fields in both physical and social sciences because of its simplicity, and potential in modeling complex systems .Each individual cell is in a specific state and changes synchronously depending on the states of some neighbors as determined by a local update rule . They are parallel, local and homogeneous, since the state of any cell depends only on the states of the local neighbors at the previous time step and the update rules are same for every cell. Formally, a cellular automaton (CA) is a triple , where is a nonempty set, called the state set, is the neighborhood, and is the local transition function (rule); , which is the argument of , indicates the states of the neighborhood cells at a given time, while , which is its value, is the state of the central cell at the next time step .
Although the usual definition for ―Cellular Automata‖ is in favor of a finite state set (discrete and bounded), continuous state sets in which the states are real numbers are also used in CA literature under the name ―Continuous CA‖ or ―Coupled Map Lattices‖ . A detailed discussion and some of the issues that can arise while using a continuous state set on a finite machine are given
There are various attempts of using CA in image processing problems including: image enhancement (sharpening and smoothing) , image filtering, edge detection , and image segmentation (Grow-cut)
Grow-cut method uses a continuous state cellular automata to interactively label images using user supplied seeds. The cells are corresponding to image pixels, and the feature vector is RGB or gray scale intensities. The state set for each image pixel consists of a ―strength‖ value in a continuous interval , a label and an image feature vector . The automata is initialized by assigning corresponding labels at seeds with a strength value between 0 and 1 where a higher value reflects a higher confidence in choosing the seed. Strengths for unlabeled cells are set to 0. A pseudo code for the Grow-cut algorithm is given below :
where the argument is for instance, the absolute difference between the intensities of two neighboring pixels. The surprising success of this simple algorithm, especially on medical images, motivated us to further analyze the algorithm. We showed that the result of the iterations of this algorithm converges to that of the shortest paths algorithm by modifying the similarity function used:
We note that, the original similarity function used in Grow-cut is a first order approximation to the one we utilized. In connecting shortest paths to cellular automata framework, maximizing the product of the edge weight was shown to be equivalent to minimizing the sum of the ’s, i.e., ’s, resulting in the shortest path between a seed node to any non seed node in the graph over the negative logarithm edge weights. These weights can be interpreted similarly to the reciprocal weight defined in S in op and Grady , which was shown to infer a connection between the shortest path algorithm and the general seeded segmentation optimization with norm minimization.
Simultaneously and independently from our work, it has also been shown that the Grow-cut algorithm is equivalent to the Belman–Ford algorithm, which calculates the shortest paths on a weighted graph . However, there, the motivation and emphasis was on fast hardware implementation of the CA algorithms, due both increasing availability of low-cost graphical hardware (GPUs), and CA algorithm’s suitability to run on parallel processors.
Shortest path idea was utilized in other works such as , where the Eikonal equation was solved with two different boundary conditions constructed from foreground and back-ground seeds. Image-dependent speed functions were inserted into the right hand side of the Eikonal equation, whose solutions led to two distance functions: shortest paths of each pixel from the foreground seeds and the background seeds. For each pixel, the smaller distance to the foreground seeds produced the resulting segmentation.
C. Modified K Means in image segmentation
K-means is a popular algorithm for clustering; it partitions data set into k sets. The membership for each data point belongs to its nearest center, depending on the minimum distance. There are several methods to improve the standard K-means algorithm related to several aspects. Standard K-means algorithm consists of four steps: initialization, classification, computational and convergence condition. The two basic versions of K-means clustering are non adaptive version which was introduced by Lloyd and an adaptive version which was introduced by Macqueen . Adaptive k-means clustering is the most frequently used kmeans clustering which was based on Eucledian distance. Adaptive k-means clustering can be considered as a special case of the gradient descent algorithm where only the winning cluster is adjusted at each learning step.
III. RESAECHELABORATIONS
www.ijsrp.org
3.1
Tumor-cut algorithmSteps of the proposed cellular automata based tumor segmentation algorithm is shown in Fig. 1. First, (a) the user draws a line over the largest visible diameter of the tumor; (b) using this line, a VOI is selected with foreground(red)-background(blue) seeds; (c)–(d) tumor CA algorithm is run on the VOI for each two sets of seeds (for the foreground and background) to obtain strength maps for foreground (c) and background (d) at each voxel; (e) two strength maps are combined to obtain the tumor probability map (6); (f) a level set surface is initialized at and the map is used to evolve the surface which converges to the final segmentation map (g). Finally, (i) the necrotic regions of the tumor is segmented using CA based method with the chosen enhanced and necrotic seeds in (h).
In ―Response Evaluation Criteria In Solid Tumors‖ (RE-CIST), which is a widely used procedure to evaluate the treatment response of the solid tumors, tumor progress is classified by measuring the longest in plane tumor diameter in one dimension (axial, coronal, sagittal) . Our seed selection algorithm employs the same idea to follow the familiar clinical routine to which the clinicians are used to: the volume of interest (VOI), the tumor seeds and the background seeds are determined by using the line already drawn by the user to measure the
longest diameter of the solid tumor. Similarly, focusing on tumor segmentation problem, the seed selection
procedure starts with a single line drawn by the user along the longest visible diameter of the tumor. Afterwards, the VOI and the seeds are computed as follows: 1) The line is cropped by 15% from each end and thickened to three pixels wide to obtain tumor seeds; 2) VOI is selected as the bounding box of the sphere having a diameter 35% longer than the line; 3) One-voxel -wide border of this VOI is used as background seeds .
Since the VOI is completely bounded by the background seeds, each path connecting inside and outside the VOI is blocked by a seed. Then, the result of labeling using only the data inside the region is equivalent to using the whole volume whereas the computation time is significantly reduced.
One obvious drawback is that the user draws the line on only a single slice of the tumor volume, hence it is not guaranteed that the depth of the tumor will also coincide with the VOI. For deter-mining the enlargement ratio for the bounding box size, the percentage of the volume enclosed in the sphere to the total tumor volume is calculated for different enlargement ratio values, and the results are plotted in Fig. 2. For our data set, 100% coverage was achieved with 2.00 times enlargement. We used 1.35, which covers 99% of all tumors with five different initializations, which gave a reasonable trade -off between the 3- D inclusion of the whole tumor versus the computation time increase due to enlargement of the volume.
In occasional cases of slightly concave-shaped tumors, the maximum diameter line will not be enclosed by the tumor com-pletely. Even in these cases, the algorithm can perform the seg-mentation successfully if an input 1-D line is correctly drawn to fall inside the tumor region. The line enlargement parameter selected for VOI formation is determined by taking such cases into account, hence, the VOI contains the whole tumor.
3.2
Adapting transition rule to tumor characteristicsIn the tumor segmentation application, the cells or nodes in cellular automata framework correspond to the MRI volume voxels in 3-D. A 26-cell cubic neighborhood is used in 3-D. MRI intensities are used as image features. The automata is initialized with user supplied tumor and background seeds as explained in Section 3-B and iterated by the following rule:
where is a pixel similarity or transition function bounded to , which is equivalent to the edge weight function in the seeded
segmentation framework. A typical symmetric edge weight function depending on the image features, is given by the absolute intensity difference or gradient magnitude between neighboring nodes and
where denotes the MR image intensity at node .
In the seeded tumor segmentation application over contrast enhanced T1-weighted MRI for heterogeneous tumors, which mostly consist of a ring enhancing region around a dark necrotic core (and also irregular borders), most of the foreground seeds fall
3.3
Level set evolution on constructed tumor probabilitymap
Smoothing is an important prior in segmentation of brain tumors from post-contrast T1 images, because of three main reasons: First, an area surrounded by tumor tissue is considered as a tumor region even the intensity characteristics are likely to be healthy. Secondly, it is possible to include misclassified necrotic regions to tumor region, which are usually surrounded by enhanced tissue. Finally, it is possible to exclude nearby vascular structures that are enhanced by administration of the contrast agent. n the necrotic region. This sometimes causes the segmentation algorithm to get stuck at necrotic to enhancing tumor transition borders. To overcome such problems, prior knowledge that tumor voxels are brighter in post-contrast T1-MRI can be utilized. This can be achieved by modifying the transition function by inserting a spatially-varying parameter
The intuition here is based on the observation that the enhancing tumor cells are brighter than the normal tissue, and more centrally located necrotic core is darker. Therefore, by adjusting the parameter, the weight reduction (i.e., the strength loss) of a tumor state while passing through a ramp up gradient is adjusted to be lower than other cases.
Our experimental results revealed that the new tumor CA (tCA) algorithm significantly improved the results obtained, especially on glioblastomas .
Modified K-means algorithm is a new algorithm for Kmeans based on the optimization formulation and a novel Iterative method. The steps of this algorithm represented as below
1) Dividing data set (D) into K parts:
2) Let be initial clustering centers calculate by:
3) Decide membership of the patterns in each one of the K clusters according to the minimum distance from cluster center.
4) Calculate new centers using the iterative formula below: 5) Repeat step 3 and 4 till there in no change in cluster center.
IV. EXPERIMENTALRESULT
The Edges of the CA cluster Will not be having tumor cells normally. But Kmeans gives more accurate result .It includes only the affected cells.
V. CONCLUSION
Here we presented two segmentation algorithm for the problem of tumor delineation which exhibit varying tissue characteristics. These algorithm needs very less user interaction .These can be widely used in clinical practices. Compared to CA algorithm K means algorithm shows less computation time and the result is more accurate. In CA result the the boundaries of tumor cluster will not be having affected cells .But in the K Means the cluster boundaries also contains affected cells
REFERENCES
[1] S. Warfield, K. Zou, and W. Wells, ―Simultaneous truth and perfor-mance level estimation (STAPLE): An algorithm for the validation of image segmentation,‖ IEEE Trans. Med Imag., vol. 23, no. 7, pp. 903–921, Jul. 2004.
[2] M.-R. Nazem-Zadeh, E. Davoodi-Bojd, and H. Soltanian-Zadeh, ―Atlasbased fiber bundle segmentation using principal diffusion directions and spherical harmonic coefficients,‖ NeuroImage, vol. 54, pp. S146–S164, 2011.
[3] K. H. Zou, S. K. Warfield, A. Bharatha, C. M. C. Tempany, M. R. Kaus, S. J. Haker, W. M. Wells, F. A. Jolesz, and R. Kikinis, ―Statistical vali-dation of image segmentation quality based on a spatial overlap index,‖ Acad. Radiol., vol. 11, no. 2, pp. 178–189, 2004.
[4] E. D. Angelini, O. Clatz, E. Mandonnet, E. Konukoglu, L. Capelle, and H. Duffau, ―Glioma dynamics and computational models: A re-view of segmentation, registration, and in silico growth algorithms and their clinical applications,‖ Curr. Med. Imag. Rev., vol. 3, no. 4, pp. 262–276, 2007. [5] M. Prastawa, E. Bullitt, S. Ho, and G. Gerig, ―A brain tumor segmen-tation
framework based on outlier detection,‖ Med. Image Anal., vol. 8, no. 3, pp. 275–283, 2004.
[6] J. Liu, J. K. Udupa, D. Odhner, D. Hackney, and G. Moonis, ―A system for brain tumor volume estimation via MR imaging and fuzzy connect-edness,‖ Comput. Med. Imag. Graph., vol. 29, pp. 21–34, 2005.
[7] T. Biswaset al., ―Stereotactic radiosurgery for glioblastoma: Retro-spectiveanalysis.,‖ Radiation Oncology, vol. 4, no. 11, p. 11, 2009. [8] A. Gooya, G. Biros, and C. Davatzikos, ―Deformable registration of glioma
images using em algorithm and diffusion reaction modeling,‖ IEEE Trans. Med. Imag., vol. 30, no. 2, pp. 375–390, Feb. 2011.
[9] B. Menze, K. V. Leemput, D. Lashkari, M.-A. Weber, N. Ayache, and P. Golland, ―A generative model for brain tumor segmentation in mul-timodal images,‖ Med. Image Comput. Comput. Assist. Intervent., vol. 13, pp. 151– 159, Sep. 2010.
[image:5.612.383.492.51.219.2]
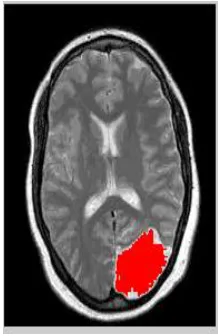
Figure 1 Original Image
Figure 2 CA result
[image:5.612.85.219.346.721.2]www.ijsrp.org [10] T. F. Chan and L. Vese, ―Active contours without edges,‖ IEEE
Trans.Image Process., vol. 10, no. 2, pp. 266–277, Feb. 2001.
[11] S. Ho, E. Bullitt, and G. Gerig, ―Level-set evolution with region com-petition: Automatic 3-D segmentation of brain tumors,‖ in Proc. ICPR, 2002, vol. 1, p. 10532.
[12] Y. Boykov and M.-P. Jolly, ―Interactive graph cuts for optimal boundary and region segmentation of objects in n-d images,‖ in Proc.ICCV, 2001, pp. 105–112.
[13] Segmentation of Brain MRI Using K-means Clustering Algorithm Mrs. P. Vijayalakshmi, Assistant Professor, MCA, Panimalar Engineering College Chennai
[14] Adaptation of K-Means Algorithm for Image Segmentation Ali Salem Bin Samma and Rosalina Abdul Salam
AUTHORS
First Author – Sruthi K, Department of Computer