© 2017, IRJET | Impact Factor value: 5.181 | ISO 9001:2008 Certified Journal | Page 867
Feature Subset Selection for High Dimensional Data Using Clustering
Techniques
Nilam Prakash Sonawale
Student of M.E. Computer Engineering, Bharati Vidyapeeth College of Engineering, Mumbai University, Navi Mumbai , Maharashtra, India.
Prof. B. W. Balkhande
Assistant Professor, Dept. of Computer Engineering, Bharati Vidyapeeth College of Engineering, Mumbai University, Navi Mumbai, Maharashtra, India
---***---Abstract -
Data mining is the process of analyzing the datafrom different perspective and summarizing it into useful information (Information that can be used to increase revenue, cuts costs or both). Database contains large volume of attributes or dimensions which are further classified as low dimension data and high dimension data. When dimensionality increases, data in the irrelevant dimension may produce noise, to deal with this problem it is crucial to have a feature selection mechanism that can find a subset of features that meets requirement and achieves high relevance. The proposed algorithm FAST is evaluated in this project. FAST algorithm has three steps: irrelevant features are removed; Features are divided in to clusters, selecting the most representative feature from cluster [8]. This algorithm can be performed by DBSCAN (Density-Based Spatial Clustering with Noise) algorithm that can be worked in the distributed environment using the Map Reduce and Hadoop. The final result will be a small number of discriminative features selected.
Key Words: Data Mining, Feature subset selection, FAST, DBSCAN, SU, Eps, MinPts
1. INTRODUCTION
Data mining is an interdisciplinary subfield of computer science; it is the computational process of discovering patterns in large data sets involving methods at the intersection of artificial intelligence, machine learning, statistics and database system [4]. The overall goals of the data mining process are too abstract information from a dataset and transform it into an understandable structure for further use. Cluster analysis or clustering is the task of grouping the set of objects in such a way that objects in the same group ( called clusters) are more similar (in some sense or another ) to each other than to those in other groups(Cluster). Clustering is an example of unsupervised learning because there is no predefined class; the quality of cluster can be measure by high intra-cluster similarity and
low inter-cluster similarity [5]. A categorization of major clustering methods.
1.1 Partitioning method:
It classifies the data into k groups, together which satisfy the following requirements: (1) each group must contain at least one object, and (2) each object must belong to exactly one group. Like the algorithms k-means and k-medoids. The cons of it are, most partitioning methods cluster objects based on the distance between objects. Such methods can find only spherical-shaped clusters and encounter difficulty at discovering clusters of arbitrary shapes.
1.2 Hierarchical methods:
Hierarchical decomposition of the given set of data objects has been created by Hierarchical methods. Hierarchical methods suffer from the fact that once a step (merger or split) is done, it can never be undone.
1.3 Density-based methods:
To continue growing the given cluster as long as the density (number of objects / data points) in the “neighborhood” exceeds some threshold; that is, for each data point within a given cluster, the neighborhood of a given radius has to contain at least a minimum number of points [3]. This method can be used to filer out noise (outliers) and to discover clusters of arbitrary shapes.
1.4 Grid-based methods:
© 2017, IRJET | Impact Factor value: 5.181 | ISO 9001:2008 Certified Journal | Page 868 1.5 Model-based methods:
These methods hypothesize a model for each of the clusters and find the best fit of the data to the given model. Clusters may be located by model-based algorithm by constructing a density function that reflects the spatial distribution of the data points.
1.6 Other special method:
(i) Clustering high-dimensional data, (ii) Constrain-based clustering
1.7 DBSCAN:
DBSCAN (Density-Based Spatial Clustering of Applications with Noise) is a density based clustering algorithm which can generate any number of clusters, and also for the distribution of spatial data [1]. The purpose of clustering algorithm is to convert large amount of raw data into separate clusters in order to better and faster access. The algorithm grows regions with sufficiently high density into clusters and discovers clusters of arbitrary shape in spatial databases with noise. It defines a cluster as a maximal set of density-connected points. A density-based cluster is a set of density-connected objects that is maximal with respect to density-reach ability. Every object not contained in any cluster is considered to be noise. This method is sensitive to its parameter e and Min Pts, and leaves the user with the responsibility of selecting parameter values that will lead to the discovery of acceptable clusters. If a spatial index is used, the computational complexity of DBSCAN is O(nlogn), where n is the number of database objects. Otherwise, it is O(n2).
DBSCAN does not need to know the number of classes to be formed in advance. It can not only find freeform class, but also to identify the noise points. Class is defined as a collection contains the maximum number of data objects which density connectivity in DBSCAN algorithm [1]. For all of the unmarked objects in data set D, select object P and marked P as visited. Region query for P to determine whether it is a core object. If P is not a core object, then mark it as noise and re-select another object that is not marked. If P is a core object, then establish class C for the core object P and generals the objects within P as seed objects to region query to
expanding the class C until no new object join class C, clustering process over. That is when the number of objects in the given radius (ε) region not less than the density threshold (MinPts), then clustering. Because of taking the density distribution of data object into account, so it can mining for freeform datasets.
1.8 Clustering High-Dimensional Data:
© 2017, IRJET | Impact Factor value: 5.181 | ISO 9001:2008 Certified Journal | Page 869 attributes that are most relevant to the data mining
task. Attribute subset selection involves searching through various attribute subsets and evaluating these subsets using certain criteria. It is most commonly performed by supervised learning—the most relevant set of attributes are found with respect to the given class labels. It can also be performed by an unsupervised process, such as entropy analysis, which is based on the property that entropy tends to be low for data that contain tight clusters. Other evaluation functions, such as category utility, may also be used. Subspace clustering is an extension to attribute subset selection that has shown its strength at high-dimensional clustering. It is based on the observation that different subspaces may contain different, meaningful clusters. Subspace clustering searches for groups of clusters within different subspaces of the same data set. The problem becomes how to find such subspace clusters effectively and efficiently.
1.9 Constraint-Based Cluster Analysis:
Users often have a clear view of the application requirements, which they would ideally like to use to guide the clustering process and influence the clustering results [7]. Thus, in many applications, it is desirable to have the clustering process take user preferences and constraints into consideration
1.10 Clustering required in Data Mining (Advantages):
(i) Scalability
(ii) Ability to deal with different kinds of attributes
(iii) Discovery of clusters with attribute shape
(iv) High Dimensionality
(v) Ability to deal with noisy data
(vi) Interpretability
2. LITERATURE SURVEY
A feature selection algorithm can be seen as the combination of a search technique for proposing new feature subsets, along with an evaluation measure which scores the different feature subsets. The simplest algorithm is to test each possible subset of features finding the one which minimizes the error rate. This is an exhaustive search of the space, and is computationally intractable for all but the smallest of feature sets. The choice of evaluation metric heavily influences the algorithm, and it is these evaluation metrics which distinguish between the three main categories of feature selection algorithms: wrappers, filters and embedded methods.
2.1 Wrapper methods:
[image:3.595.309.568.458.570.2]Use a predictive model to score feature subsets. Each new subset is used to train a model, which is tested on a hold-out set. Counting the number of mistakes made on that hold-out set (the error rate of the model) gives the score for that subset [3]. As wrapper methods train a new model for each subset, they are very computationally intensive, but usually provide the performing feature set for that particular type of model.
Figure 1:Wrapper Method
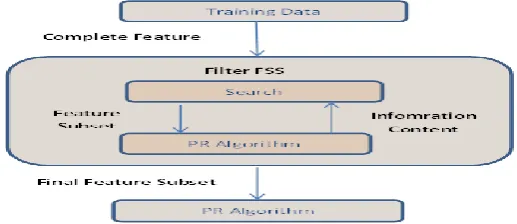
2.2 Filter methods:
© 2017, IRJET | Impact Factor value: 5.181 | ISO 9001:2008 Certified Journal | Page 870 lack of tuning means a feature set from a filter is more
general than the set from a wrapper, usually giving small prediction performance than a wrapper. However the feature set doesn't contain the assumptions of a prediction model, and hence is more useful for exposing the relationships between the features. Many filters provide a feature ranking rather than an explicit best feature subset, and the cutoff point in the ranking is chosen via cross-validation. This method has also been used as a pre-processing step for wrapper methods, allowing a wrapper to be used on big problems.
Figure 2:Filter Method
2.3 Embedded methods:
A catch-all group of techniques which implement feature selection as part of the model construction process. The exemplar of this path is the LASSO method for designing a linear model, which penalizes the regression coefficients with an L1 penalty; compress many of them to zero. Any features which have non-zero regression coefficients are 'selected' by the LASSO algorithm. Improvements to the LASSO include Bolasso which bootstraps samples, and FeaLect which scores all the features based on combinatorial analysis of regression coefficients. One other popular path is the Recursive Feature Elimination algorithm, commonly used with Support Vector Machines to repeatedly construct a model and remove features with minimum weights. These approaches tend to be between filters and wrappers in terms of computational diversity.
[image:4.595.38.265.266.382.2]In statistics, the most preferred form of feature selection is stepwise regression, which is a wrapper technique. It is a greedy algorithm that appends the best feature (or deletes the worst feature) at each round. The main control issue is determine when to stop the algorithm. In machine learning, this is typically done by cross-validation. In statistics, some standards are optimized. This leads to the inherent problem of nesting.
Figure 3:Embedded Method
3. PROBLEM STATEMENT
The quality of DBSCAN depends on the distance measure (P,ε). The most common distance metric used is Euclidean distance. Especially this metric can be rendered almost useless for high-dimensional data, making it difficult to find an appropriate value for ε. DBSCAN algorithm fails in case of varying density clusters.
4. PROPOSED SYSTEM
© 2017, IRJET | Impact Factor value: 5.181 | ISO 9001:2008 Certified Journal | Page 871 Figure 4:System Architecture
[image:5.595.38.242.464.722.2]Figure 5:DBSCAN Flowchart based on Map Reduce
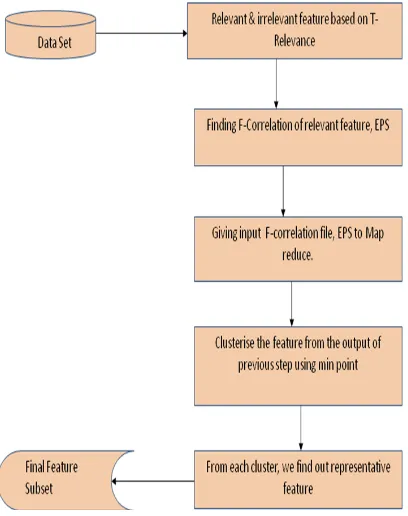
Figure 6:Flow Diagram
4.1 Subset Selection Algorithm:
The extraneous options, at the side of redundant options, severely have an effect on the accuracy of the educational machines. Thus, feature set choice ought to be ready to determine and take away the maximum amount of the extraneous and redundant data as potential. Moreover, “good feature subsets contain options extremely related with (predictive of) the category, nevertheless unrelated with (not prognostic of) one another. Keeping these in mind, we tend to develop a completely unique algorithmic program which may with efficiency and effectively handle each extraneous and redundant option, and acquire a decent feature set.
4.2 Time Complexity:
The major quantity of labor for algorithmic rule one involves the computation of SU values for TR connectedness and F-Correlation that has linear complexness in terms of the amount of instances during a given knowledge set. The primary a part of the algorithmic rule encompasses a linear time complexness in terms of the amount of options m. presumptuous options square measure designated as relevant ones within the initial half, once k ¼ only 1 feature is chosen.
4.2.1 Removal of Irrelevant Features:
An efficient way for degrading dimensionality, removing irrelevant data, increasing learning accuracy, and improving results comprehensibility. If we take a Dataset ‘D’ with m features F={F1,F2,..,Fn} and class C, by default features are available with target relevant feature. The generality of the selected features is limited and the computational complexity is more. The hybrid methods are a combination of filter and wrapper methods by using a filter method to degrade search space that will be considered by the subsequent wrapper.
4.2.2 T-Relevance, F-Correlation Calculation:
© 2017, IRJET | Impact Factor value: 5.181 | ISO 9001:2008 Certified Journal | Page 872 4.2.3 T-Relevance, F-Correlation Calculation:
We can take benefit of the MapReduce programming model to parallelize the whole process to save clustering time and resources [2]. The basic idea of DBSCAN algorithm based on MapReduce is divided into four steps:
1. The data in the dataset cut into small blocks which are equal size.
2. The blocks are distributed to the nodes in the cluster, Hence all of nodes in the cluster can run the Map function of themselves in parallel to calculate and process those blocks.
(i) Initial Cluster: For any unlabeled object p in the dataset, using Map-Reduce parallel Programming model to calculate the number of objects in its region to determine if it is a core object. If is, P and all the objects in the region of P constitute an initial class (C), and marked those objects with the same cluster identifier (Cid). Conversely, if P is not a core object, and there is no other object in its region, marked P as noise. Otherwise, detect whether there has a core object q in the region of non-core object p. If has, given the object p and the objects in the region of 1 with the same cluster identifier. Repeat until all of the objects in the dataset are identified. After the process is completed, get an initial class cluster and a noise set.
(ii) Merge Result: Class merging is to consider these objects which exist in more than two classes. If there is a sharing core object, merging the two classes. Else classify the object as the proximity side. It will be given a new class name if there have different classes are combined. When there is no object exists in different classes, merging initialize class completed.
3 Merge the result of each processor
4 Output clustering results.
5. FAST ALGORITHM
Inputs: D(F1, F2, ..., FM, C) - the given data set
𝜃 - the T-Relevance threshold, radius Eps, density threshold
MinPts , Output:class C
output: S - selected feature subset .
//==== Part 1 : Irrelevant Feature Removal ====
1 for i = 1 to m do
2 T-Relevance = SU (Fi, C)
3 if T-Relevance > 𝜃 then
4 S = S ∪ {Fi };
//==== Part 2 : Density Based Clustering ====
5 G = NULL; //G is a complete graph
6 for each pair of features {𝐹 ′𝑖, 𝐹′𝑗} ⊂ S do
7 F-Correlation = SU (𝐹′𝑖, 𝐹′𝑗)
8 𝐴𝑑𝑑𝐹′𝑖𝑎𝑛𝑑 𝑜𝑟𝐹′𝑗𝑡𝑜𝐺𝑤𝑖𝑡 F-Correlation 𝑎𝑠𝑡𝑒
𝑤𝑒𝑖𝑔𝑡 𝑜𝑓 𝑡𝑒𝑐𝑜𝑟𝑟𝑒𝑠𝑝𝑜𝑛𝑑𝑖𝑛𝑔𝑒𝑑𝑔𝑒 ;
//== Part 3: Representative Feature Selection ====
9 DBSCAN(D, Eps, MinPts)
10 Begin
11 init C=0;// The number of classes is initialized to 0
12 for each unvisited point p in D
13 mark p as visited; //marked P as accessed
14 N = getNeighbours (p, Eps);
15 if sizeOf(N) < MinPts then
16 mark p as Noise; //if sizeOf(N) < MinPts,then mark P as noise
17 else
18 C= next cluster; //create a new class C
19 ExpandCluster (p, N, C, Eps, MinPts);//expand class C
20 end if
21 end for
22 End
23 for each cluster
24 add feature with max T-relevance to final subset
© 2017, IRJET | Impact Factor value: 5.181 | ISO 9001:2008 Certified Journal | Page 873 6. CONCLUSIONS
DBSCAN algorithm based on the Map Reduce divides tasks in such a way that allows their execution in parallel. Parallel processing allows multiple processors to take on these divided tasks, such that they run entire programs in less time. Hadoop’s Map Reduce programming allows for the processing of such large volumes of data in a completely safe and cost-effective manner.
REFERENCES
[1].MR-IDBSCAN: Efficient Parallel Incremental DBSCAN Algorithm using MapReduce by Maitry Noticewala CSE department Parul Institute of Technology 29, Gopaleshvar Soc. Tadwadi Rander Road, Surat-395009 and Dinesh Vaghela CSE department Parul Institute of Technology Limda, Vadodara, Indi
[2]. Research of parallel DBSCAN clustering algorithm based on MapReduce by Xiufen Fu, Shanshan Hu and Yaguang Wang School of Computer, Guangdong University of Technology, 510006, P.R.China xffu@gdut,edu.cn, [email protected]
[3]. Filter versus Wrapper Feature Subset Selection in Large Dimensionality Micro array: A Review, Binita Kumari,Tripti Swarnkar . Department of Computer Science - Department of Computer Applications, ITER, SOA University Orissa, INDIA
[4].Data Mining Cluster Analysis
http://www.tutorialspoint.com/data_mining/dm_cluste r_analysis.html, Copyright © tutorialspoint.com
[5]. Wikipedia on clusters
[6]. A Dynamic Feature Selection Method For Document Ranking with Relevance Feedback Approach, K.Latha, B.Bhargavi, C.Dharani and R.Rajaram Department of Computer Science and Engineering, Anna University of Technology, Tiruchirappalli, Tamil Nadu, India. E-mail:
[email protected] Department of Information
Technology, Thiagarajar College of Engineering, Madurai, Tamil Nadu, India E-mail: [email protected]
[7].Bayes Classifier for Different Data Clustering-Based Extra Selection Methods, Abhinav. Kunja, Ch.Heyma Raju Dept. of Computer Science and Engineering, Gitam University Visakhapatnam, AP, India
[8].An Evaluation on Feature Selection for Text Clustering, Tao Liu Department of Information Science, Nankai University, Tianjin 300071, P. R. China. Shengping Liu Department of Information Science, Peking University, Beijing 100871, P. R. China. Zheng Chen, Wei-Ying Ma Microsoft Research Asia, 49 Zhichun Road, Beijing 100080, P. R. China
BIOGRAPHIES
Nilam Prakash Sonawale is Student of M.E. Computer Engineering, Bharati Vidyapeeth College of Engineering, Mumbai University, Navi Mumbai, Maharashtra, India.
Senior Consultant at Capgemini Pvt. Ltd.,
Her area of interest is Data Warehousing and Data Mining.