Repeat Fingerprinting with New Primer Sets for Methicillin-Resistant
Staphylococcus aureus
Artur J. Sabat, Monika A. Chlebowicz, Hajo Grundmann, Jan P. Arends, Greetje Kampinga, Nico E. L. Meessen, Alexander W. Friedrich, and Jan Maarten van Dijl
Department of Medical Microbiology, University of Groningen, University Medical Center Groningen, Groningen, The Netherlands
The detection of outbreaks of methicillin-resistantStaphylococcus aureus(MRSA) infections and a rapid and accurate identifica-tion of sources and routes of transmission should be conducted in hospital settings as early and swiftly as possible. In this study, we investigated the application potential of a new approach based on multiple-locus variable-number tandem-repeat finger-printing (MLVF) and microfluidics technology for a rapid discrimination of MRSA lineages in outbreak settings. A total of 206 nonrepetitive MRSA isolates recovered from infected patients at the University Medical Center Groningen between 2000 and 2010 were tested. The results obtained by MLVF using microcapillary electrophoresis with newly designed primers were com-pared to those obtained byspatyping and multiple-locus variable-number tandem-repeat analysis (MLVA). The discriminatory power was 0.980 (107 patterns), 0.969 (85 allelic profiles), and 0.959 (66 types) for MLVF, MLVA, andspatyping, respectively. All methods tested showed a good concordance of results calculated by the adjusted Rand’s coefficient method. Comparisons of data obtained by the three approaches allowed us to propose an 88% cutoff value for the similarity between any two MLVF patterns, which can be used inS. aureusepidemiological studies, including analyses of outbreaks and strain transmission events. Of the three tested methods, MLVF is the cheapest, fastest, and easiest to perform. MLVF applied to microfluidic polymer chips is a rapid, cheap, reproducible, and highly discriminating tool to determine the clonality of MRSA isolates and to trace the spread of MRSA strains over periods of many years. Althoughspatyping should be used due to its portability of data, MLVF has a high added value because it is more discriminatory.
I
n the past decade, various DNA typing methods have been de-veloped to study the epidemiology ofStaphylococcus aureus. Of particular concern is tracking the spread of methicillin-resistantS.aureus(MRSA) in the community and in hospital settings. When
typing is applied at the hospital level, it can be used to trace clonal outbreaks of MRSA and chains of transmission within institu-tions. Molecular typing systems for continuous surveillance must not only be able to accurately separate the most prevalent MRSA types but also have adequate stability to provide a report in a timely manner in order to implement optimal infection control measures. Moreover, typing methods that allow interlaboratory data exchange via easily accessible databases have a clear advan-tage. Therefore, an optimal typing approach must be endowed with high discriminatory power and produce portable data and at the same time must be rapid, highly reproducible, easy to perform, and inexpensive.
Pulsed-field gel electrophoresis (PFGE) has been considered to be the gold standard in typing of a variety of bacteria, includingS.
aureus. It is a highly discriminatory approach. However, PFGE is
currently regarded as too labor intensive and costly for further use as a primary typing tool in the hospital setting. Moreover, the interlaboratory comparison of data produced by PFGE is chal-lenging (3).
Multilocus sequence typing (MLST) is based on the sequence polymorphism of internal fragments of seven housekeeping genes. This is an excellent tool to investigate the core genetic pop-ulation structure of S. aureus(5). During a study, isolates are grouped into clonal complexes and singletons by using the pro-gram BURST (Based Upon Related Sequence Types) and further analysis of the data can be conducted in conjunction with the
entireS. aureusMLST database (http://saureus.mlst.net). How-ever, MLST is labor intensive and costly and has only a moderate discriminatory power. Therefore, it is not suitable for use in an outbreak setting.
In recent years,spasequence typing has become the most pop-ular typing method forS. aureus. Genetic diversity in thespalocus arises from both a variable number of tandem repeats (VNTRs) and point mutations in the gene encoding cell surface protein A. Althoughspatyping showed less discriminatory power than PFGE (21,22), its low cost, high reproducibility, appropriate stability, high throughput due to the StaphType software, and full data portability via the Ridom database (Ridom GmbH, Würzburg, Germany) made this method the primary tool for characterization of MRSA isolates at the local, national, and international level (4,
9,11,13,14,20). Moreover, implementation of the BURP (based upon repeat patterns) algorithm with the StaphType software greatly simplified classification of the isolates into clonal com-plexes and singletons. The BURP algorithm calculates the costs for clusteringspatypes. In the BURP analysis, the costs stand for the steps of evolution between thespatypes; the more genetic changes
Received6 January 2012 Returned for modification29 February 2012 Accepted28 April 2012
Published ahead of print9 May 2012
Address correspondence to Alexander W. Friedrich, [email protected].
Supplemental material for this article may be found athttp://jcm.asm.org/. Copyright © 2012, American Society for Microbiology. All Rights Reserved.
doi:10.1128/JCM.00056-12
on May 16, 2020 by guest
http://jcm.asm.org/
between two differentspatypes, the higher the cost. However,spa
typing also has certain limitations. The method can misclassify particular types due to recombination/homoplasy, and there are no clear rules as to which cost of the BURP algorithm should be used during a study. Therefore, criteria for the clustering ofspa
types need to be determined and validated in different studies in relation to the size of investigated isolate collections and the levels of the laboratories conducting the typing analyses (i.e., local, re-gional, or national levels).
More recently, the multilocus VNTR analysis (MLVA) method has been developed to overcome the inherent limitations of PFGE, MLST, andspatyping (25). Schouls and colleagues (25) showed that MLVA was at least as discriminatory as PFGE and at the same time produced portable data with ease of interpretation compara-ble to that of MLST andspatyping. Moreover, significant congru-ence of the results produced by MLVA, PFGE, MLST, andspa
typing was observed (25).
The multilocus VNTR studies for bacterial typing were first used in the second half of the 1990s (10,26). Since then, a number of MLVA methods for the typing of different bacterial species were published before they were adopted forS. aureus(6,7,18,19). Multilocus VNTR fingerprinting (MLVF), formerly called MLVA, was the first multiplex PCR-based assay targeting various VNTRs for typing ofS. aureusisolates (23). MLVF analyzes polymor-phism of the VNTR regions located in seven individual genes (sspA,spa,sdrC,sdrD,sdrE,clfA, andclfB). The discriminatory power of MLVF was found to be comparable with that of PFGE and higher than that of MLST, MLVA,spatyping, and other PCR-based methods (15,17,21,22,24). MLVF is much cheaper, faster, and easier to use than PFGE and, therefore, more useful in an outbreak setting than the gold standard method. However, like PFGE, MLVF produces subjective results, which cannot be easily compared between different laboratories via the Internet. The present study was designed to improve the resolution of MLVF by (i) designing a new set of primers for the same VNTR regions; (ii) combining the method with microfluidics technology; and (iii) testing more-stringent criteria for the generation of dendrograms. Moreover, criteria for clustering of MLVF patterns were proposed based on comparisons with the results produced by the MLVA andspatyping methods.
MATERIALS AND METHODS
Bacterial isolates.A total of 206 nonreplicate MRSA isolates (see Table S1 in the supplemental material), recovered from patients at the University Medical Center Groningen between 2000 and 2010, were analyzed in the current study. Among them, 19 MRSA isolates were considered to belong to a nosocomial cluster based on their identical antibiotic resistance pro-files and isolation dates (18 isolates recovered within a 2-month window and the remaining isolate 4 months later).
Extraction of total DNA for PCR.Total DNA was prepared from 10 to 15 colonies lifted from blood agar plates incubated for 24 h at 37°C and suspended in 500l of Tris-EDTA (TE) buffer (pH 8.0). The cell suspen-sion was transferred to 2-ml bead-beating tubes with screw caps contain-ing zirconia/silica beads with a diameter of 100m and 500l of phenol-chloroform solution. The tubes were fixed in a Precellys bead beater, which was operated 3 times for 30 s per pulse at a speed of 5,000 rpm, with 30-s intervals between pulses. Subsequently, the samples were sequentially extracted with phenol and then chloroform. The DNA was precipitated with isopropanol, washed with 70% ethanol, air dried, and then dissolved in 50l of DNase- and RNase-free water. The DNA concentration was quantified using a NanoDrop spectrophotometer (NanoDrop Technolo-gies, Wilmington, DE) at 260 nm.
MLVA.MLVA was performed according to the protocol developed by Schouls et al. (25). Isolates that differed by one or more alleles were con-sidered distinct types. Minimum-spanning-tree analysis of MLVA was performed by using BioNumerics software (Applied Maths) to classify related types into clonal complexes (CCs). Such CCs were assigned when two or more neighboring types differed only at a single locus. A singleton was defined as a type that was not grouped into a clonal complex.
spatyping.Amplification of the variable X region of thespagene was performed as described by Aires-de-Sousa et al. (1). Thespatypes were assigned through the use of Ridom StaphType software version 1.4.6 (Ridom GmbH, Würzburg, Germany) and the Ridom SpaServer (http: //www.spaserver.ridom.de) (14).spaclonal complexes (spa-CCs) were composed of 2 or more relatedspatypes and were identified based upon the repeat pattern (BURP) algorithm implemented in the Ridom Staph-Type software. Aspatype which was not grouped into anyspa-CC was regarded as a singleton.
MLVF.MLVF typing was performed with a new set of primers (Table 1) designed for flanking sequences of the VNTR regions selected previ-ously (23). Amplification of the DNA fragments was performed using the following cycling conditions: a predenaturation at 98°C for 30 s followed by 20 cycles of 98°C for 10 s, 60°C for 30 s, and 72°C for 30 s, with a final extension at 72°C for 5 min. Each PCR mixture had a final volume of 5l, containing 0.25 U of Phire Hot Start II DNA polymerase (Finnzymes, Espoo, Finland), 0.2 mM deoxynucleoside triphosphates, 1⫻Phire reac-tion buffer, 0.5M each ClfB1-F, ClfB1-R, SpaI-F, and SpaI-R, 1M each ClfA1-F, ClfA1-R, SdrCDE-F, and SdrCDE1-R, 2M each SspA1-F and SspA1-R, and 5 ng of template DNA. After PCR amplification, 1l of each PCR product was loaded on a DNA 7500 chip and amplicon detection was automated with the microfluidics-based Agilent 2100 BioAnalyzer (Agi-lent Technologies, Palo Alto, CA) according to the manufacturer’s proto-col. Any two MLVF fingerprints differing by one or more bands were considered distinct patterns. The MLVF patterns were imported as comma-separated-values (CSV) files into GelCompar software (Applied Maths, Kor-trijk, Belgium) for further analysis. The position tolerance and optimization were set to 0.6% and 0.5%, respectively. Pairwise similarity coefficients were calculated using the Dice formula, and dendrograms were created using the unweighted-pair group method using average linkages (UPGMA). Only identical patterns were regarded as representing the same subtype.
Data analysis.Ridom EpiCompare software version 1.0 (http://www3 .ridom.de/epicompare/) was used to calculate the discriminatory power and concordance of the typing methods. The discriminatory power was estimated by Simpson’s index of diversity, expressing the probability that two unrelated and different isolates sampled from the test population would be grouped as different subtypes by a specific typing method (16). The 95% confidence intervals (CI) were calculated according to the method previously described by Grundmann et al. (12). Nonoverlapping confidence intervals were regarded as representing statistically significant differences in discriminatory power (12). The concordance between typ-ing methods was assessed by the adjusted Rand’s (AR) and Wallace’s (W) coefficients (2). The AR coefficient indicates the global agreement be-tween two methods, whereas the W coefficient shows the probability that two isolates classified as the same type by one method would also be classified as the same type by another method.
TABLE 1Primers used in this study
Marker locus
Primer
designation Primer sequence Reference
clfA ClfA1-F 5=-CAGATTCTGACCCAGGTTCAG This study ClfA1-R 5=-TTCAGAACCTGTATCTGGTAATGG This study
clfB ClfB1-F 5=-TGATGGTGATTCAGCAGTAAATCC This study ClfB1-R 5=-ATTATTTGGTGGTGTAACTCTTGAATC This study
sdr SdrCDE-F 5=-GTAACAATTACGGATCATGATG 23 SdrCDE1-R 5=-TTCAYTACCWGTTTCTGGTAATGCTTT This study
spa SpaI-F 5=-CTAAACGATGCTCAAGCACCAAAA This study SpaI-R 5=-GTATCACCAGGTTTAACGACATGT This study
ssp SspA1-R 5=-TTGTCWGAATTATTGKTATCGCCATTRTC This study SspA1-F 5=-GAAGATATCMATTTYGCMAAYGATGACC This study Sabat et al.
on May 16, 2020 by guest
http://jcm.asm.org/
RESULTS
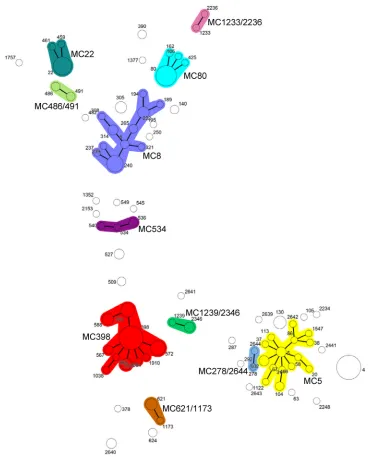
MLVA.The 206 MRSA isolates produced 85 MLVA types (see Table S1 in the supplemental material). Thirty types were shared by 2 or more isolates (151 isolates in total), whereas 55 types were represented by a single isolate. Fifty-six types comprising 143 iso-lates were classified into 11 CCs, while the remaining 29 types were singletons (63 isolates in total) (Fig. 1).
spatyping.Among all examined isolates, our analysis yielded 66spatypes, ranging in length between 3 (t026 and t777) and 16 (t032) repeats (see Table S1 in the supplemental material). Twenty-seven types were represented by 2 or more isolates (167 isolates in total), while 39 types contained a single isolate. To assign the
iso-lates intospa-CCs, we tested different cost values of BURP, and the
spatyping results were compared to those produced by the MLVA method. For the comparisons, we used allspatypes, even includ-ing those that were shorter than 5 repeats in length (spatypes t026 and t777). Initially,spatypes were clustered if the cost of the BURP algorithm was less than or equal to 4 (default value in Ridom StaphType software version 2.2.1). Further, the costs of BURP at values lower than 4 were tested. The concordance (AR) value be-tween MLVA andspaclonal complexes was 0.779 when a BURP cost ofⱕ4 was applied. The concordance (AR) between clonal complexes of the two typing methods increased to a value of 0.938 and subsequently decreased to the initial level, 0.767, when the FIG 1Minimum spanning tree produced using 206 MRSA isolates by MLVA. A categorical coefficient and the priority rule using the highest number of single-locus changes were used for the clustering of MLVA profiles. Each circle represents a single MLVA profile, and the circle size indicates the number of isolates with that profile. Different clonal complexes are indicated by the different colors. These clonal complexes were assigned if 2 neighboring MLVA types did not differ in more than 1 VNTR locus. MLVA types and complexes are also indicated in characters, e.g., 5 denotes MLVA type 5 and MC5 represents MLVA clonal complex 5.
on May 16, 2020 by guest
http://jcm.asm.org/
[image:3.585.107.483.63.520.2]costs of BURP wereⱕ3 andⱕ2, respectively. We used for further comparisons a BURP cost ofⱕ3, as that was the value at which MLVA andspaclonal clustering showed the highest concordance, calculated by adjusted Rand’s coefficients. spa typing (with a BURP cost ofⱕ3) produced 11spa-CCs (135 isolates in total) and 24 singletons (71 isolates in total) (Fig. 2).
New MLVF primers to improve efficiency and specificity of the method.To improve the amplification efficiency as well as the specificity of MLVF, a new set of primers was designed based on the whole genome sequences of 24S. aureusstrains deposited in the NCBI database for complete microbial genomes (www.ncbi .nlm.nih.gov/genomes/lproks.cgi) (accessed July 2011). Analysis of the reliability of MLVF using previously and newly design prim-ers was further performed on 4 genetically unrelated isolates (data not shown). To address this aim, amplifications of all MLVF loci were conducted separately and, after electrophoresis, the presence and intensity of the amplified bands were compared with the MLVF profiles obtained after multiplex PCR. It appeared that the combination of 1 previously published and 5 newly designed primers gave the best results (Table 1). Specifically, it was possible to reduce the background and increase the intensity of amplicons for all tested isolates by the use of the new primer combination. Moreover, in the case of one of the tested isolates, aspaamplicon was generated with the new primers, while the already published primers did not give an amplification product for this locus.
Reproducibility of the MLVF method.In order to test the reproducibility of MLVF, the patterns were obtained from 12 iso-lates in two independent experiments with different DNA prepa-rations and PCR amplifications and by running the samples on
separate chips. In these experiments, MLVF showed excellent re-producibility (100%). Moreover, on each chip the same isolate (designated M2) was included to monitor the quality of DNA extraction, PCR amplification, and electrophoretic separation. Each time, the MLVF method produced the same banding pattern for isolate M2.
Criteria for defining MLVF clusters.MLVF analysis identified 107 different banding patterns among 206 MRSA isolates (see Table S1 in the supplemental material). Thirty-two patterns were represented by two or more isolates (131 isolates in total). The remaining 75 patterns contained a single isolate. In order to de-termine rules for clustering the patterns into clonal groups, differ-ent cutoff values for the similarities between the MLVF banding profiles were tested. Using a similarity cutoff value of 68%, which was the value most frequently used in our laboratory for interpre-tation of the MLVF banding patterns obtained after conventional electrophoresis on agarose gels, the values for concordance (AR) between the MLVF clusters and the clonal complexes obtained by MLVA andspatyping were 0.763 and 0.764, respectively. With a cutoff value of 64%, the values for concordance (AR) between the MLVF clonal groups and those of MLVA andspatyping were higher than previously reported at 0.783 and 0.781, respectively. However, by applying more relaxed conditions to the MLVF in-terpretation, with the cutoff value equal to 60%, the values for concordance (AR) between the MLVF clusters and the MLVA and
spa-CCs dropped and were 0.775 and 0.780, respectively. Thus, the MLVF clusters were most consistent with the clonal complexes generated by MLVA andspatyping when the cutoff value between the MLVF patterns was set at a level of 64%. With the 64% cutoff, FIG 2Population structure of the UMCG MRSA isolates after BURP analysis with a cost ofⱕ3. Clusters of linkedspatypes correspond tospa-CCs. Thespatypes that were defined as founders of particular clusters are indicated in blue, and subfounders are indicated in yellow.
Sabat et al.
on May 16, 2020 by guest
http://jcm.asm.org/
[image:4.585.76.510.65.361.2]192 of the isolates were classified into 23 clusters designated C1 to C23, while 14 isolates had separate positions in the dendrogram (see Table S1 in the supplemental material). Among the 23 MLVF clusters, which were distinguished by applying the 64% similarity cutoff value, we found nine clusters (C3, C4, C5, C6, C8, C9, C16, C21, and C22) in which the isolates were unrelated by both MLVA andspatyping.
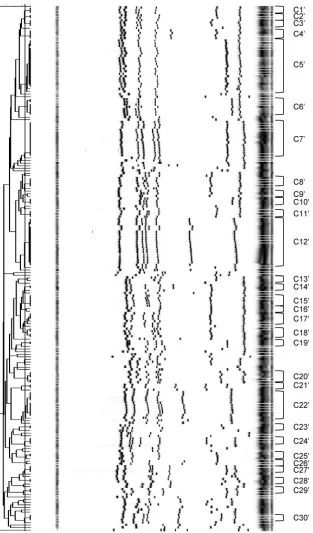
We subsequently searched for a level of similarity between MLVF patterns that would be in best concordance (AR) with the determined MLVA andspatypes. Based on visual inspection of the MLVF dendrogram, we tested the cutoff values of 83%, 85%, 88%, and 90%; the concordance (AR) values for MLVF clusters andspatypes were 0.787, 0.791, 0.797, and 0.786, respectively, whereas the concordance (AR) values for the MLVF clusters and MLVA types were 0.787, 0.793, 0.811, and 0.800, respectively. Therefore, the MLVF clusters were most consistent with the MLVA andspatypes when the cutoff value between the MLVF banding profiles was set at the level of 88%. Based on the cutoff value of 88% (Fig. 3), 30 MLVF clusters comprising 145 isolates were determined and designated C1=to C30=, whereas 61 isolates formed an outgroup (see Table S1 in the supplemental material). With the MLVF similarity cutoff value of 88%, any two isolates were always grouped together within a corresponding spa-CC and, with the exception of the isolates of MLVF clusters C9=and C11=, always in a corresponding MLVA-CC. However, none of the “missing” isolates was clustered together with any other isolates by MLVA. Only MLVF was able to correctly cluster the outbreak isolates (MLVF cluster C12=withspatype t041 and MLVA type 4). However, thespaand MLVA clusters identified an extra isolate (designated M75) which had been recovered from a patient 4 years after the outbreak. This additional isolate (M75) was a part of a MLVF cluster when the less stringent criteria for MLVF interpre-tation were applied (cluster C5).
Discriminatory power.The MLVF approach was the most dis-criminatory method in this study, but in the case of MLVA, the difference was not statistically significant because of overlapping 95% confidence intervals (CI95) (0.98 [CI95, 0.972 to 0.987] and 0.969 [CI95, 0.96 to 0.979], respectively). The discriminatory power ofspatyping was 0.959 (CI95, 0.949 to 0.969), and its res-olution differed substantially from that of MLVF (nonoverlap-ping 95% confidence intervals). The isolates identical by MLVF (131 isolates) were in most cases (94.7%; 124/131) indistinguish-able byspatyping (124 isolates). Compared to MLVA,spatyping had a lower but nevertheless comparable discriminatory power for subtyping MRSA isolates, since their 95% confidence intervals overlapped.
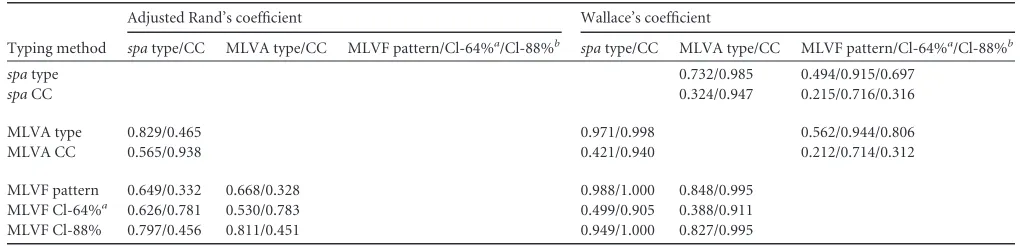
Concordance between methods.The values for concordance between the typing methods compared are listed inTable 2. On the pattern/type level, the highest (and very good) concordance was found between the results produced by MLVA andspatyping (AR, 0.829). The same methods showed excellent clonal clustering concordance (AR, 0.938). The concordance between MLVF pat-terns and MLVA andspatypes was much lower (AR, 0.668 and 0.649, respectively). This was not surprising, because the discrim-inatory ability of MLVF was much higher than that of MLVA and
spatyping. Much better concordance levels were found when the MLVF clusters determined with the cutoff level of 64% and MLVA andspaclonal complexes were compared (AR, 0783 and 0.783, respectively). However, higher concordance levels were observed between the MLVF clusters defined by the use of the 88% cutoff
value and MLVA andspa types (AR, 0.811 and 0.797, respec-tively).
MLVF performed on the level of patterns and clusters defined by a similarity cutoff value of 88% showed a complete probability (W, 1) of predicting the correspondingspa-CC (Table 2). Also, the MLVA type showed a high probability of predicting thespa-CC, with a Wallace’s coefficient of 0.998. Other excellent Wallace’s coefficient values were found for MLVF patterns and clusters with a similarity cutoff value of 88% to predict MLVA-CC (W, 0.995) as well as for MLVF patterns to predictspatypes (W, 0.988) and forspatypes to predict MLVA-CCs (W, 0.985). The lowest Wal-lace’s coefficients were found for MLVA-CCs andspa-CCs to pre-dict MLVF patterns (W, 0.212 and 0.215, respectively).
DISCUSSION
The MLVF method was originally designed in 2002 and published 1 year later (23). In the year 2002, the completed and unfinished genome sequences of only 6S. aureusstrains were publicly avail-able through the Internet. During recent years, additional com-pleteS. aureusgenome sequences were released, which substan-tially enriched our knowledge about the genetic diversity of this species. Using this information, it was possible to design the new set of MLVF primers, which improved the efficiency of the method by reducing the background and enhancing the intensity of the bands in the patterns. Moreover, for someS. aureusstrains it is now possible to obtain amplicons which had not been ampli-fied using the previously described MLVF primers due to mis-matches in the regions for which these primers were designed.
In 2005, Francois and colleagues (8) reported on the use of a multiple-locus, variable-number tandem-repeat-based method in conjunction with the Agilent BioAnalyzer for the typing ofS. au-reusisolates. They showed the usefulness of this approach in terms of performance and cost. Therefore, to improve the electropho-retic separation reproducibility and resolution of MLVF as well as couple the method with a rapid and automated analysis of data, the Agilent BioAnalyzer was applied in our present study. The BioAnalyzer sizes and quantitates 12 DNA samples on a dispos-able chip in approximately 40 min. The resulting data are pro-duced in the form of an electropherogram, which graphically de-picts spikes in fluorescence over time. For each peak in a pattern, the BioAnalyzer software calculates the corresponding size and concentration. An advantage of the BioAnalyzer software is that the exported data already contain normalized curves and strain information, which greatly speeds up the analysis of the results in comparison to the traditional agarose gel method. In practice, by applying microfluidic chips for MLVF, 12 samples can be ana-lyzed in a single run within 1 h from start to finish, including the postanalysis data processing. By comparison, the previ-ously established MLVF protocol (23), which utilizes conven-tional DNA electrophoresis, takes about 3 h. This includes elec-trophoresis of 16 samples and 4 external standards (in the first, 2 middle, and last lane positions of the gel to obtain reliable fragment position normalization) on an agarose gel (2 h 15 min), gel documentation (15 min), and dendrogram genera-tion (30 min).
The accurate sizing of the DNA fragments by the BioAnalyzer allows the application of more stringent conditions (lower match-ing tolerance for pattern interpretation) in the clustermatch-ing of band-ing patterns than the MLVF analysis by conventional electropho-resis. The accuracy is further enhanced by including upper and
on May 16, 2020 by guest
http://jcm.asm.org/
lower molecular weight markers in each sample, which allows de-tailed comparisons between samples analyzed with one chip and matching fragment patterns obtained with multiple chips. There-fore, the analysis using microfluidic chips not only enables the identification of identicalS. aureusisolates by the same MLVF pattern but also allows a clear distinction of nonidentical isolates with DNA fragment positions differing slightly from each other.
This is especially important in hospital settings with high rates of epidemic MRSA infections, where MLVF analysis with the Bio-Analyzer is better able to show a person-to-person mode of strain transmission.
The total costs of all reagents and consumables for MLVF per-formed with the microfluidics-based BioAnalyzer platform (not including labor) are small and at least comparable with those of FIG 3MLVF dendrogram of the study isolates generated by the UPGMA algorithm. Isolate clusters were delineated with an 88% similarity cutoff value. For clarity, only the MLVF clusters are indicated. MLVF clusters are shown in characters, e.g., C1=denotes MLVF cluster 1.
Sabat et al.
on May 16, 2020 by guest
http://jcm.asm.org/
[image:6.585.139.452.65.598.2]MLVF performed with conventional agarose gels. The DNA ex-traction procedure is the same for both approaches, and its costs amount to approximately€0.2 or $0.25 per sample. The main differences in the costs of the two approaches relate to the prices for PCR amplification and DNA electrophoresis. A clear advan-tage of analyses performed with the BioAnalyzer is the minimal sample consumption. Only 1l of PCR mixture is needed for a single run. In the case of conventional agarose gel analysis, a 5- to 10-l volume of PCR mixture is needed to monitor the MLVF amplification products upon ethidium bromide or SYBR Safe staining with a UV transilluminator (15,23). In total, the costs of PCR amplifications for MLVF analyses performed with the Bio-Analyzer (5l final volume) amount to€0.4 or $0.5 per sample, while these costs amount to€1.6 to€4 or $2.1 to $5.2 (20-to-50-l final volumes) for MLVF analyses employing conventional aga-rose gels. On the other hand, the BioAnalyzer chip electrophoresis is more expensive (€1.5 or $2 per sample) than the conventional electrophoresis (€0.3 or $0.4 per sample). Altogether, the costs of materials for MLVF performed with the Agilent BioAnalyzer amount to€2.1 or $2.75 per sample, while the costs for MLVF with conventional agarose gels amount to€2.1 to€4.5 or $2.75 to $5.85. In the current study, we tested the clustering potential of the MLVF method. We particularly looked for those clustering crite-ria for the MLVF method that would be optimal in an outbreak setting. At the group level, the highest concordance was obtained when the cutoff value of the similarity between two MLVF pat-terns was set at 64%. However, with the 64% cutoff, we found nine MLVF clusters (C3, C4, C5, C6, C8, C9, C16, C21, and C22) in which the isolates were unrelated by both MLVA andspatyping. As effective control of MRSA outbreaks requires identification of true clusters of infected patients, clustering criteria must be strin-gent enough to differentiate outbreak isolates from nonoutbreak isolates. Therefore, we tested more stringent criteria in MLVF in-terpretation. When the cutoff value of 88% was applied, the MLVF clusters were the most consistent with the MLVA andspatypes. The MLVF clusters obtained by applying a cutoff level of 88% never grouped isolates that were identified as being unrelated by MLVA andspatyping. In fact, the isolates of MLVF clusters de-fined by the 88% cutoff were always grouped in the corresponding
spa-CCs and almost always in the corresponding MLVA-CCs. Therefore, for epidemiological typing, MLVF clusters defined with the cutoff value of 88% are the most suitable for detecting outbreaks as well as identifying sources and routes of transmis-sion.
A cost analysis of all reagents and consumables indicates that the costs of MLVF performed with the Agilent BioAnalyzer amount to approximately€2.1 or $2.75 per sample, which is sig-nificantly lower than the costs of MLVA orspatyping (about€8 to
€9 or $10 to $12). Also, the start-up costs for the instrumentation needed for MLVF are much lower than those for MLVA andspa
typing. The costs for the microfluidics-based Agilent 2100 Bio-Analyzer are a few times lower than those of DNA sequencers. Moreover, in laboratories that already possess equipment for the DiversiLab (bioMérieux, Marcy l’Etoile, France) repetitive ele-ment-PCR (rep-PCR) typing, the same device can be used for MLVF. Importantly, the MLVF procedure is faster and more straightforward to perform than the MLVA andspatyping proce-dures. All 3 of these typing methods can use the same DNA extrac-tion protocols and involve PCR amplificaextrac-tion. The MLVF andspa
amplicons are obtained in a single tube, while the MLVA ampli-cons are obtained in 2 PCRs. The MLVF amplification products are directly separated by electrophoresis using the BioAnalyzer, whilespaand MLVA amplicons involve PCR handling steps prior to electrophoretic separation on a DNA sequencer.
In conclusion, MLVF was shown to be cheaper, faster, more discriminatory, and easier to use than MLVA and spa typing. However, MLVF cannot replace MLVA andspatyping, because it does not produce portable data. In our hospital, MLVF is there-fore used as the complementary method forspatyping. All MRSA isolates are characterized byspa typing as the first-line typing method. In those cases where different isolates with the samespa
type are recovered from the patients, we use MLVF to conduct further subtyping of these isolates. Moreover, in outbreak situa-tions where several MRSA-carrying patients are detected within a short period of time, MLVF andspatyping are conducted in par-allel. In this way, MLVF is likely to become an important tool for enhanced MRSA control and prevention.
ACKNOWLEDGMENTS
We thank Gerlinde N. Pluister from the Laboratory for Infectious Dis-eases and Perinatal Screening, National Institute for Public Health and the Environment, Bilthoven, the Netherlands, for technical support in the MLVA typing studies. Furthermore, we thank Viktoria Akkerboom from the Department of Medical Microbiology, University of Groningen, Uni-versity Medical Center Groningen, the Netherlands, for excellent techni-cal assistance.
This work was supported by the Interreg Iva-funded project EurSafety Heath-net (III-1-02⫽73), a Dutch-German cross-border network sup-ported by the European Commission, the German federal states of Nor-TABLE 2Correlations between three typing methods according to adjusted Rand’s and Wallace’s coefficients
Typing method
Adjusted Rand’s coefficient Wallace’s coefficient
spatype/CC MLVA type/CC MLVF pattern/Cl-64%a/Cl-88%b spatype/CC MLVA type/CC MLVF pattern/Cl-64%a/Cl-88%b
spatype 0.732/0.985 0.494/0.915/0.697
spaCC 0.324/0.947 0.215/0.716/0.316
MLVA type 0.829/0.465 0.971/0.998 0.562/0.944/0.806
MLVA CC 0.565/0.938 0.421/0.940 0.212/0.714/0.312
MLVF pattern 0.649/0.332 0.668/0.328 0.988/1.000 0.848/0.995
MLVF Cl-64%a 0.626/0.781 0.530/0.783 0.499/0.905 0.388/0.911
MLVF Cl-88% 0.797/0.456 0.811/0.451 0.949/1.000 0.827/0.995
aMLVF clusters defined by the 64% cutoff value. b
MLVF clusters defined by the 88% cutoff value.
on May 16, 2020 by guest
http://jcm.asm.org/
[image:7.585.37.547.76.199.2]drhein-Westfalen and Niedersachsen, and the Dutch provinces of Overi-jssel, Gelderland, and Limburg.
REFERENCES
1.Aires-de-Sousa M, et al.2006. High interlaboratory reproducibility of DNA sequence-based typing of bacteria in a multicenter study. J. Clin. Microbiol.44:619 – 621.
2.Carriço JA, et al.2006. Illustration of a common framework for relating multiple typing methods by application to macrolide-resistant Streptococ-cus pyogenes.J. Clin. Microbiol.44:2524 –2532.
3.Cookson BD, et al.2007. Evaluation of molecular typing methods in characterizing a European collection of epidemic methicillin-resistant Staphylococcus aureusstrains: the HARMONY collection. J. Clin. Micro-biol.45:1830 –1837.
4.Deurenberg RH, et al.2009. Cross-border dissemination of methicillin-resistantStaphylococcus aureus, Euregio Meuse-Rhin region. Emerg. In-fect. Dis.15:727–734.
5.Enright MC, Day NP, Davies CE, Peacock SJ, Spratt BG.2000. Multi-locus sequence typing for characterization of methicillin-resistant and methicillin-susceptible clones ofStaphylococcus aureus.J. Clin. Microbiol. 38:1008 –1015.
6.Farlow J, et al.2002. Strain typing ofBorrelia burgdorferi,Borrelia afzelii, andBorrelia gariniiby using multiple-locus variable-number tandem re-peat analysis. J. Clin. Microbiol.40:4612– 4618.
7.Farlow J, et al.2001.Francisella tularensisstrain typing using multiple-locus, variable-number tandem repeat analysis. J. Clin. Microbiol.39: 3186 –3192.
8.Francois P, et al.2005. Use of an automated multiple-locus, variable-number tandem repeat-based method for rapid and high-throughput genotyping of Staphylococcus aureus isolates. J. Clin. Microbiol.43:3346 – 3355.
9.Friedrich AW, et al.2008. EUREGIO MRSA-net Twente/Münsterland—a Dutch-German cross-border network for the prevention and control of in-fections caused by methicillin-resistantStaphylococcus aureus. Euro. Surveill. 13:pii⫽18965. http://www.eurosurveillance.org/ViewArticle.aspx?ArticleId ⫽18965.
10. Frothingham R, Meeker-O’Connell WA.1998. Genetic diversity in the Mycobacterium tuberculosiscomplex based on variable numbers of tan-dem DNA repeats. Microbiology144:1189 –1196.
11. Grundmann H, et al.2010. Geographic distribution ofStaphylococcus aureuscausing invasive infections in Europe: a molecular-epidemiological analysis. PLoS Med.7:e1000215. doi:10.1371/journal.pmed.1000215. 12. Grundmann H, Hori S, Tanner G.2001. Determining confidence
inter-vals when measuring genetic diversity and the discriminatory abilities of typing methods for microorganisms. J. Clin. Microbiol.39:4190 – 4192. 13. Hallin M, et al.2007. Validation of pulsed-field gel electrophoresis and
spatyping for long-term, nationwide epidemiological surveillance studies ofStaphylococcus aureusinfections. J. Clin. Microbiol.45:127–133.
14. Harmsen D, et al.2003. Typing of methicillin-resistantStaphylococcus aureusin a university hospital setting by using novel software forspa repeat determination and database management. J. Clin. Microbiol.41: 5442–5448.
15. Holmes A, et al.2010. Comparison of two multilocus variable-number tandem-repeat methods and pulsed-field gel electrophoresis for differen-tiating highly clonal methicillin-resistantStaphylococcus aureusisolates. J. Clin. Microbiol.48:3600 –3607.
16. Hunter PR, Gaston MA.1988. Numerical index of the discriminatory ability of typing systems: an application of Simpson’s index of diversity. J. Clin. Microbiol.26:2465–2466.
17. Karynski M, Sabat AJ, Empel J, Hryniewicz W.2008. Molecular surveil-lance of methicillin-resistantStaphylococcus aureusby multiple-locus able number tandem repeat fingerprinting (formerly multiple-locus vari-able number tandem repeat analysis) and spatyping in a hierarchic approach. Diagn. Microbiol. Infect. Dis.62:255–262.
18. Keim P, et al.2000. Multiple-locus variable-number tandem repeat anal-ysis reveals genetic relationships withinBacillus anthracis.J. Bacteriol.182: 2928 –2936.
19. Klevytska AM, et al.2001. Identification and characterization of variable-number tandem repeats in theYersinia pestisgenome. J. Clin. Microbiol. 39:3179 –3185.
20. Köck R, et al.2009. Cross-border comparison of the admission preva-lence and clonal structure of meticillin-resistantStaphylococcus aureus.J. Hosp. Infect.71:320 –326.
21. Luczak-Kadlubowska A, et al.2008. Usefulness of multiple-locus VNTR fingerprinting in detection of clonality of community- and hospital-acquiredStaphylococcus aureusisolates. Antonie Van Leeuwenhoek94: 543–553.
22. Malachowa N, et al.2005. Comparison of multiple-locus variable-number tandem-repeat analysis with pulsed-field gel electrophoresis, spa typing, and multilocus sequence typing for clonal characterization of Staphylococcus aureusisolates. J. Clin. Microbiol.43:3095–3100. 23. Sabat A, et al.2003. New method for typingStaphylococcus aureusstrains:
multiple-locus variable-number tandem repeat analysis of polymorphism and genetic relationships of clinical isolates. J. Clin. Microbiol.41:1801– 1804.
24. Sabat A, Malachowa N, Miedzobrodzki J, Hryniewicz W.2006. Com-parison of PCR-based methods for typingStaphylococcus aureusisolates. J. Clin. Microbiol.44:3804 –3807.
25. Schouls LM, et al.2009. Multiple-locus variable number tandem repeat analysis ofStaphylococcus aureus: comparison with pulsed-field gel elec-trophoresis and spa-typing. PLoS One 4:e5082. doi:10.1371/ journal.pone.0005082.
26. van Belkum A, et al.1997. Outbreak of amoxicillin-resistant Haemophi-lus influenzaetype b: variable number of tandem repeats as novel molec-ular markers. J. Clin. Microbiol.35:1517–1520.
Sabat et al.