M E T H O D
Open Access
scPred
: accurate supervised method for
cell-type classification from single-cell RNA-seq
data
Jose Alquicira-Hernandez
1,2*, Anuja Sathe
3,4, Hanlee P. Ji
3,4, Quan Nguyen
2and Joseph E. Powell
1,5*Abstract
Single-cell RNA sequencing has enabled the characterization of highly specific cell types in many tissues, as well as both primary and stem cell-derived cell lines. An important facet of these studies is the ability to identify the transcriptional signatures that define a cell type or state. In theory, this information can be used to classify an individual cell based on its transcriptional profile. Here, we presentscPred, a new generalizable method that is able to provide highly accurate classification of single cells, using a combination of unbiased feature selection from a reduced-dimension space, and machine-learning probability-based prediction method. We applyscPredto scRNA-seq data from pancreatic tissue, mononuclear cells, colorectal tumor biopsies, and circulating dendritic cells and show thatscPredis able to classify individual cells with high accuracy. The generalized method is available at https://github.com/powellgenomicslab/scPred/.
Introduction
Individual cells are the basic building blocks of organ-isms, and while a human consists of an estimated 30 tril-lion cells, each one of them is unique at a transcriptional level. Performing bulk or whole-tissue RNA sequencing, which combines the contents of millions of cells, masks most of the differences between cells as the resulting data comprises of the averaged signal from all cells. Single-cell RNA-sequencing (scRNA-seq) has emerged as a revolutionary technique, which can be used to iden-tify the unique transcriptomic profile of each cell. Using this information, we are now able to address questions that previously could not be answered, including the identification of new cell types [1–4], resolving the cellu-lar dynamics of developmental processes [5–8], and identify gene regulatory mechanisms that vary between cell subtypes [9]. Cell type identification and discovery of subtypes has emerged as one of the most important early applications of scRNA-seq [10]. Prior to the arrival of scRNA-seq, the traditional methods to classify cells were based on microscopy, histology, and pathological criteria [11]. In the field of immunology, cell surface
markers have been widely used to distinguish cell sub-types [12], for a wide range of purposes. While this ap-proach is desirable in practical terms for cell isolation, e.g., via fluorescence-activated cell sorting (FACS), these markers may not reflect the overall heterogeneity at a transcriptomic and phenotypic level from mixed cell populations [13, 14]. Unsupervised and supervised clus-tering approaches have been used to determine groups of cells based on similar transcriptional signatures within a sample [2,15,16], and frequently, cells within a cluster are collectively labeled based on the average expression levels of canonical markers [17]. The cluster-based clas-sification methods assume that all cells within a cluster are the same type and thus can be labeled collectively. This assumption is frequently wrong, with clusters often containing small percentages of multiple cell types in addition to a major cell type. A method that classifies each cell individually, without clustering first, solves these problems and should provide higher overall accur-acy in cell labeling. To be able to predict the classifica-tion of a single cell based upon its transcriptome read-out, first, a prediction model needs to be built where the effects of given features are estimated. It is clear that both the selection of features and estimation of their ef-fects play a critical role in the overall prediction
© The Author(s). 2019Open AccessThis article is distributed under the terms of the Creative Commons Attribution 4.0 International License (http://creativecommons.org/licenses/by/4.0/), which permits unrestricted use, distribution, and reproduction in any medium, provided you give appropriate credit to the original author(s) and the source, provide a link to the Creative Commons license, and indicate if changes were made. The Creative Commons Public Domain Dedication waiver (http://creativecommons.org/publicdomain/zero/1.0/) applies to the data made available in this article, unless otherwise stated.
* Correspondence:[email protected];[email protected] 1Garvan Institute of Medical Research, Darlinghurst, Sydney, Australia
performance. Unlike prediction methods that use data derived from bulk RNA-seq data where gene expression averages are used as features, phenotype prediction at single-cell level faces new challenges. Firstly, cell-to-cell differences must be considered to define and predict cell types. Using only a subset of genes (e.g., differentially expressed genes) will likely exclude discriminant sources of variation across cells. An additional limitation is the inconsistency seen between statistical methods used to identify differentially expressed genes [18]. Finally, if the number of observations that define a specific subtype of cells is high, then classification algorithms can be com-putationally expensive or suffer from overfitting. There are numerous applications for which prediction of a cell state or type from its scRNA-seq data can play an im-portant role. An obvious example is in the burgeoning use of single-cell data in characterizing disease states and underlying biology at single-cell resolution [12, 19]. The granular nature of single-cell characterization has enormous implications for the accurate prediction of specific cell subtypes and pathological-related states. We anticipate that such prediction strategies will play an im-portant role in the early diagnosis of diseases or inform-ing personalized treatment. Similarly, efforts arisinform-ing from the Human Cell Atlas [10] are set to create a com-prehensive reference atlas of most cell subtypes in the human body, meaning cells from new samples can be mapped against this reference. Here, we introduce
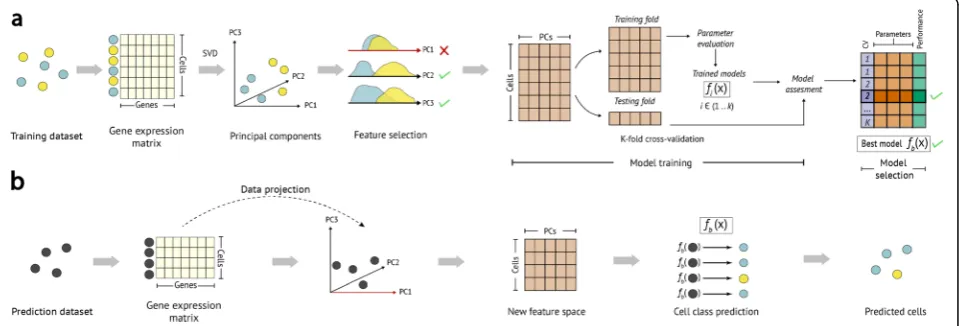
scPred, a method that takes advantage of dimensionality reduction and orthogonalization of gene expression values to accurately predict specific cell types or states
of single cells from their transcriptional data (see Fig.1).
scPredcan be applied to any situation where cells can be labeled into discrete categories, including cell subtypes or defined cell states.
Results
scPred is a generalized method for classifying a single cell based on its transcriptional data. The method uses a combination of decomposing the variance structure of a gene expression matrix to identify limited informative features, and a machine learning approach to estimate the effect of these features on classifying cells (Fig.1). In doing so, it is able to incorporate a large number of small differences in the mean and variance of gene ex-pression between different cell types in the prediction model. This removes the need to perform gene-specific analyses such as to identify informative features. scPred
has two main steps. Firstly, a prediction model is built using a training cohort of single-cell data, where the identity of the cells is already known. Secondly, the ap-plication of the prediction model to single-cell data ob-tained from independent sample, with each cell then assigned a conditional class probability (y = 1|f) of be-longing to a given cell subtype or state. scPred incorpo-rates a rejection option to avoid assigning cells to a class when the conditional class probability is lower than a given value. In the case of binary classification, this means that Pr(y = 1|f) and Pr(y = 0|f) should be higher than a probability threshold for a cell to be assigned to any class respectively. When the maximum probability across all classes is lower than the threshold, then a cell
[image:2.595.59.539.472.635.2]is labeled as“unassigned.”Sensitivity and specificity met-rics reported in this paper consider the “unassigned” label as incorrect. Therefore, computed probabilities for cells in the test dataset are below the threshold, all of them are labeled as unassigned, and the sensitivity and specificity are both equal to zero (see the“Methods” sec-tion). This criterion avoids misclassifying cells when some cell types are not considered in the prediction model but are present in the test data. For all analyses in this paper, we used a strict threshold of 0.9. This thresh-old can be changed in the software implementation. Here, we present the results of the application of scPred
under four distinct scenarios.
scPredcan accurately predict tumor epithelial cells from gastric cancer
We initially sought to demonstrate the performance of
scPred by making computational predictions of tumor and non-tumor cells based on their transcriptomes and validating our classification using a cell-specific inde-pendent immunohistochemistry assay targeting the MLH1 and PMS2 protein expression. We used this
information as an RNA-independent gold-standard to annotate the status of all cells. The loss of MLH1 pro-tein expression has been shown to be related to a hyper-mutable state of microsatellite instability which can be detected at single-cell resolution from the raw scRNA-seq data [20]. Along with the protein depletion con-firmed by the immunochemistry assay, we concon-firmed the loss of expression of MLH1 at the RNA level, as well as the upregulation of EPCAM and TFF3 in tumor cells, which are known to be overexpressed in cancer cells [21, 22] (see Additional file 1: Figure S1). Thus, we have a method for linking the observed scRNA-seq data to the immunohistochemistry-labeled classification for each cell. We obtained surgical biopsies from stage IIA intes-tinal gastric adenocarcinoma along with matched-normal epithelium from two patients and measure the protein expression of MLH1 and PMS2 to validate the presence of tumor cells. Then, we generated scRNA-seq data for four samples using the Chromium platform (10X Genomics). For the first pair of samples, we ob-tained 1905 epithelial cells based on the expression of EpCAM, and from these identified tumor cells based on
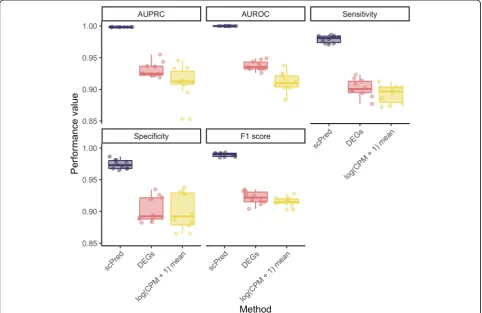
[image:3.595.57.540.370.683.2]the microsatellite stability, and trained a model to detect differences between tumor and non-tumor epithelial cells. Using cells from the second pair of samples, we then ap-plied this model to classify cells using just the scRNA-seq data. We then confirmed our predictions using the observa-tion of microsatellite instability. Overall, we obtained a sen-sitivity of 0.979 and specificity of 0.974 (AUROC = 0.999, AUPRC = 0.999, F1 score = 0.990) across the ten bootstrap replicates (Fig.2and Additional file2: Table S1). To dem-onstrate the increase in performance from using the
princi-pal components selected by scPred as features, we
compared the prediction performance ofscPredagainst five baselines. First, we fitted an SVM model usingscPredand used only the intercept of the hyperplane as a predictor to evaluate any bias in the predictor due to class proportions. We obtained sensitivity and specificity equal to zero (AUROC = 0.5 and AUPRC = 0) and thus show no bias when cell classification is attempted for unequal ratios of cells. Then, we evaluated the contribution of the inform-ative principal components by setting all the coefficients of the hyperplane to 1. We found that the sensitivity was 0 and the specificity 0.995 (AUROC = 0.496, AUPRC = 0.538, F1 = 0.000), which indicates that the predictors should be weighted to separate the cells accurately into tumor and non-tumor. To demonstrate the importance of the feature selection performed byscPred, we used all principal com-ponents as predictors to having a baseline of the expected classification from all data. We obtained sensitivity and spe-cificity equal to zero (AUROC = 0 and AUPRC = 0.398, F1 = 000), which implies that the informative principal components recover the cell-type informative variance from the entire data. To evaluate how the global cell composition can predict tumor status, we calculated the per-cell mean of the log2(CPM + 1) and trained a model using these values as a predictor. After performing the predictions on the test data, we obtained a sensitivity of 0.894 and specifi-city of 0.902 (AUROC = 0.912, AUPRC = 0.912, F1 = 0.916). The lower performance compared to the defaultscPred al-gorithm demonstrates using principal components for fea-ture selection capfea-tures variance in gene expression that cell-type specific. Finally, we calculated the differentially expressed genes between tumor and non-tumor cells to ob-tain a set of discriminant genes. We used these genes as features to train a model, and after the predictions, we ob-tained sensitivity and specificity of 0.903 and 0.909 respect-ively (AUROC = 0.937, AUPRC = 0.931, F1 = 0.922). For all analyses, we performed ten bootstrap replicates with the same data partitions used before. These results show that
scPredyields higher accuracy than our baseline models and outperforms predictions based on differentially expressed genes (see Fig.2and Additional file2: Table S1). Next, we investigated the effect of sequencing depth and the number of cells of a given cell type on the prediction performance ofscPred. First, we down-sampled the reads from each cell
in the training data by scaling the gene counts so that each cell had fewer than a fixedNnumber of reads. We evalu-ated a range of sequencing depths from an average of 5000 to 40,000 reads per cell to train the models and predicted the cell types from the test data. We repeated this process ten times using the same data partitions from previous ana-lyses. The sensitivity of the classification showed no changes across sequencing depths, while the specificity, AUROC, and AUPRC showed a considerable decrease once the average reads per cell are 20,000 (Additional file1: Fig-ure S2). Based on the cellranger output, we estimate that 20,000 reads per cell represent approximately 50% satur-ation of the library. We, therefore, recommend training models on cells that have been sequenced to high satur-ation. Finally, we assessed the impact of the cell population size in the prediction accuracy by performing bootstrap it-erations of classifying cells using a training model generated with between 100 and 900 randomly sampled tumor cells. We observed a small effect on the AUROC, AUPRC, F1 score, sensitivity, and specificity until the number of tumor cells included in the training model was less than 200. When only 100 cells were included (AUROC = 0.996, AUPRC = 0.996, F1 = 0.990), the mean sensitivity dropped down to 0.741 while the specificity changed from 0.974 to 0.885 with respect to the 953 cells used originally (see Add-itional file1: Figure S3). Collectively, these results show that
scPredcan accurately classify cells provided they are not a very rare type in the training data.
scPredcan accurately predict cell subtype using scRNA-seq data generated across different platforms
Given the rapid development of single-cell sequencing assays and technologies, we anticipate that a prediction model for a given cell subtype(s) will often be built with data generated from an alternative platform to that used for independent test samples. To assess the robustness of scPred, we sought to evaluate the performance using training data generated from multiple platforms and testing the prediction accuracy for independent cells se-quenced on another platform. We chose to develop a prediction model using scPredto classify subtypes of is-lets of Langerhans cells from scRNA-seq data generated from pancreas tissue due to their limited abundance (4.5% in a pancreatic tissue sample) [23], and thus will represent a class of cells that is expected to be more dif-ficult to predict based on their low relative existence compared to other cells. Islets of Langerhans are
com-posed mainly of four distinct cell types, namely α
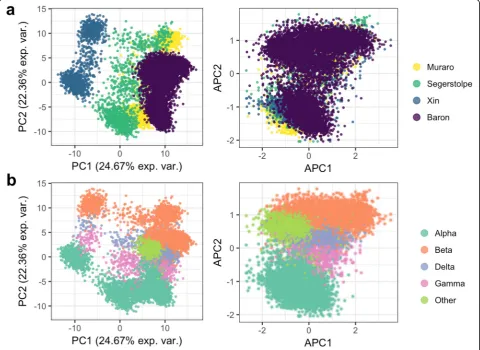
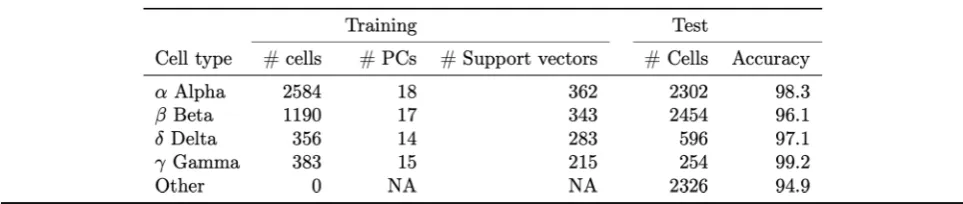
and Xin et al. [26] that had sequenced cells using CEL-seq2 [27], Smart-Seq2 [28], and SMARTer [29], respect-ively. Details of the training cohort data are given in Additional file2: Table S2. Importantly, using the Seurat alignment method [30], we are able to demonstrate that between platform and between sample batch effects can be removed for the training cohort (Fig.3). The best fit models fromscPredforα,β,δ, andγcells used between 14 and 18 PCs, which represents a small feature space for prediction in an independent data, and correspond-ingly will reduce the computational requirements of
scPred in the testing phase. Using the prediction classi-fier model trained from the aligned reference cohort data, we naively predicted the cell type of each of 7932 cells [31], collected from four healthy individuals, using their scRNA-seq data generated using inDrop [32]. The testing data includes a heterogeneous mix cell islets of Langerhans cells, meaning non-α, β,δ, andγcells, such as epsilon, endothelial, or T cells, provide a negative
control. We classified a cell as a specific cell subtype based on a class probability (Pr(y = 1|f)) greater than 0.9. The overall accuracy of the predictions was evaluated based on the known cell identities determined based on the expression of classic markers (GCG, INS, SST, and PPY). For islets of Langerhans cells, the prediction model built by scPred using the scRNA-seq data from the reference cohort was able to predict cell type with an average accuracy of 97.68% (Table 1 and Fig. 3) and accurately labeling 94.9% heterogeneous populations of other cells. For example, of the 2302 α cells in the test cohort, our scPred model classified 2264 cells correctly. Of the 38 misclassified cells, 33 were unassigned to an-other target cell type, which also demonstrates a high specificity of the model. We observed the same pattern for all cell types tested (Additional file 2: Table S3). To further support this conclusion, the mean Pr(y = 1|f) for cells classified asα,β,δ, andγwas 0.994–0.997, while cells classified as other (i.e., epsilon, endothelial, or T cells) had
[image:5.595.58.539.326.676.2]a mean Pr(y = 1|f)of 0.307 (Additional file 1: Figure S4). To evaluate the effect of the Seurat manifold alignment on data integration across platforms, we performed the sam-ple cell classifications using trained models developed using unaligned data. We observed a reduction of 31% in sensitivity and only 0.7% in specificity (see Additional file3: Table S4). Then, we compared the performance of other prediction models (k-nearest neighbors, elastic net, Naive Bayes, multivariate adaptive regression splines, random forests, and generalized linear model) to support vector machines. Overall, support vector machines with a radial kernel showed the highest accuracy for detecting cells from the islets of Langerhans while reducing the propor-tion of other cells being miss-classified (see Addipropor-tional file 2: Table S5). Together, these results show that support vector machines are ideal for classifying single cells from an informative feature eigenspace.
To further demonstrate the application of a scPred
model in multiple datasets, we trained a prediction model on the Baron data and assessed its prediction per-formance on the Muraro, Segerstolpe and Xin datasets. We obtained an average accuracy of 0.98, 0.92, 0.93, and 0.82 for alpha, beta, delta, and gamma cells respectively using the Baron dataset as reference only (see Additional file 2: Table S6). Finally, we compared the performance of scPred with scmap [33], CaSTLe [34], singleCellNet
[35], andscID [36] methods. Forscmap, we applied both cluster and cell projection algorithms to annotate cells based on their proximity to the reference dataset.Scmap
failed to identify all gamma cells using both algorithms and exhibited low performance classifying delta cells by yielding at most 14% of accuracy using the Baron dataset as reference (see Additional file 2: Tables S7 and S8). Likewise,CaSTLeexhibited an accuracy of zero for clas-sifying gamma cells in both Segerstolpe and Xin datasets and very poor accuracy to detect beta and delta cells (see Additional file 3: Table S9).singleCellMap suffered from very low accuracy for gamma cells with only 9% of
accuracy (see Additional file3: Table S10).scIDclassified gamma cells from the Segerstolpe and Xin datasets with high accuracy (96% and 94% respectively), however, it failed to classify 99% from the Muraro dataset (see Add-itional file3: Table S11). These results show that the fea-tures selected from the decomposed training data are able to define hyperplanes that are able to separate indi-vidual cells by cell type, based upon linear combinations of scRNA-seq data fitted to ascPredmodels.
Accurate prediction of peripheral blood mononuclear cells
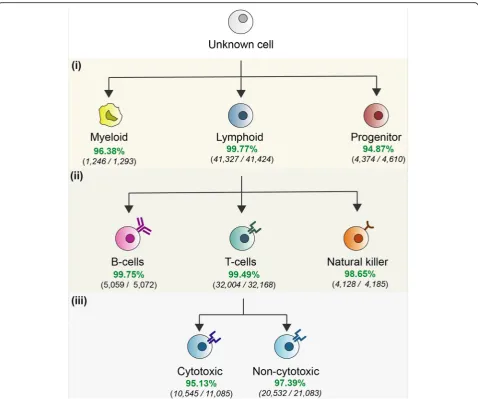
[image:6.595.56.538.166.268.2]Peripheral blood mononuclear cells (PBMCs) comprise di-verse groups of cells that are extensively studied because of their role in mediating adaptive and innate immune re-sponses as well as their implication in autoimmune, meta-bolic, and infectious diseases [37, 38]. Here, we aimed to classify PBMCs from which their cell identity was deter-mined based on fluorescence-activated cell sorting (FACS) [39]. For doing so, we developed a hierarchical tree-based prediction approach in which individual cells are classified along with categories following the hematopoietic lineage of PBMCs (see Fig.4). This strategy decomposes the prob-lem of predicting closely related cells by training models for cell types that are comparable in terms of their variance and hierarchic organization in the hematopoietic lineage. Firstly, a cell is classified as myeloid, lymphoid, or progeni-tor. Secondly, all cells predicted as lymphoid are further subcategorized into B cells, T cells, and Natural Killer. Fi-nally, the cytotoxic state of the predicted T cells is assigned. For each level in the hierarchy, ascPredmodel was trained. To verify the performance of this approach, we compared the cell type information derived from FACS versus the predictions made by scPredbased exclusively on the tran-scriptome. We performed ten bootstrap replicates to esti-mate to test the performance of our approach by splitting the 94,655 PBMCs into training and test groups. Overall, 97.67% of the cells from the test group (45, 884 out of 47,
328) were classified correctly (see Fig.4). Notably, the high-est and lowhigh-est accuracies obtained for a cell-type group were 99.7% and 95.13% for lymphoid cells and cytotoxic T cells respectively. Bootstrap 95% confidence intervals are re-ported in Additional file1: Table S12. These results demon-strate that scPred can accurately classify cells that share very similar transcriptional profiles.
Accurate prediction of human dendritic cells from data generated across laboratories
We next sought to evaluate the performance of scPred
when the training and testing cells sequenced using the same protocol but in different laboratories. For develop-ing sdevelop-ingle cell-based diagnostic tests, this is an important consideration, as in the majority of cases a predictive
model will be developed using sequence data generated from different laboratories to those conducting testing. Between-site effects could bias the predictive perform-ance of a test if the between-site batch effects are con-founded with the model classification features. While between-site variance for bulk-RNA-sequencing is small [40], it has not yet been fully evaluated for scRNA-Seq.
We chose to evaluate the performance of scPred by
building a prediction model to identify dendritic cells from peripheral blood samples [1]. Dendritic cells are antigen-presenting cells, and their main function is to process antigen material and present it on the cell sur-face to T cells, acting as messengers between the innate and adaptive immune systems. Using the cell type classi-fication based on scRNA-seq and flow validation given
[image:7.595.59.538.86.485.2]in Villani et al. [1], we built a scPred prediction model using scRNA-seq data generated using the SMART-seq2 protocol for 660 dendritic cells. The best fit model from
scPred used 11 PCs, which collectively explained 5.97% of the variance in the entire training data cohort.
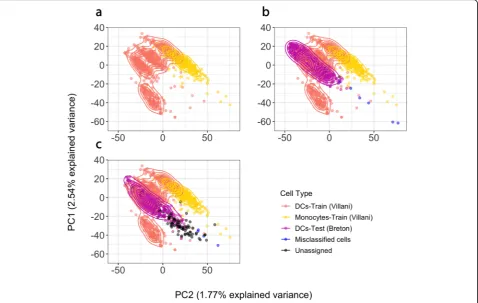
We then applied our model to predict dendritic cells from two independent test data cohorts consist-ing of scRNA-seq data from a heterogeneous mix of cells from peripheral blood (461 cells) and umbilical cord (420 cells), also generated using the SMART-Seq2 protocol in a different laboratory [41]. Notably, the accuracy for peripheral blood-derived cells was 98% (Table 2, Fig. 5 and Additional file 2: Table S13). When we applied the scPred model to the cells obtained from an umbilical cord, the overall accur-acy was 82%. This lower prediction accuraccur-acy possibly reflects a contamination or incorrect original classifi-cation of cells obtained from the umbilical cord. To evaluate this, we looked for differentially expressed genes between the 60 cells with a dendritic cell class probability of < 0.9 and the remaining cord cells (see Additional file 3: Table S14). We identified upregula-tion of genes overlapping the T cell receptor gamma locus: TRGC2, TARP, and X06776 (a truncated mRNA from the TRG gamma gene). Additionally, an
over-representation of myeloid and
neutrophil-related biological processes for upregulated genes was identified in these cells (see Additional file 3: Table S15). All gene ontologies corresponded to myeloid cells, and the presence transcripts from a T cell specialized locus suggests the presence of T cells or alternatively greater heterogeneity in cord-derived cells. Collectively, these results demonstrate that
scPred is able to accurately predict cell classes using a model trained on data generated in a different la-boratory to the test data, without the need to normalize data between sites. This implies that any potential batch effects, or laboratory effects, are not
captured in the informative features used to develop the prediction model.
Accurate classification when cell types are imbalanced Primary tumors contain cells that are both tumor and non-tumor cells of varying types. However, importantly, tumor cells originate from the same cell subtypes of one or more of the original healthy cells in a tissue. Numer-ous methods exist for classifying (or diagnosing) a whole tissue biopsy as either cancerous or non-cancerous based on DNA genotyping [42], transcriptome profiling [43, 44], or histochemistry [45, 46]. Most of these methods work well, but are unable to accurately classify hetero-geneity at a cellular level, and do not work if the per-centage of tumor cells in a biopsy is small. We applied
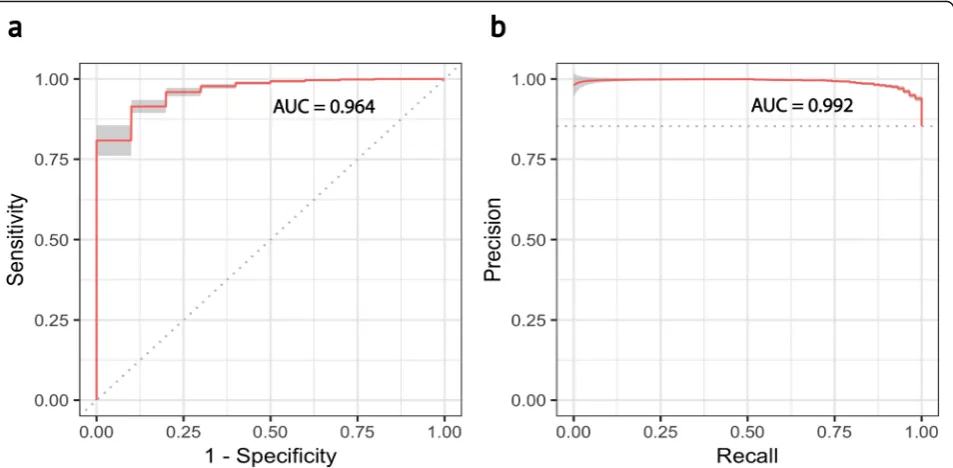
[image:8.595.56.539.629.732.2]scPredto predict epithelial tumor cells from a heteroge-neous population of cells from tumor- and normal mucosa-matched samples from 11 colorectal cancer pa-tients [47]. Of the 275 cells from colorectal cancer sam-ples, the imbalance in the proportions of colorectal cancer epithelial stem/TA-like cells compared to healthy controls was a 1:5 ratio of normal to tumor cells. The prediction accuracy was evaluated using a bootstrapping method, training on a randomly sampled 75% of the data and predicting on the remaining 25%, while correcting for class imbalance using the smote algorithm [48]. To estimate the variance of prediction accuracy, 50 boot-straps were performed, and the mean across replicates was calculated (see the “Methods” section). Overall, the mean area under the receiver-characteristic function was 96.4 with 95% confidence intervals of 95.5–97.2 (Fig.6a). Likewise, the mean precision-recall curve was 0.992 (95% confidence intervals of 0.989–0.995) (Fig. 6b). Given the imbalance in the proportions of colorectal can-cer, the high area under the precision-recall curve and small confidence intervals indicate thatscPredis robust to class imbalance in the training data. The high specificity of the model under this scenario implies that a single-cell
prediction method would be able to accurately diagnose disease status using scRNA-seq data from a limited num-ber of cells. For example, here, the mean sensitivity for tumor cells is 0.761 and the specificity is 0.958. Thus, if in a patient sample 100 cells were single-cell sequenced, the probability of incorrectly classifying 10 cells as a tumor cell from a healthy individual would be 6.3 × 10⁻⁷. Con-versely, once 10 cells are correctly classified tumor cells in a true tumor biopsy, the probability of accurately diagnos-ing the disease state is approximately 1.
Discussion
Single-cell RNA sequencing has provided the ability to analyze the transcriptomic profile of individual cells, leading to the identification of novel cell types and the characterization of heterogeneous cell populations. Here, we introducedscPred, a novel method to classify single cells based on singular value decomposition and a support vec-tor machine model.scPredtakes advantage of the
inform-ative signals spread across orthonormal linear
combinations of the gene expression values and minimizes the incorporation of noise to the prediction model by ex-cluding principal components with a low contribution to
the variance explained. scPred uses support vector ma-chines as a default machine learning approach as it is suit-able for large datasets and accounts for various sources of data [49]. Supervised machine learning methods have been used in previous studies to classify various cell types such as retinal bipolar cells [50] and embryonic stem cells [51]. Here, we have shown thatscPredshows high accuracy in a variety of relevant biological and clinical scenarios which include predicting pathological cell states from gastric and colorectal cancer as well as characterizing the cell-type composition of peripheral blood mononuclear cells. Col-lectively, our results show that scPredis able to accurately classify individual cells from an independent sample to those used to train the prediction model. However, the abil-ity to do so even when using a training cohort of cells whose scRNA-seq data is assayed from different platforms has important implications for a practical implementation ofscPred. The ability to build a single-cell training cohort using data generated from multiple platforms means that composite reference datasets can be generated, which will increase the predictive accuracy ofscPredthrough a more accurate estimate of the model effects. One of the advan-tages ofscPredis that by reducing the dimensions of the
[image:9.595.60.539.89.392.2]gene expression matrix via singular value decomposition we also decrease the number of features to be fit, reducing both the computational requirements for prediction and the prediction model parameter space. While we have used a support vector machine method, the scPred soft-ware can be easily adjusted to use other classification algo-rithms [52], allowing a user to choose the models that suit the effect distributions of their data best.
Methods
The scPred method is split into two major steps. First, a prediction model is built using a training dataset of scRNA-seq data. The second step is the application of this prediction model to scRNA-seq data obtained from inde-pendent sample, with each cell then assigned a probability of belonging to a given class based on the fit of its scRNA-seq expression levels in the prediction model. Below, we have outlined the methods for each of these steps. We start with a single-cell gene expression matrix CTrain (CPM values—count per million mapped reads) obtained from different characterization classes: for example, from different cell subtypes, cells obtained from disease versus control samples, or cells defined as different states.
Training step
The training expression matrix is log2-transformed log2(GTrain+1) to linearize the expression values for each
gene and stabilize the variance across a large expression range. Let GTrain be the log2-transformed expression matrixCTrainwithnsingle cells andmgenes:
GTrain¼
x11 x12 x13 ⋯ x1m
x21 x22 x23 ⋯ x2m
⋮ ⋮ ⋮ ⋱ ⋮
xn1 xn2 xn3 ⋯ xnm 2
6 6 4
3 7 7 5
We subsequently center and scale GTrain using the mean and standard deviation of gene expression values of each gene, calculated using the following formulas:
μ¼1 n
Xn
i¼1
x1 σ¼
ffiffiffiffiffiffiffiffiffiffiffiffiffiffiffiffiffiffiffiffiffiffiffiffiffiffiffiffiffiffiffi 1
n−1 Xn
i¼1
xi−μ
ð Þ2
s
Each mean is subtracted from allmth elements of their
corresponding nth row, and the result is divided by the
respective standard deviation as follows:
M¼
ðx11−μ1Þ=σ1 ðx12−μ2Þ=σ2 ðx13−μ3Þ=σ3 ⋯ ðx1m−μmÞ=σm
ðx21−μ1Þ=σ1 ðx22−μ2Þ=σ2 ðx23−μ3Þ=σ3 ⋯ ðx2m−μmÞ=σm
⋮ ⋮ ⋮ ⋱ ⋮
ðxn1−μ1Þ=σ1 ðxn2−μ2Þ=σ2 ðxn3−μ3Þ=σ3 ⋮ ðxnm−μmÞ=σm
2 6 6 6 6 4
3 7 7 7 7 5
We next calculate orthogonal vectors for the gene ex-pression values using a singular value decomposition
[image:10.595.61.538.88.322.2](SVD) method. To do so, the matrix Mneeds to be fac-torized into the product of three matrices as follows:
M¼UXVT
whereU andV are orthonormal matrices andΣa diag-onal matrix.
First, we compute the product MMT. To find U, we orthogonally diagonalizeMMT.
MMT¼UXVTVXTUT¼UX XTUT¼UDU−1
Then,Ucontains the eigenvectors ofMMT(or left sin-gular vectors ofM) andDits eigenvalues.
U¼
c11 ⋯ c1n
⋮ ⋱ ⋯
c1n ⋯ cnn 2
4
3 5
Similarly, to calculateV, we compute the productMTM
and diagonalize MTM to calculate its eigenvectors and eigenvalues.
MTM¼VXTUTUXVT¼VXTXVT¼VDV−1
V contains the eigenvectors of MTM (or right singular vectors ofM) andDits eigenvalues.
V¼ v11⋮ ⋯⋱ v1⋮m v1m ⋯ vmm 2
4
3 5
Σis a diagonal matrix with the squared root eigenvalues ofMTM(or singular values ofM) along the diagonal.
X
¼ s11 ⋱
snm
2 4
3 5
The matrix product UΣ gives the principal
compo-nents (PCs) or “scores”, which are a new set of un-correlated linear variables that capture the maximum variance from the single-cell expression matrix M. The individual squared values of the diagonal entries of Σ divided by the sum of all squared values give the variance explained by each principal component. PCs are in descending order according to the variance each of them explains.
S¼UX
We next identify the PCs whose scores have signifi-cant differences between the classification cell classes. We initially create a subspace of S (namely R with n
rows and r columns -dimensions-), such that each
dimension explains at least 0.01% of the variance of the matrix M. However, it is important to note that at this stage, we do not select features to fit in a pre-diction model. To identify the informative dimensions, a two-tailed Wilcoxon rank-sum test is performed for each PC to assess whether there is a significant differ-ence in the distributions of PC scores for cells in dif-ferent classes. The resulting p values are adjusted for multiple testing using a Benjamini-Hochberg false dis-covery rate correction. Columns from R are ranked in
ascending order based on their corresponding p
values. This step allows us to identify PCs with the largest difference in their distributions of the scores between the classes, and thus is expected to be the most informative as features used as input predictors in a classification model.
From R, we create a subspace F with only f
col-umns with associated adjusted p values less than
0.05. The columns of F are used as features to train a support vector machine model with a radial kernel. A support vector classifier consists of a subspace (called hyperplane) of dimension h-1 with regard to
its ambient high dimensional space H with h
dimen-sions, which linearly separates the observations
(cells) according to the class they belong to. A mar-gin around the hyperplane is defined in order to minimize the misclassifications. The width of the margin is determined by observations called support vectors. Here, we find a hyperplane that separates single cells based on their PC scores into the classi-fication classes. Those cells that define the margin
can be thought of as supporting cells of the
hyperplane.
When the observations cannot be separated in the fea-ture space using a linear boundary, a“kernel trick”is used to map observations into a high-dimensional space where they can be linearly separated by a hyperplane. LetΦbe a function that maps single cells from aFspace off dimen-sions to a higher dimensional spaceH.
Φ: F→H
Andk(x,x1) be a kernel function that returns the inner product of the images of two cells (based on the values of thefprincipal components inF).
k(x,x1) =〈Φ(x),Φ(xi)〉
However, instead of computing a feature mapΦfor all observations, the following shortcut is possible using a Gaussian radial basis kernel [53]:
Φð Þx;Φð Þxi
h i ¼ exp−σ∥x−x1∥2
where σ is a constant greater than zero estimated via cross-validation. Thus, Eq. (7) can be rewritten as:
k xð ;xiÞ ¼ exp −σ∥x−xi∥2
Hence, the coordinates of the cells in H are not
computed.
Then, we can define a functionf(x) that returns a deci-sion value which indicates whether a cell belongs to a class or the other using the kernel function.
f xð Þ ¼X
n
i¼1
αik xð ;xiÞ
αi parameters are estimated by solving the following minimization problem:
t wð ;ξÞ ¼1
2∥w∥
2þC
n
Xn
i¼1
ξi
subject to
∀i∈f1;…;ng yiðhxi;wi þbÞ≥1−ξi
ξi≥0
And being the hyperplane defined by the following set:
x∈Hjhw;xi þb¼0
f g
wis a weight vector in the feature spaceNperpendicular to the hyperplane which helps to define the margin,ξis a slack variable that allows each cell to be on the wrong side of the hyperplane or the margin in order to deal with outliers, nis the number of observations (cells), yi
is a variable that indicates whether the cell xibelongs to
one class (y = 1) or the other (y=−1), and C is a cost parameter that penalizes the sum of ξi . AsCincreases,
the margin becomes wider and more tolerant of viola-tions by cells. By enlarging the feature space using a polynomial kernel, the cells are linearly separated in H
[54]. To train the model, we determine the costCandσ parameters via cross-validation and select the values that maximize the prediction performance. Finally, class probabilities are calculated using a sigmoid function fit-ted on the decision values returned by the classifierf(x) [53].
Prðy¼1jfÞ ¼ 1
1þeAfþB
The final trained model consists of a set of parameters that maximizes the margin between the training
observations and the hyperplane in order to separate sin-gle cells according to their classification class. K-fold cross-validation is performed as described in the caret
package [52]. If the number of classes is more than two for the response variable, then n binary classification models are trained. For each classification model, we categorized all cells into two classes depending on the class being studied:positive class(cell type(s) of interest) andnegative class(remaining cell types),“one-versus-all” approach.
Prediction step
Once the model has been trained and evaluated, it can be used to classify single cells from an independent data-set from which the cell classes are unknown. Here, we apply the trained model(s) to classify cells from a testing dataset.
Given a test expression matrixCTestwithnsingle cells as rows and mgenes as columns, let GTest be the log2-transformed expression matrixCTest:
GTest¼
x11 x12 x13 ⋯ x1m
x21 x22 x23 ⋯ x2m
⋮ ⋮ ⋮ ⋱ ⋮
xn1 xn2 xn3 ⋯ xnm 2
6 6 4
3 7 7 5
The matrix is centered and scaled using the means and variances calculated fromGTrain:
MTest¼
x11−μ1
ð Þ=σ1 ðx12−μ2Þ=σ2 ðx13−μ3Þ=σ3 ⋯ ðx1m−μmÞ=σm
x21−μ1
ð Þ=σ1 ðx22−μ2Þ=σ2 ðx23−μ3Þ=σ3 ⋯ ðx2m−μmÞ=σm
⋮ ⋮ ⋮ ⋱ ⋮
xn1−μ1
ð Þ=σ1 ðxn2−μ2Þ=σ2 ðxn3−μ3Þ=σ3 ⋯ ðxnm−μmÞ=σm 2
6 6 4
3 7 7 5
andMTestis projected onto the training PCA coordinate
basis using the rotation matrixVafter log2-transforming and scaling the data according to the training feature space:
P¼MtestV
P contains the projection of the single cells from test dataset onto the PCs from the training data. Informative PCs listed in the Rtraining subspace are extracted from
Rand used as features to predict the classification clas-ses of the cells from the test dataset using the trained support vector machine model (see Fig.1).
If more than two models were trained, all cells in P
Predicting cell type from scRNA-seq data usingscPred OurscPredmethod provides a generalized framework to classify a given cell based on its gene expression values. Importantly, our method is designed to solve the prob-lem of individual gene feature selection and enable sub-tle effects spread across many genes to be utilized through orthogonal components of variance. In doing so, we anticipate an increase in the prediction perform-ance over current gene-centric feature selection, as
scPred will incorporate the small effects of many genes. To demonstrate both the utility and performance of
scPred, we first validated the performance against an or-thogonal molecular assay and then addressed three dis-tinct biological examples of classification of single cells: firstly, by predicting specificα, β, δ, and γ cell subtypes from pancreas islets of Langerhans; secondly, classifying dendritic cells using a heterogeneous mix of single cells as a reference; and finally, identifying the presence of cancer cells from a heterogeneous composition of cells from whole tissue in both tumors and matched healthy controls. For all datasets, we removed all cells above or below 3 median absolute deviations (MAD) from the median library size, mitochondrial, and ribosomal gene expression. Furthermore, all genes with zero counts across all cells and genes not expressed in at least 1% of the whole population were discarded. Finally, all count matrices were transformed to CPM values, and genes being expressed more than five CPM were preserved.
scPredpredicts cells using a default probability threshold of 0.9 to ensure high confidence in the classification. All cells below this threshold for each cell type are labeled as unassigned. Here, we define sensitivity as the propor-tion of cells that were correctly classified for the cell type of interest, based on the default threshold with respect to the remaining cells that do not belong to this cell type (i.e., number of cells correctly classified from the positive class/(cells correctly classified from the negative class + unassigned cells that belong to the positive class). Like-wise, specificity is the proportion of the cells from the negative class that were correctly classified with respect to the remaining cells from that class and the unassigned cells that belong to the negative class). Therefore, for the case of binary classification, sensitivity and specificity can both be zero if all cells from the positive and nega-tive classes had a probability lower than 0.9 for each class respectively. The area under the AUROC and AUPRC were determined using the MLmetrics R
pack-age from CRAN
https://cran.r-project.org/web/pack-ages/MLmetrics/index.html.
Gastric cancer tumor versus non-tumor prediction The collection of this data was conducted in compliance with the Helsinki Declaration. The institutional review board at Stanford University School of Medicine
approved the study protocol (19071), and informed con-sent was obtained. We collected two matched sets of two samples including gastric primary cancer, and nor-mal stomach tissue. Tissue biopsies were obtained from surgical resection of a primary gastric adenocarcinoma and matched adjacent normal tissue. Immediately 10 min after resection, the tumor sample was stored in RPMI medium on ice for less than 1 h. The samples were then microdissected and dissociated into a cellular suspension by the gentleMACS Octo Dissociator as per the manufacturer’s recommendations and the 37C_h_ TDK_3 program (Miltenyi Biotec, Bergisch Gladbach, Germany). Single-cell RNA-seq was performed after thawing cryopreserved sample stored in liquid nitrogen in DMSO. Histopathology of this gastric cancer revealed moderate to poorly differentiated features with a 60– 70% tumor fraction. Immunohistochemistry demon-strated a loss of MLH1 and PMS2 expression. The loss of these proteins indicated that this tumor had microsat-ellite instability (MSI) where cancer cells have a hyper-mutable state because of loss of DNA mismatch repair. The tumor tissue was disaggregated into a single-cell suspension and analyzed scRNA-seq. We used the Chro-mium Controller instrument (10X Genomics Inc., Pleas-anton, CA) and the Single Cell 3′ Reagent kit (v2) to prepare individually barcoded scRNA-seq libraries fol-lowing the manufacturer’s standard protocol. Briefly, single-cell suspensions were loaded on a Chromium and were partitioned in droplets. Reverse transcription is performed, followed by droplet breaking, and cDNA amplification. Each cDNA molecule thus contained the read 1 sequencing primer, a 16-bp cell-identifying bar-code, and a 10-bp UMI sequence. We performed enzym-atic fragmentation, end-repair, and A-tailing followed by ligation of a single-end adapter containing the read 2 priming site. Finally, sequencing libraries were quantified by qPCR before sequencing using 26 × 98 paired-end reads. The Cellranger software suite was used to process scRNA-seq data, sample demultiplexing, barcode pro-cessing, and single-cell 3′gene counting. Cellranger pro-vided a gene-by-cell matrix, which contains the read count distribution of each gene for each cell. The gene expression matrix was split according to the disease sta-tus of each cell (defined by the presence of microsatellite instability) to create a training dataset. We selected only class informative PCs explaining at least 0.01% of the variance and using an adjusted alpha threshold of 0.05. Tenfold cross-validations were performed to train a sup-port vector machine model with a radial kernel. The trained model was applied to independent cells to evalu-ate classification accuracy. To train two of the baseline models using SVM, we set all the coefficients of the hy-perplane to 0 and 1 respectively. We trained a model
performance of the feature selection ofscPred. Differen-tially gene expression analysis was performed using edgeR [55] to obtain discriminant genes between tumor and non-tumor cells to be used as predictors. Ten boot-strap replicates were performed for all baseline models using the same dataset partitions from the main predic-tion analysis usingscPred.
Prediction of islets of Langerhans subtypes
We considered three independent datasets to train a prediction model to classifyα(alpha),β(beta),δ(delta), and γ(gamma) cell subtypes: Muraro et al. [25] consist-ing of 1522 cells from a CEL-Seq2 protocol, Segerstolpe et al. [3] consisting of scRNA-seq data from 1321 cells generated using the Smart-Seq2 protocol, and 1349 cells from Xin et al. [26] whose gene expression levels were assayed using the SMARTer protocol (see Additional file 2: Table S1). We integrated the three datasets using the intersection of genes between them and obtained a sin-gle aggregated matrix. We applied the Seurat alignment approach [30] to account for technical differences across the different datasets used for the training dataset. First, we determined the most variable genes (528) in at least two of the three datasets to compute the loadings and the first 30 PCs using the implicitly restarted Lanczos bidiagonalization algorithm [56]. Then, we used the loadings from the training eigendecomposition to project the testing dataset (Baron et al.) and obtained the cell embeddings. After the alignment, no batch effect was observed (see Fig. 3). Then, we trained a prediction model considering only class-informative PCs using a multiple testing corrected alpha level of 0.05 using (see
scPred in the “Methods” section) using the scores from the aligned training eigenspace only. Tenfold cross-validations were performed to train a support vector ma-chine model with a radial kernel. To assess the perform-ance of our prediction model, we predicted the specific cell types of 7932 cells using their scRNA-seq data gen-erated using the inDrop protocol [31]. In addition to our main analysis, we trained a prediction model using the Baron dataset only as a training reference and applied the model to classify cells from the Muraro, Segerstolpe, and Xin datasets respectively using the same method-ology described above. We then compared the
predic-tion performance of scmap [33], caSTLe [34],
singleCellNet[35], andscID [36] following the same ap-proach. To train the classifiers usingscmap, we used 500 genes as features. Cluster and cell projections were per-formed using both algorithms. For thecaSTLecell classi-fication, we reproduced the pipeline code from https://
github.com/yuvallb/CaSTLe using the Baron data as
source dataset and the Muraro, Segerstolpe, and Xin as the target dataset. Code for singleCellNet and scID was
obtained fromhttps://github.com/pcahan1/singleCellNet
andhttps://github.com/BatadaLab/scIDrespectively.
Prediction of peripheral blood mononuclear cells
We used the dataset obtained by Zheng et al. [39] to train and test prediction models to deconvolute the cell-type identity of peripheral blood mononuclear cells. We defined three layers of prediction based on the hierarchy of PBMCs in the hematopoietic lineage and trained a
scPredmodel for each of them using a training partition from the dataset. Then, every single cell from the test fold was classified as follows: the first model classifies the cell as myeloid, lymphoid, or blood progenitor based on a feature eigenspace including all these cells. Further-more, all cells classified as lymphoid are subcategorized into B cell, T cell, or Natural Killer using a second classi-fier trained to distinguish between these classes. Finally, predicted T cells are subclassified into cytotoxic and non-cytotoxic. Ten bootstrap replicates were performed to calculate a 95% confidence interval of the accuracies for every cell type.
Prediction of dendritic cells: training data of dendritic cells and monocytes
scRNA-seq data was obtained using a Smart-Seq2 proto-col [1]. After quality control, 660 dendritic cells and 335 monocytes were used to train a prediction model apply-ing a 0.01% variance-explained filter and a corrected alpha level of 0.05 to select the informative PCs. Tenfold cross-validations were performed to train a support vec-tor machine model with a radial kernel. We tested the
scPred prediction model against dendritic cells from an independent study [41], whose scRNA-seq data had been generated using the SMART-Seq 2 protocol. After qual-ity control, 150 primary human conventional dendritic cells (cDCs), 420 cord blood pre-cDCs, and 311 blood pre-cDCs were kept. The final training model consisted of only 11 discriminant PCs explaining 5.97% of the vari-ance from the Villani et al. dataset. The training error of the model was 0.018, and 232 cells were used as support vectors. Differential expression analysis between the un-assigned cells and remaining cells from cord blood was performed using edgeR [55]. Genes with a log fold-change greater or lower than 2 and an adjusted pvalue
less than 0.05 were considered as differentially
expressed. Gene ontology analysis was performed using http://pantherdb.org/.
Prediction of colorectal cancer cells
expression matrix was split according to the sample ori-gin of each cell (tumor or normal) to create a training and testing dataset such that the former partition con-tained 75% of cells and the latter 25%. To create the par-titions, we used the SMOTE algorithm [48] to account for class imbalance. We selected only class-informative PCs explaining at least 0.01% of the variance and using an adjusted alpha threshold of 0.05. Tenfold cross-validations were performed to train a support vector ma-chine model with a radial kernel. Finally, we obtained the areas under the ROC and precision-recall curves to measure the performance ofscPred. Ten bootstrap repli-cates were performed.
Supplementary information
Supplementary informationaccompanies this paper athttps://doi.org/10. 1186/s13059-019-1862-5.
Additional file 1: Figure S1.Expression of EPCAM, MLH1, and TFF3.
Figure S2.Effect of the sequencing depth on prediction performance of gastric tumour cells.Figure S3.Effect of the number of cells on prediction performance of gastric tumour cells.Figure S4.Distribution of conditional class probabilities for single cells from the Baron test dataset across all four models.
Additional file 2: Table S1.Classification performance comparison between scPred and other prediction baseline methods. For all methods, results are reported using the same data set partitions across all bootstrap replicates.Table S2.Summary of pancreas datasets. Training dataset consisted of 4292 cells and 32 human samples in total.Table S3.
Prediction results of pancreatic cells from Baron dataset.Table S5.
Prediction performance of pancreatic cells from Baron et al. dataset using different prediction models described in Table S1.Table S12. Accuracy performance for all PBMC subtypes. Percentile 95% confidence intervals are shown for ten boostrap replicates.Table S13.Prediction of dendritic cells from Breton et al. dataset using different prediction models.
Additional file 3: Table S4.Prediction results of pancreatic cells without Seurat alignment.Table S6.Prediction results using Baron dataset as reference.Table S7.Classification performance of scmap-cluster using the Baron dataset as training.Table S8.Classification per-formance of scmap-cell using the Baron dataset as training.Table S9.
Classification performance of caSTLe using the Baron dataset as training.
Table S10.Classification performance of singleCellNet using the Baron dataset as training.Table S11.Classification performance of scID using the Baron dataset as training.Table S14. Differentially expressed genes between unassigned cells by scPred and remaining cord blood-derived cells.Table S15. Gene ontology overrepresentation results of overex-pressed genes from unassigned cells.
Peer review information
Barbara Cheifet was the primary editor on this article and managed its editorial process and peer review in collaboration with the rest of the editorial team.
Authors’contributions
JAH and JEP developed thescPredmethod. JEP, QN, and JAH designed the statistical framework ofscPred. AS and HPJ obtained, processed, and sequenced the gastric cancer samples from clinical patients. JEP and JAH conceived the idea of the project. All authors read and approved the final manuscript.
Funding
JAH is supported by the University of Queensland under a Research Training Program and a UQ Research Training scholarships. JEP is supported by National Health and Medical Research Council Fellowship (APP1107599). This work was supported by National Health and Medical Research Council
project grant (APP1143163) and Australian Research Council Discovery project (DP180101405).
Availability of data and materials
scPredis implemented in R as a package based on S4 objects. ThescPred
class allows the eigen decomposition, feature selection, training, and prediction steps in a straightforward and user-friendly fashion.scPred sup-ports any classification method available from the caret package [52]. The de-fault model inscPredis the support vector machine with a radial kernel. The choice of this method is based on its superior performance when compared to alternative machine learning methods (Additional file2: Table S5 and S13). However, it is important to note that the best model will be the one that models the distribution of true effects of the fitted PCs best. Therefore, we anticipate certain scenarios where alternative classification methods should be selected instead of the support vector machine. ThescPredobject con-tains slots to store the eigen decomposition, informative features selected, and trained models, meaning models can be applied without re-computing the initial training step. The package also includes functions for exploratory data analysis, feature selection, and graphical interpretation. All analyses were run in a personal computer with 16-GB RAM memory and a 2.5-GHz Intel Core i7 processor.
scPredis available from Github athttps://github.com/powellgenomicslab/ scPred[57] under the MIT license and on zenodo at doi:10.5281/ zenodo.3391594 [58].
Generated data for prediction of tumor cells from gastric cancer may be found in [59]. Data used for prediction of pancreatic cells may be found in GEO (GSE85241, GSE81608, GSE84133) and ArrayExpress (E-MTAB-5061) [60– 63]. Data used for prediction of peripheral blood mononuclear cells may be found from 10X Genomics [64]. Data used for prediction of dendritic cells and monocytes may be found in the Single Cell Portal and GEO (GSE89232) [65,66]. Data used for prediction of colorectal cancer cells may be found in GEO (GSE81861) [67].
Ethics approval and consent to participate
Not applicable.
Competing interests
The authors declare that they have no competing interests.
Author details
1
Garvan Institute of Medical Research, Darlinghurst, Sydney, Australia. 2Institute for Molecular Bioscience, University of Queensland, Brisbane,
Australia.3Division of Oncology, Department of Medicine, Stanford University School of Medicine, Stanford, USA.4Stanford Genome Technology Center, Stanford University, Palo Alto, USA.5Faculty of Medicine, University of New South Wales, Darlinghurst, Sydney, Australia.
Received: 7 May 2019 Accepted: 16 October 2019
References
1. Villani A-C, Satija R, Reynolds G, Sarkizova S, Shekhar K, Fletcher J, Griesbeck M, Butler A, Zheng S, Lazo S, Jardine L, Dixon D, Stephenson E, Nilsson E, Grundberg I, McDonald D, Filby A, Li W, De Jager P, Rozenblatt-Rosen O, Lane A, Haniffa M, Regev A, Hacohen N. Single-cell RNA-seq reveals new types of human blood dendritic cells, monocytes, and progenitors. Science. 2017;356.
2. Grün D, Lyubimova A, Kester L, Wiebrands K, Basak O, Sasaki N, Clevers H, van Oudenaarden A. Single-cell messenger RNA sequencing reveals rare intestinal cell types. Nature. 2015;525:251–5.
3. Segerstolpe Å, Palasantza A, Eliasson P, Andersson EM, AndrÃc asson AC, Sun X, Picelli S, Sabirsh A, Clausen M, Bjursell MK, Smith D, Kasper M, Ämmälä C, Sandberg R. Single-cell transcriptome profiling of human pancreatic islets in health and type 2 diabetes. Cell Metab. 2016;24:593–607. 4. Treutlein B, Brownfield DG, Wu AR, Neff NF, Mantalas GL, Espinoza FH, Desai TJ, Krasnow MA, Quake SR. Reconstructing lineage hierarchies of the distal lung epithelium using single-cell RNA-seq. Nature. 2014;509:371–5. 5. Li L, Dong J, Yan L, Yong J, Liu X, Hu Y, Fan X, Wu X, Guo H, Wang X, Zhu X,
6. Petropoulos S, Edsgärd D, Reinius B, Deng Q, Panula SP, Codeluppi S, Reyes AP, Linnarsson S, Sandberg R, Lanner F. Single-cell RNA-seq reveals lineage and x chromosome dynamics in human preimplantation embryos. Cell. 2016;167:285.
7. Rizvi AH, Camara PG, Kandror EK, Roberts TJ, Schieren I, Maniatis T, Rabadan R. Single-cell topological RNA-seq analysis reveals insights into cellular differentiation and development. Nature Biotechnol. 2017;35:551–60. 8. TreutleinB, Lee QY, Camp JG, Mall M, Koh W, Shariati SAM, Sim S, Neff NF,
Skotheim JM, Wernig M, Quake SR. Dissecting direct reprogramming from fibroblast to neuron using single-cell RNA-seq. Nature. 2016;534:391–5. 9. Jaitin DA, Weiner A, Yofe I, Lara-Astiaso D, Keren-Shaul H, David E, Salame
TM, Tanay A, van Oudenaarden A, Amit I. Dissecting immune circuits by linking crispr pooled screens with single-cell rna-seq. Cell. 2016;167:1883–96 e15.
10. Regev A, Teichmann SA, Lander ES, Amit I, Benoist C, Birney E, Bodenmiller B, Campbell P, Carninci P, Clatworthy M, Clevers H, Deplancke B, Dunham I, Eberwine J, Eils R, Enard W, Farmer A, Fugger L, Göttgens B, Hacohen N, Haniffa M, Hemberg M, Kim S, Klenerman P, Kriegstein A, Lein E, Linnarsson S, Lundberg E, Lundeberg J, Majumder P, Marioni JC, Merad M, Mhlanga M, Nawijn M, Netea M, Nolan G, Pe’er D, Phillipakis A, Ponting CP, Quake S, Reik W, Rozenblatt-Rosen O, Sanes J, Satija R, Schumacher TN, Shalek A, Shapiro E, Sharma P, Shin JW, Stegle O, Stratton M, Stubbington MJT, Theis FJ, Uhlen M, van Oudenaarden A, Wagner A, Watt F, Weissman J, Wold B, Xavier R, Yosef N. The human cell atlas. eLife. 2017;15.
11. Arendt D, Musser JM, Baker CVH, Bergman A, Cepko C, Erwin DH, Pavlicev M, Schlosser G, Widder S, Laubichler MD, Wagner GP. The origin and evolution of cell types. Nat Rev Genet. 2016;17:744–57.
12. Papalexi E, Satija R. Single-cell RNA sequencing to explore immune cell heterogeneity. Nat Rev Immunol. 2017;18:35–45.
13. Grün D, Vanoudenaarden A. Design and analysis of single-cell sequencing experiments. Cell. 2015;163:799–810.
14. Trapnell C. Defining cell types and states with single-cell genomics. (report). Cold Spring Harbor Laboratory Press. 2015;25:1491–8.
15. Macosko E, Basu A, Satija R, Nemesh J, Shekhar K, Goldman M, Tirosh I, Bialas A, Kamitaki N, Martersteck E, Trombetta J, Weitz D, Sanes J, Shalek A, Regev A, Mccarroll S. Highly parallel genome-wide expression profiling of individual cells using nanoliter droplets. Cell. 2015;161:1202–14. 16. Kiselev VY, Kirschner K, Schaub MT, Andrews T, Yiu A, Chandra T, Natarajan
KN, Reik W, Barahona M, Green AR, Hemberg M. SC3: consensus clustering of single-cell RNA-seq data. Nat Methods. 2017;14:483–6.
17. Stegle O, Teichmann SA, Marioni JC. Computational and analytical challenges in single-cell transcriptomics. Nat Rev Genet. 2015;16:133-45. 18. Molin AD, Baruzzo G, Camillo BD. Single-cell RNA-sequencing: Assessment
of differential expression analysis methods. Front Genet. 2017;9(62):50-60. 19. A. K. Shalek and M. Benson,“Single-cell analyses to tailor treatments,”Sci
Transl Med 2017; 9 408.
20. Andor N, Lau BT, Catalanotti C, Kumar V, Sathe A, Belhocine K, Wheeler TD, Price AD, Song M, Stafford D, Bent Z, DeMare L, Hepler L, Jett S, Lin BK, Maheshwari S, Makarewicz AJ, Rahimi M, Sawhney SS, Sauzade M, Shuga J, Sullivan-Bibee K, Weinstein A, Yang W, Yin Y, Kubit MA, Chen J, Grimes SM, Suarez CJ, Poultsides GA, Schnall-Levin M, Bharadwaj R, Ji HP. Joint single-cell DNA-seq and RNA-seq of gastric cancer reveals subclonal signatures of genomic instability and gene expression; 2018.
21. Taniguchi Y, Kurokawa Y, Takahashi T, Mikami J, Miyazaki Y, Tanaka K, Makino T. Prognostic value of trefoil factor 3 expression in patients with gastric cancer. (report). World J Surg. 2018;42(12):3997.
22. Wenqi D, Li W, Shanshan C, Bei C, Yafei Z, Feihu B, Jie L, Daiming F. Epcam is overexpressed in gastric cancer and its downregulation suppresses proliferation of gastric cancer. J Cancer Res Clin Oncol. 2009;135(9):1277–85. 23. C. Ionescu-Tirgoviste, P. A. Gagniuc, E. Gubceac, L. Mardare, I. Popescu, S.
Dima, and M. Militaru,“A 3D map of the islet routes throughout the healthy human pancreas,”Scientific Reports 2015; 5 .
24. Blodgett D, Redick S, Harlan D. Surprising heterogeneity of pancreatic islet cell subsets. Cell Systems. 2016;3:330–2.
25. Muraro MJ, Dharmadhikari G, Grün D, Groen N, Dielen T, Jansen EWL, van Gurp L, Engelse MA, Carlotti F, de Koning EJP, van Oudenaarden A. A single-cell transcriptome atlas of the human pancreas. Cell Systems. 2016;3: 385–4712 16.
26. Xin Y, Kim J, Okamoto H, Ni M, Wei Y, Adler C, Murphy A, Yancopoulos G, Lin C, Gromada J. Rna sequencing of single human islet cells reveals type 2 diabetes genes. Cell Metab. 2016;24:608–15.
27. Hashimshony T, Senderovich N, Avital G, Klochendler A, de Leeuw Y, Anavy L, Gennert D, Li S, Livak KJ, Rozenblatt-Rosen O, Dor Y, Regev A, Yanai I. CEL-Seq2: sensitive highly-multiplexed single-cell RNA-seq. Genome Biol. 2016;17.
28. Picelli S, Björklund ÅK, Faridani OR, Sagasser S, Winberg G, Sandberg R. Smart-seq2 for sensitive full-length transcriptome profiling in single cells. Nature Methods. 2013;10:1096-8.
29. Goetz JJ, Trimarchi JM. Transcriptome sequencing of single cells with smart-seq. Nat Biotechnol. 2012;30:763–5.
30. Butler A, Hoffman P, Smibert P, Papalexi E, Satija R. Integrating single-cell transcriptomic data across different conditions, technologies, and species. Nat Biotechnol. 2018;36:411–20.
31. Baron M, Veres A, Wolock S, Faust A, Gaujoux R, Vetere A, Ryu J, Wagner B, Shen-Orr S, Klein Aea. A single-cell transcriptomic map of the human and mouse pancreas reveals inter- and intra-cell population structure. Cell Systems. 2016;3(4):346–60.
32. Klein A, Mazutis L, Akartuna I, Tallapragada N, Veres A, Li V, Peshkin L, Weitz D, Kirschner M. Droplet barcoding for single-cell transcriptomics applied to embryonic stem cells. Cell. 2015;161:1187–201.
33. Kiselev VY, Yiu A, Hemberg M. scmap: projection of single-cell RNA-seq data across data sets. Nature Methods. 2018;15(5):59–362.
34. Y. Lieberman, L. Rokach, and T. Shay,“Castle - classification of single cells by transfer learning: Harnessing the power of publicly available single-cell RNA sequencing experiments toannotate new experiments,”PLoS ONE 2018; 13 10.
35. Tan Y, Cahan P. SingleCellNet: A computational tool to classify single-cell -seq data across platforms and across species. Cell Systems. 2019;9(2):207– 213.e2.
36. Boufea K, Seth S, Batada NN. scID: Identification of transcriptionally equivalent cell populations across single-cell RNA-seq data using discriminant analysis. bioRxiv. 2018.
37. Sen P, Kemppainen E, OrešičM. Perspectives on systems modelling of human peripheral blood mononuclear cells. Front Mol Biosci. 2017;4:96. 38. Autissier P, Soulas C, Burdo TH, Williams KC. Evaluation of a 12âcolor flow
cytometry panel to study lymphocyte, monocyte, and dendritic cell subsets in humans. Cytometry Part A. 2010;77(5):410–9.
39. Zheng GXY, Terry JM, Belgrader P, Ryvkin P, Bent ZW, Wilson R, Ziraldo SB, Wheeler TD, McDermott GP, Zhu J, Gregory MT, Shuga J, Montesclaros L, Underwood JG, Masquelier DA, Nishimura SY, Schnall-Levin M, Wyatt PW, Hindson CM, Bharadwaj R, Wong A, Ness KD, Beppu LW, Deeg HJ, McFarland C, Loeb KR, Valente WJ, Ericson NG, Stevens EA, Radich JP, Mikkelsen TS, Hindson BJ, Bielas JH. Massively parallel digital transcriptional profiling of single cells. Nat Commun. 2017;8:1.
40. Hoen PACT, Friedländer MR, Almlöf J, Sammeth M, Pulyakhina I, Anvar SY, Laros JFJ, Buermans HPJ, Karlberg O, Brännvall M, Dunnen JTD, Ommen GJBV, Gut IG, Guigó R, Estivill X, Syvänen AC, Dermitzakis ET, Lappalainen T. Reproducibility of high-throughput mRNA and small RNA sequencing across laboratories. Nature Biotechnol. 2013;31:1015–22.
41. Breton G, Zheng S, Valieris R, Tojal da Silva I, Satija R, Nussenzweig MC. Human dendritic cells (dcs) are derived from distinct circulating precursors that are pre-committed to become cd1c + or cd141 + dcs. J Exp Med. 2016;213:2861–70.
42. Zarkavelis G, Boussios S, Papadaki A, Katsanos KH, Christodoulou DK, Pentheroudakis G. Current and future biomarkers in colorectal cancer. Ann Gastroenterol. 2017;30(6):613–21.
43. Barrett CL, Deboever C, Jepsen K, Saenz CC, Carson DA, Frazer KA. Systematic transcriptome analysis reveals tumor-specific isoforms for ovarian cancer diagnosis and therapy. Proc Nat Acad Sci. 2015;112:3050-7. 44. Billatos E, Vick JL, Lenburg ME, Spira AE. The airway transcriptome as a
biomarker for early lung cancer detection. Clin Cancer Res. 2018;24:2984-92. 45. Ervine A, McBride H, Kelly P, Loughrey M. Double immunohistochemistry
enhances detection of lymphatic and venous invasion in early-stage colorectal cancer. Virchows Arch. 2015;467:265–71.
46. Martinuzzi C, Pastorino L, Andreotti V, Garuti A, Minuto M, Fiocca R, BianchiScarrà G, Ghiorzo P, Grillo F, Mastracci L. A combination of immunohistochemistry and molecular approaches improves highly sensitive detection of braf mutations in papillary thyroid cancer. Endocrine. 2016;53: 672–80.
elucidates cellular heterogeneity in human colorectal tumors. Nat Genet. 2017;49:708–18.
48. Torgo L. Data mining with R, learning with case studies. Chapman and Hall/ CRC; 2010.
49. Ben-Hur A, Ong CS, Sonnenburg S, Schölkopf B, Rätsch G. Support vector machines and kernels for computational biology. PLoS Computat Biol. 2008;4. 50. Shekhar K, Lapan SW, Whitney IE, Tran NM, Macosko EZ, Kowalczyk M,
Adiconis X, Levin JZ, Nemesh J, Goldman M, Mccarroll SA, Cepko CL, Regev A, Sanes JR. Comprehensive classification of retinal bipolar neurons by single-cell transcriptomics. Cell. 2016;166(5):1308–23 e30.
51. Lin C, Jain S, Kim H, Bar-Joseph Z. Using neural networks for reducing the dimensions of single-cell RNA-seq data. Nucleic Acids Res. 2017;45(17):e156. 52. M. Kuhn,“Building predictive models in r using the caret package,”Journal
of Statistical Software. 2008; 28.
53. K. Hornik, A. Smola, A. Karatzoglou, and A. Zeileis,“kernlab - an s4 package for kernel methods in r,”J Stat Software 2004; 11.
54. James G, Tibshirani R, Witten D, Hastie T. An Introduction to Statistical Learning with Applications in R. Springer texts in statistics An introduction to statistical learning. New York: Springer New York : Imprint: Springer; 2013. 55. Robinson MD, McCarthy DJ, Smyth GK. edgeR : a bioconductor package for
differential expression analysis of digital gene expression data. Bioinformatics. 2010;26:139–40.
56. Baglama J, Reichel L. Augmented implicitly restarted lanczos bidiagonalization methods. SIAM J Sci Comput. 2005;27(1):19–42. 57. Alquicira-Hernandez J, Sathe A, Ji HP, Nguyen Q, Powell JE.scPred: accurate
supervised method for cell-type classification from single-cell RNA-seq data. Github. 2019https://github.com/powellgenomicslab/scPred.
58. Alquicira-Hernandez J, Sathe A, Ji HP, Nguyen Q, Powell JE.scPred: accurate supervised method for cell-type classification from single-cell RNA-seq data. Zenodo. 2019 doi:https://doi.org/10.5281/zenodo.3391594.
59. Andor N, Sathe A, Ji HP. Single-cell genomic analysis of gastrointestinal cancer. dbGap. 2019https://www.ncbi.nlm.nih.gov/projects/gap/cgi-bin/ study.cgi?study_id=phs001818. v1.p1.
60. Muraro MJ, Dharmadhikari G, de Koning E, van Oudenaarden A. A single-cell transcriptome atlas of the human pancreas. Gene Expression Omnibus. 2016.https://www.ncbi.nlm.nih.gov/geo/query/acc.cgi?acc=GSE85241. 61. Palasantza A, Sandberg R, Segerstolpe A. (2018, January 29). Single-cell
transcriptome profiling of human pancreatic islets in health and type 2 diabetes. ArrayExpress. 2016.https://www.ebi.ac.uk/arrayexpress/experiments/E-MTAB-5061. 62. Xin Y, Gromada J. Gene Expression Omnibus. (2018, January 29). RNA
sequencing of single human islet cells reveals type 2 diabetes genes. 2016. https://www.ncbi.nlm.nih.gov/geo/query/acc.cgi?acc=GSE81608. 63. Veres A, Baron M. (2018, January 29). A single-cell transcriptomic map of the
human and mouse pancreas reveals inter- and intra-cell population structure. 2016.https://www.ncbi.nlm.nih.gov/geo/query/acc.cgi?acc=GSE84133. 64. Zheng Grace XY, Terry JM, Belgrader P, Ryvkin P, Bent ZW, Wilson R, Ziraldo
SB, Wheeler TD, McDermott GP, Zhu J, Gregory MT, Shuga J, Montesclaros L, Underwood JG, Masquelier DA, Nishimura SY, Schnall-Levin M, Wyatt PW, Hindson CM, Bharadwaj R, Wong A, Ness KD, Beppu LW, Deeg HJ, McFarland C, Loeb KR, Valente WJ, Ericson NG, Stevens EA, Radich JP, Mikkelsen TS, Hindson BJ, Bielas JH. (2019, January 3). Massively parallel digital transcriptional profiling of single cells. 10X Genomics datasets. 2019. https://support.10xgenomics.com/single-cell-gene-expression/datasets. 65. Villani AC, Satija R, Reynolds G, Sarkizova S, Shekhar K, Fletcher J, Griesbeck M,
Butler A, Zheng S, Lazo S, Jardine L, Dixon D, Stephenson E, Nilsson E, Grundberg I, McDonald D, Filby A, Li W, De Jager PL, Rozenblatt-Rosen O, Lane AA, Haniffa M, Regev A, Hacohen N. (2018, January 29). Single-cell RNA-seq reveals new types of human blood dendritic cells, monocytes, and progenitors. Single Cell Portal. 2017.https://portals.broadinstitute.org/single_ cell/study/SCP43/atlas-of-human-blood-dendritic-cells-and-monocytes. 66. Oliveira T, Satija R. Gene Expression Omnibus. (2018, January 29). Single-cell
RNA-seq reveals heterogeneity within human pre-cDCs. 2016.https://www. ncbi.nlm.nih.gov/geo/query/acc.cgi?acc=GSE89232.
67. Li H, Courtois ET. (2018, January 29). Reference component analysis of single-cell transcriptomes elucidates cellular heterogeneity in human colorectal tumors. Gene Expression Omnibus. 2017.https://www.ncbi.nlm. nih.gov/geo/query/acc.cgi?acc=GSE81861.
Publisher’s Note