©IJRASET 2014: All Rights are Reserved
462
Study of Traffic Noise Pollution at Intersection of
Major Roads for Akola City (M.S)
Miss. Kavita K. Ghogare
Department of Civil Engg, COET, Akola
Abstract— Noise is one of the environmental pollutants that are uncomforted in daily life. Noise pollution has become major
concern for communities living within the city in fight of rapid growth and ill effects of noise pollution. Rapid organization and allowing growth of vehicles in Akola is causing serious environmental problems. It also effects on human health and environment. Hence, noise pollution due to vehicular traffic flow at five major road locations was studied. The noise level data were recorded with sound level meter (No. of interval) at the interval of 5 second for 10 minutes during peak hours at morning and evening and the graphs are plotted against time interval verses percentage of traffic volume and noise descriptors. The variation of noise levels due to traffic flow is studied and presented in graphical forms. Also percentage occurrence of various noise levels of various approaches in peak hours shown by bar chart. It is observed that two-wheeler is more as compare to other type of vehicles and maximum number of two-wheeler was 2424 per hour. Maximum noise pollution level and Leq was observed at Railway Station Square intersection as 104.20 dB(A) and 86.60 dB(A) respectively. It
was found that the noise pollution at all the time violating the Indian norms of ambient noise standard. In this paper finally it concluded that noise pollution must be controlled in Akola city by enforcing the ambient noise standard strictly and by diverting traffic on the other roads as possible, also it needs to change the mindset, developed positive attitude and awareness to create noise free environment.
Keywords— Noise, Pollution, Traffic, Human Health, Environment
I. INTRODUCTION
Noise is an inevitable part of everyday life - the television, a plane flying overhead, a faulty muffler on the passing car, dogs barking, children laughing. Mild noise can be annoying; excessive noise can destroy a person's hearing. People do not easily become accustomed to noise. The slightest unwanted sound can become very annoying if it continues for any length of time. While some nearby residents may ignore the continuous hum of a busy freeway, others will never be able to ignore it and increasingly will find it irritating. Sound is a form of energy that is transmitted by pressure variations which the human ear can detect. When one plays a musical instrument, say a guitar, the vibrating chords set air particles into vibration and generate pressure waves in the air. People nearby may then hear the sound of the guitar when the pressure waves are perceived by the ear. Sound can also travel through other media, such as water or steel. Apart from musical instruments, sound can be produced by many other sources -mans vocal cord, a running engine, a vibrating loudspeaker diaphragm, an operating machine tool, and so on. Noise perception is subjective. Factors such as the magnitude, characteristics, duration, and time of occurrence may affect one's subjective impression of the noise.
II. SCOPE
Over here the study is done for traffic noise pollution at the intersection of major roads in Akola city.(M.S)
A. Studies for traffic noise pollution reduction through eco-friendly noise barriers like trees, bushes, etc. should be conducted under varying conditions of land used.
B. For developing traffic noise prediction models, road materials, road gradient, surface roughness and curvature of road may be taken as additional parameters.
C. Individual locations can be taken as separate case study.
D. Noise levels in air-port zone can be studied.
E. Noise level can be studied inside as well as outside areas of important buildings.
III. MATERIALSANDMETHODS
463
A. Selection of survey location
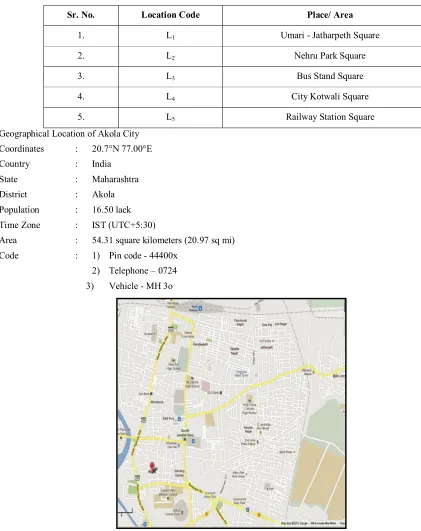
[image:3.612.65.486.150.681.2]There are various types of parameter which are taken to select location. Traffic noise parameter are the function of the composition of traffic, traffic flow and condition of land used, speed of traffic, types of vehicles and surface of road, weather condition, time and day of recording data. Considering above data in view we choose 5 study locations code shown in Table 1. and noise monitoring points at xn of number R as shown in Table 1 and their location maps as in Fig.3.1.
Table 1.Noise Monitoring Points
Sr. No. Location Code Place/ Area
1. L1 Umari - Jatharpeth Square
2. L2 Nehru Park Square
3. L3 Bus Stand Square
4. L4 City Kotwali Square
5. L5 Railway Station Square
Geographical Location of Akola City
Coordinates : 20.7°N 77.00°E
Country : India
State : Maharashtra
District : Akola
Population : 16.50 lack
Time Zone : IST (UTC+5:30)
Area : 54.31 square kilometers (20.97 sq mi)
Code : 1) Pin code - 44400x
2) Telephone – 0724
3) Vehicle - MH 3o
464
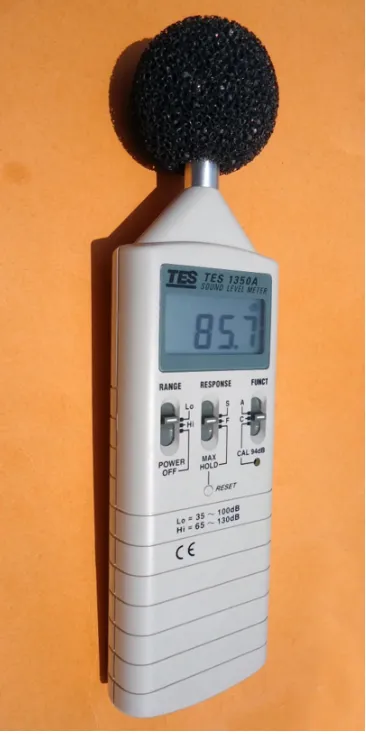
[image:4.612.242.425.83.450.2]
Fig.3.2. Sound level meter
B. Data Recording and Processing
Measurement of noise level
Specification of sound level meter (TES-1350A) as shown in Table.2 and digital sound level meter as shown in Fig.3.2.
Table 2.Specification of sound level meter (TES-135OA)
Microphone ½ inch Electret condenser microphone
Display LCD
Digital display 4-Digits
Resolution 0.1Db
Display period 0.5 sec.
Time weighting FAST (125 mS), SLOW (1 sec.)
Level ranges Lo.35-100 dB and Hi. 65-130 Db
[image:4.612.115.501.551.716.2]©IJRASET 2014: All Rights are Reserved
465
Dynamic range 65Db
Alarm function “OVER” is show when input is out of range
Maximum hold Hold reading ,with decay<1dB/3 minutes
Calibration Electrical calibration with the internal oscillator (1KHz sine wave)
AC output 0.65 Vrms at FS (full scale), output impedance approx. 600 Ω
DC output 10 Mv/dB, output impedance approx.100Ω
Power supply One 9V battery 006P or IEC 6F22 or NEDA 1604
Power life About 50 hrs (alkalinecell)
Operating temp. 0 to 40° C (32 to 104°F )
Operating Humidity 10 to 90 % RH
Storage Temperature 10 to 60° C (14°to 104°F )
C. Duration and Interval of Noise Sample
Johnson and Wood (1971) in their study have mentioned that periodical noise study is most appropriate and less expensive of course, continuous noise study is desirable but not necessary and is more expensive. On the basis of their study they have proved that use of 15 second sampling rates for 5 minutes would permit an accurate and efficient investigation of the sound level of the given area. Also, according to Code BS: 3425-1966, Measurement of noise emitted by motor vehicles, the sample time should be in between 5 minute to 55 minute.
In the present study, a noise sample size of 10 minute in each hour at a particular selected distance from the edge of the pavement was taken. Noise sample were collected in dB (A) scale at every 15 second interval (4 count per minute) or total 40 reading in one sample size.
IV. OBSERVATION
Noise reading collected at different noise monitoring points has been presented. In the present study, a noise sample size of 10 minute in each hour at a particular selected distance from the edge of the pavement was taken. Noise sample were collected in dB (A) scale at every 15 second interval (4 counts per minute) or total 40 reading in one sample size. Using recorded noise level reading, different calculation were done like cumulative percentage of time noise level exist.
At all the selected study location L1 to L5 one hour classified traffic volume data were recorded, in a predestined hourly traffic
volume recording perform, which are subdivided in 5 minutes time interval columns.
V. RESULTSANDDISCUSSION
The data collected is analyzed in following steps.
A. Analysis of traffic volume data in field, % composition of traffic at each selected study location. B. Analysis of noise level data and evaluation of noise descriptors at each location.
C. Analysis for frequency distribution to know the % occurrence of particular noise level range.
A. Analysis of Traffic Volume
Traffic volume data collected from field at 5 min. interval in morning and evening peak hours is analyzed for each location. The composition of traffic volume at each location is ascertained in Fig. 5.6 for each study location at different directions of flow and on different days
B. Analysis of Noise Level
©IJRASET 2014: All Rights are Reserved
467
VI. CONCLUSION
From the observation and all data collection, step-by-step conclusions are as follow.
The average vehicular traffic volume in peak hours on major road intersections are as follows.
A. At Jatharpeth Square intersections - 3086 vehicles per hour.
B. At Nehru Park Square intersections - 2768 vehicles per hour.
C. At Bus Stand Square intersections - 4360 vehicles per hour.
D. At City Kotwali intersections - 1893 vehicles per hour.
E. At Railway Station Square intersections - 2837 vehicles per hour.
It is observed that, at all the location in which analysis is carried out the number of two wheelers is more as compare to other types of vehicles and the traffic volume is maximum at Bus Stand square.
F. Average numbers of two-wheelers at Jatharpeth Square - 2424 vehicles per hour.
G. Average numbers of two-wheelers at Nehru Park Square intersections - 1460 vehicles per hour.
H. Average numbers of two-wheelers at Bus Stand Square intersections - 1970 vehicles per hour.
I. Average numbers of two-wheelers at City Kotwali intersections - 928 vehicles per hour.
J. Average numbers of two-wheelers at Railway Station Square intersections - 1532 vehicles per hour.
The maximum noise pollution was observed at Railway Station Square and the value obtained was 104.50 dB(A).
Level of continuous noise (Leq) for Railway Station location is largest as compared to other four locations.
K. Leq for Railway Station Square is - 86.60 dB(A).
L. Leq for City Kotwali Square is - 84.97 dB(A).
M.Leq for Jatharpeth Square is - 84.95 dB(A).
N. Leq for Bus Stand Square is - 84.91 dB(A).
O. Leq for Nehru Park Square is - 84.49 dB(A).
Which indicate the noise pollution at all the time violating the Indian norms of ambient noise standards?
It is concluded that noise level was always higher than ambient air quality standard in respect of noise as mentioned in environmental protection act 1986. It was higher in Railway Square, Bus Stand Square which is very harmful to human health.
A. Causes of Noise Pollution 1) Road traffic noise
Road traffic noise is the leading sources of community noise. Two wheelers, auto rickshaw and buses are economical means of transportation. On the other hand transportation of consumer goods by truck and three-wheeler are convenient and economical means, which leads to give them entry in commercial area. In city, the main sources of traffic noise are four wheelers, auto rickshaw, trucks and buses. Various sources of vehicular noise are as follows.
a) Blowing of air horn at prohibited areas;
b) Operation of poorly maintained vehicles;
c) Engine noise;
d) Beaks and horn noise;
e) Noise due to age of the vehicles;
f) Noise due to road surface;
g) Noise due to speed of traffics;
h) The encroachments of road site which slow movement of vehicles with frequent use of horns;
i) Higher the percentages of automobile traffic in mixed traffic flow, higher are the values of traffic noise parameters.
B. Suggestions
The control of noise pollution is required for the fact that public health has been matter of great concern for us. In order to control noise, following suggestions have been made:
A. A uniform law should be introduced for controlling and abatement of noise. This law should provide different rules for regulating different kinds of noise arising from different sources.
©IJRASET 2014: All Rights are Reserved
468
in emergencies) should be promulgated for the use of loudspeakers and other noise producing activities during sleeping hours.
C. Noise levels of motor vehicles and construction equipment, aircraft should be standardized. Railway track should not pass through residential areas especially for shunting and aerodromes should be constructed far away from the residential areas. Landing charges on noisy aircrafts or rebates of landing charges to quiet aircraft. Provision should be made in the Act regarding the limit of noise in terms of decibels, as is done in most of the country.
D. Specific provision should be incorporated under the Factories Act for control of noise from industries.
E. Educating the people: Public awareness of the hazards of noise should be aroused so that people should employ things like radios, Tape recorder, T. V. etc., at such a volume which may not cause nuisance to the neighbors.
F. Irregular and unnecessary use of pressure horns by the drivers of truck, bus and other automobiles should be checked. Punishment should be provided for the non-use of silencers and proper horns.
At present, the authority should implement strictly those provisions, which are given in various branches of law. In the last specific legislation to curb the noise pollution be enacted on the basis of scientific investigations and information. Traffic should be diverted into another roads that the intensity of sound from that heavy traffic is reduced. We should increased the height of compound wall of any educational and commercial building so that the intensity of sound due to barriers is reduced. Provision of the fly over at heavy traffic zone for diverting the traffic to reduce the noise pollution.
REFERENCES
[1] http://www.mpcb.com/
[2] http://www.nonoise.org/ [3] http://www.nspe.org/ [4] http://www.rta.nsw.gov.au/
[5] http://www.google.co.in/ - for location map
[6] Anisa B. Khan “Impact of noise pollution on community health – A study at Pondicherry ”, Indian Association of Biomedical Scientists , Vol. 18, No. 3, 1998, pp 183-190.
[7] C. C. Bhattacharya, Dr. S. S. Jain, S. P. Sing, Dr. M. Parida, Ms. Namita Mittal, “Development of Comprehensive Highway Noise Model for India Condition” Indian Road Congress Journal, Paper No. 481, 2001, pp 453-488.
[8] Gupta, A. K., Khanna S. K., Gopal Madan, “Nomographic Proceducer for Road Traffic Noise Evaluation”, Indian Highway, Vol. 12 No. 1, pp 5-11, Jan 1984.
[9] Gupta, A. K., Nigam S. P., Hansi J. S., “A Study on traffic Noise for various land uses for mixed Traffic Flow” Indian Highways, Indian Road Congress, Jamnagar House, Shahjehan Road. New Delhi, 1990, pp 30-48.
[10] Jeffery Sama, Hothersall, David C. and Salter, “Assessing and Mitigating Noise Impact”, Report of State Department of Environmental Conservation, 2001.
[11] N. Tandon and H. Pandey, “Noise levels of some vehicles and Traffic Noise at some Major Road Crossing in south Delhi”, Indian J. Environmental Protection, Vol. 18, No. 6, June 1998, pp 454-458.