© 2016, IRJET | Impact Factor value: 4.45 | ISO 9001:2008 Certified Journal | Page 87
Indian Currency Recognition and Verification Using Image Processing
Ingulkar Ashwini Suresh
1, Prof.P.P.Narwade
21
M.E. (II) year student of Department of Electronics and Telecommunication Engineering,
MGMCET, Navi Mumbai, Maharashtra, India
2
Assistant Professor, Department of Electronics and Telecommunication Engineering,
MGMCET, Navi Mumbai, Maharashtra, India
---***---Abstract - Indian is a developing country, Production and
printing of Fake notes of Rs.100, 500 and 1000 are degrading economic growth of our country. From last few years due to technological advancement in color printing, duplicating, and scanning, counterfeiting problems are coming into picture. In this article, recognition of paper currency with the help of digital image processing techniques is described. Around eight characteristics of Indian paper currency is selected for counterfeit detection. The identification marks, optical variable link, see through register and currency color code decides the currency recognition. The security threads, water mark, Latent image and micro-lettering features are used for currency verification. The characteristics extraction is performed on the image of the currency and it is compared with the characteristics of the genuine currency. The currency will be verified by using image processing techniques. The approach consists of a number of components including image processing, edge detection, image segmentation and characteristic extraction and comparing images. The desired results shall verify with MATLAB software.
Key Words: Currency Recognition, Image Processing Technique, Image segmentation Character extraction, Currency Verification.
1. INTRODUCTION
All economic activities relating to production, distribution, consumption etc. can be motivated by money. Savings and investments can be made in the form of capital information. Thus, money is important in the dynamic society for everything. As our economy is moving towards the development there are many other things which are downsizing it. One of those things is production and usage of forged bank notes.
The worst hit of this action is mostly average citizen as fake banknotes have become so deeply embedded in the Indian economy that even bank branches and ATMs are disbursing counterfeit currency. From petrol stations to the local vegetable vendor, everybody is wary of accepting banknotes in denominations of Rs.500 and Rs.1, 000 as a majority of them are almost impossible to tell from genuine banknotes. The usual effect of counterfeit on economy is inflation.
The only solution that is presently available for common man to detect counterfeit currency is Fake Note Detector Machine. This machine is mostly available only in banks which is not reachable every time by average citizen. All these scenarios need a kind of solution for common people to judge a forged bank note and to refrain our currency from losing its value.
© 2016, IRJET | Impact Factor value: 4.45 | ISO 9001:2008 Certified Journal | Page 88
2. SYSTEM OVERVIEW
2.1 Features of Indian Currency
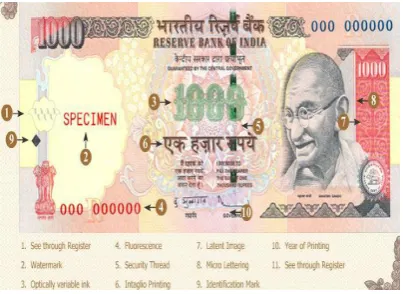
There are too many features present in Indian currency which is decided by Reserve Bank of India. Figure 2.1 gives the idea about currency features of 1000 Rs note.
1. See through Register
The small floral design printed both on the front (hollow) and back (filled up) of the note in the middle of the vertical band next to the Watermark has an accurate back to back registration. The design will appear as floral design when seen against the light.
2. Water marking
[image:2.595.72.274.419.566.2]The Mahatma Gandhi Series of banknotes contain the Mahatma Gandhi watermark with a light and shade effect and multi-directional lines in the watermark.
Figure 2.1 Currency features of 1000 Rs note
3. Optically Variable Ink (OVL)
This is a new feature included in the Rs.1000 and Rs.500 notes with revised color scheme introduced in November 2000. The numeral 1000 and 500 on the obverse of Rs.1000 and Rs.500 notes respectively is printed in optically variable ink viz., a color-shifting ink.
4. Fluorescence
Number panels of the notes are printed in fluorescent ink. The notes also have optical fibers. Both can be seen when the notes are exposed to ultra-violet lamp.
5. Security Thread
The Rs.500 and Rs.100 notes have a security thread with similar visible features and inscription ‘Bharat’ (in Hindi), and ‘RBI’. When held against the light, the security thread on Rs.1000, Rs.500 and Rs.100 can be seen as one continuous line.
6. Intaglio Printing
The portrait of Mahatma Gandhi, the Reserve Bank seal, guarantee and promise clause, Ashoka Pillar Emblem on the left, RBI Governor's signature are printed in intaglio i.e. in raised prints, which can be felt by touch
7. Latent image
On the obverse side of Rs.1000, Rs.500, Rs.100, Rs.50 and Rs.20 notes, a vertical band on the right side of the Mahatma Gandhi’s portrait contains a latent image showing the respective denominational value in numeral.
8. Micro lettering
This feature appears between the vertical band and Mahatma Gandhi portrait. It always contains the word ‘RBI’ in Rs.5 and Rs.10. The notes of Rs.20 and above also contain the denominational value of the notes in micro letters. This feature can be seen well under a magnifying glass.
9. Identification Mark
Each note has a unique mark of it. A special feature in intaglio has been introduced on the left of the watermark window on all notes except Rs.10/- note. This feature is in different shapes for various denominations (Rs. 20-Vertical Rectangle, Rs.50- Square, Rs.100-Triangle, Rs.500-Circle and Rs.1000-Diamond).
3. PROPOSED SYSTEM
The proposed system of this article is divided into two parts such as:
1)Currency Recognition
2)Currency Verification
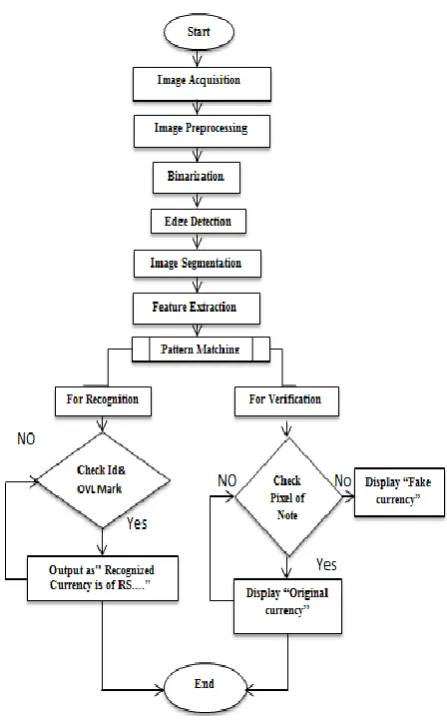
© 2016, IRJET | Impact Factor value: 4.45 | ISO 9001:2008 Certified Journal | Page 89 below describes flowchart for currency Recognition. In
Currency Verification, Character from each segmented part is extracted. Pixel value for that extracted part can be calculated.
3.1 Image Acquisition:
Performing image acquisition in image processing is always the first step in the workflow sequence because, without an image, no processing is possible. After the image has been obtained, various methods of processing can be applied to the image to perform the many different vision tasks. There are various ways to acquire image such as with the help of camera or scanner. Acquired image should retain all the features [7].
3.2 Pre-processing:
The main goal of the pre-processing to enhance the visual appearance of images and improve the manipulation of data sets. Image preprocessing, also called image restoration, involves the correction of distortion, degradation, and noise introduced during the imaging process. Interpolation is the technique mostly used for tasks such as zooming, rotating, shrinking, and for geometric corrections. Removing the noise is an important step when processing is being performed. However noise affects segmentation and pattern matching [7].
3.3 Binarization:
The image acquired is in RGB color. It is converted into gray scale because it carries only the intensity information which is easy to process instead of processing three components R (Red), G (Green), B (Blue). To take the RGB values for each pixel and make as output a single value reflecting the brightness of that pixel. One such approach is to take the average of the contribution from each channel: (R+B+C)/3. However, since the perceived brightness is often dominated by the green component, a different, more “human oriented”, method is to take a weighted average, e.g.: 0.3R + 0.59G + 0.11B [7].
3.4 Edge Detection:
Edge detection is the name for a set of mathematical methods which aim at identifying points in a digital image at which the image brightness changes sharply or, more formally, has these continuities. The points at which image
[image:3.595.326.550.230.594.2]brightness changes sharply are typically organized into a set of curved line segments termed edges. Edge detection is an image processing technique for finding the boundaries of objects within images. It works by detecting discontinuities in brightness. Edge detection is used for image segmentation and data extraction in areas such as image processing, computer vision, and machine vision [7].
Figure 3.1: Flowchart for Currency Recognition and Verification System
3.5 Image Segmentation:
© 2016, IRJET | Impact Factor value: 4.45 | ISO 9001:2008 Certified Journal | Page 90 Image segmentation is typically used to locate objects and
boundaries (lines, curves, etc.) in images [7]. Segmentation algorithm for images generally are based on one of the two basic properties of image intensity values-
1) Discontinuity:
Based on abrupt changes in intensity such as edges in an image.
2) Similarity:
Based on partitioning an image into regions that are similar according to a set of predefined criteria [6].
3.6 Feature Extraction:
Feature extraction is a special form of dimensional reduction. When the input data to an algorithm is too large to be processed and it is suspected to be very redundant then the input data will be transformed into a reduced representation set of features. Transforming the input data into the set of features is called feature extraction. If the features extracted are carefully chosen it is expected that the features set will extract the relevant information from the input data in order to perform the desired task using this reduced representation instead of the full size input [7].
4. RESULTS AND DISCUSSION:
[image:4.595.309.544.209.317.2]In this section results obtain after performing morphological image processing operation. An original image is read from database. A captured image has dimensions 866×356, vertical and horizontal revolution 96dpi. The read out image shown in Figure 4.1 titled as “Image acquisition of 1000 rs note”.
Figure 4.1: Image acquisition of 1000 rs note
Segmentation is the process of partitioning a digital image into multiple segments. It is typically used to distinguish objects from backgrounds. Here edge based segmentation is performed on the image. Segmentation of features is illustrated in Figure 4.2(a) and 4.2(b) named as “Image segmentation with noise “and Image segmentation without noise
Figure 4.2(a): Image segmentation with noise
Figure 4.2 (b):Image segmentation without noise
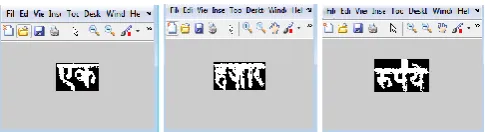
[image:4.595.308.544.349.466.2]Indian currency has various features.Performing feature extraction for each feature is a big task.Here for currency verification process character extracted from Intaglio Pringting section which is illustrated in Figure4.3 named as” Character Extraction of Intaglio Printing”.
Figure 4.3: Character Extraction of Intaglio Printing
[image:4.595.44.278.570.730.2] [image:4.595.310.553.572.638.2]© 2016, IRJET | Impact Factor value: 4.45 | ISO 9001:2008 Certified Journal | Page 91
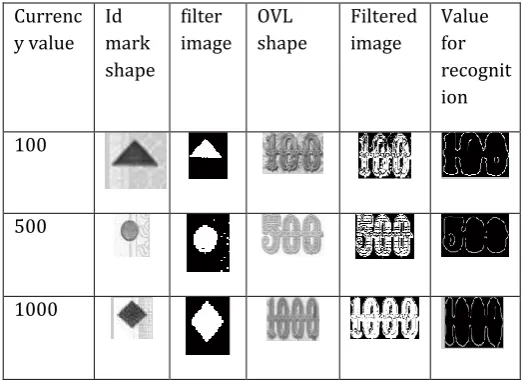
Table 4.1: Currency values with its recognition parameter.
Currenc y value
Id mark shape
filter image
OVL shape
Filtered image
Value for recognit ion
100
500
1000
5. CONCLUSION AND FUTURE WORK
By using digital image processing, analysis of Currency image is more accurate as well as this method is efficient in terms of cost and time consuming compared to existing techniques.MATLAB Software use for this analysis .Day by day research work is increasing in this field and various image processing techniques are implemented in order to get more accurate result. The proposed system is worked effectively for extracting feature of Indian currency images.
Extracted features of currency image will be using for currency value recognition as well as for its verification.Application based system shall be designed to get proper result whether currency image is fake or its genuine.
REFERENCES
[1]
Aruna D H, Manpreet Bagga, Dr.Baljit Singh “A Survey on Indian Currency Note Denomination Recognition System”. International Journal of Advance Research in Science and Engineering,IJARSE, Vol. No.4, Special Issue (01), 2015.
[2] Vibhuti Vashishtha and Md. Sadim “A Paper Currency Recognition System Using Image Processing To Improve the Reliability with PCA
Method”. International Journal of Engineering
Science & Research Technology. ISSN: 2277-9655
Vol-1 Issue: 1, 2015.
[3] Prof. Sowmyashree, Shreya Shetty, Trupti Ghotkar and Chirayu Yadav, “Currency Recognition and Fake Note Detection” International Journal of Research in
Engineering & Advanced Technology, Volume 3,
Issue 5, 2015.
[4] Hanish Aggarwal and Padam Kumar “Indian Currency Note Denomination Recognition in Color Images”. International Journal on Advanced Computer Engineering and Communication
Technology, Vol-1 Issue: 1, 2014.
[5] D.Alekhya, G.DeviSurya Prabha, G.Venkata Durga Rao “Fake Currency Detection Using Image Processing and Other Standard Methods”.
International Journal of Research in Computer and
Communication Technology, Vol 3, Issue 1, 2014.
[6] Mohd Mudassir Mohd Ismail and Mr. Ashutosh. B. Makone “An Automated Recognition of Fake or Destroyed Indian Currency Notes Using Image Processing”. International Journal of Engineering
Science & Research Technology, 2014.
[7] M.Deborah and Soniya Prathap “Detection of Fake currency using Image Processing”. IJISET- International Journal of Innovative Science,
Engineering & Technology, Vol. 1, Issue 10, 2014.
[8] Rubeena Mirza and Vinti Nanda “Design and Implementation of Indian Paper Currency Authentication System Based on Feature Extraction by Edge Based Segmentation Using Sobel Operator”.
International Journal of Engineering Research and
Development, Volume 3, Issue 2, 2012
[9] http://www.rbi.org.in/currency/ (accessed October 2011).