802
AN ENHANCED HOMOGENEITY MEASURE BASED
SIGNAL VARIANCE ESTIMATION FOR SPECKLE
REMOVAL IN ULTRASOUND IMAGES
1NIRMALADEVI PERIYASAMY, 2ASOKAN RAMASAMY
1Department of ECE, Kongu Engineering College, Perundurai, Erode 638052, Tamil Nadu, INDIA
2Principal, Kongunadu College of Engineering &Technology, Trichy621 215,Tamil Nadu, INDIA
Email(s): [email protected] , [email protected]
ABSTRACT
Estimation of signal variance in noisy environment is a critical issue in wavelet based image denoising algorithms. As the estimation of signal variance involving all the coefficients in a sub-band is computationally inefficient, an adaptive homogeneity measure based on maximum likelihood approach is used to determine the weighted estimate of the signal variance. This estimation is carried out by exploiting the intra scale and inter scale dependencies that exist among the wavelet coefficients in the same scale and at adjacent scales. A novel inter scale dependency measure is proposed in this paper. This measure is multiplied with the noisy detail subbands. The resulting subband matrix is used for signal estimation. An adaptive thresholding function instead of soft thresholding function with a subband adaptive Bayesian threshold is used. The adaptive thresholding function removes the fixed bias that results from soft thresholding operation between the denoised and original coefficients, thus preserving the original features effectively. Thus the proposed approach improves the denoising performance by using an adaptive threshold estimated via a locally estimated signal variance. Various performance measures are experimentally calculated and compared with several filters.
Keywords: Homogeneity Measure, Inter And Intra Scale Dependencies, Wavelet Thresholding, Speckle Noise, Ultrasound Images
1. INTRODUCTION
Digital images are often affected by noise during acquisition and transmission stages. Speckle is a multiplicative noise and is signal dependent. Mostly this type of granular noise is present in Satellite Aperture Radar (SAR) and medical ultrasound images. As speckle noise degrades the quality of images, diagnostic accuracy may be reduced. Image denoising is an essential preprocessing step. Noise removal in digital images aims to remove the speckle present while preserving the edges and fine details.
Standard speckle filters developed in the past two decades remove noise to a moderate level. They lack either the features preserving property or in reducing the computational time [1]. Later Johnson and Donoho [2] have pioneered Discrete Wavelet Transform (DWT) based denoising scheme by introducing hard and soft thresholding functions. Hard thresholding removes too many wavelet coefficients that might contain useful image information. The lack of translation
invariance in DWT introduces visual artifacts in the reconstructed images. This is overcome by the use of Stationary Wavelet Transform (SWT) which inherently possesses translation invariance characteristics. A critical issue in wavelet based denoising scheme is the statistical estimation of the signal variance in the presence of noise. The signal variance is determined by a local neighborhood window based Maximum Likelihood (ML) or Maximum A Posteriori (MAP) estimate [3] assuming the coefficients are locally independent and identically distributed. But this is inefficient as the size of the neighborhood grows.
803 while the coefficients affected by noise decay rapidly across scales [7]. This inter scale dependency measure along with the arbitrarily shaped locally adaptive window is used for the estimation of signal variance in each subband in the proposed approach. The wavelet coefficients within each subband are modeled as generalized Gaussian distribution (GGD) model. A data driven subband adaptive Bayesian estimate of the threshold is determined using the modeled subband coefficients. As the soft thresholding proposed by Donoho introduces fixed bias between the original and denoised coefficients, a new adaptive thresholding function [8] is used in the proposed approach, in which the coefficients are estimated between
W
jk−
λ
, and jk
W
, , jk
W
, is the wavelet
coefficient and λ is the threshold. In the proposed approach, a locally adaptive window based signal variance estimation exploiting the intra and inter scale dependencies is utilized in the new adaptive thresholding function to enhance the noise removal capability of wavelet based denoising algorithm in translational invariant domain.
The rest of paper is organized as follows: section 2 details the determination of weighted variance using the estimate of homogeneity measure, section 3 proposes a new inter scale dependency measure section 4 describes the proposed noise removal algorithm using a new adaptive thresholding function and the results and comparison are discussed in section 5.
2. PROPOSED METHOD
A noisy image in the wavelet domain is a linear combination of wavelet transform of the original image and noise as represented in equation
)
,
(
)
,
(
)
,
(
i
j
W
i
j
N
i
j
Y
=
+
(1)where
Y
(
i
,
j
)
is the noisy image,W
(
i
,
j
)
is the noise free image andN
(
i
,
j
)
is the noise content. Wavelet denoising performs in the following steps:i) Forward wavelet transform
ii) Estimation of signal and noise variance iii) Determination of threshold
iv) Thresholding the wavelet coefficients v) Reconstruction of denoised image using inverse wavelet transform
2.1 Proposed Interscale Dependency Measure When wavelet transform is applied to a signal or image, in the transformed domain, the signal energy is concentrated in few large coefficients and noise energy is seen distributed throughout the coefficients, thus providing a good data
decorrelation. It can be further stated as large magnitude coefficients are signal, while the coefficients with small magnitude are noise. In the wavelet shrinkage scheme, the coefficients may be grouped into significant and insignificant coefficients and are modified accordingly by applying certain rules. The performance of the shrinkage algorithm depends on the selection of threshold, thresholding function and also on the grouping of the coefficients. Selection of threshold and thresholding function has been discussed in the previous sections. The grouping of the coefficients results in two clusters, one classified as region of interest pixels and another cluster as noisy pixels. This approach improves the edge preservation of the reconstructed image as important image features are retained. The proposed clustering is done based on the spatial correlation of the pixels in the adjacent subbands considering the fact that the wavelet coefficients are not only correlated with local neighborhood within a subband but also across the subband in adjacent scales.
In wavelet decomposition the large amplitude coefficients at finer scales have significant parents at coarser scales. But the coefficients affected by noise decay rapidly across scales. Inter and intra scale dependencies have been studied extensively as seen from the literature [11-15]
Here a new measure for determining the inter scale dependency among the wavelet coefficients in adjacent subband is proposed.
0
)
(
m
=
W
j if j
T
Im
W
≤
+
)
2
(
1
(13) Where TIis the threshold defined by
n I
T =ασˆ (14)
2
ˆ
nσ
is the estimated noise variance andα
isexperimentally determined as 2. If the coefficient at coarser scale is less than the threshold, it can be considered to be an insignificant coefficient and the corresponding coefficient at its finer scale is made zero. A matrix of values is derived for all the detail subbands of the wavelet decomposition, by applying this dependency measure. This measure along with the intra scale correlation is used in estimating the signal variance.
2.2 Estimation Of Signal Variance Using Locally Adaptive Arbitrary Window
804 estimation of signal variance is a critical issue in many signal and image processing applications. A locally adaptive arbitrary window based estimation of signal variance is adopted in this paper for the estimation of threshold.
The signal variance is commonly estimated by selecting fixed neighborhood windows using MAP or ML estimate [3]. The ML method of signal variance estimation is given by
+ ∈ − =
∑
) ( 2 2 , 2 , , ) ( 1 k n y n j i j i j i y k n σ σ (2) Where n(k) is the neighborhood,n
(
k
)
is thecardinality of the neighborhood,
y
i,j is thecoefficients in the neighborhood and
σ
n2is thenoise variance estimated using the robust median estimator as,
(
)
2 , 2 n 6745 . 0 = median yi j
σ
(3) Where
y
i,jbelongs to the HH1sub band. Even though the computational load is low [3], the window size is fixed in ML estimate. The size and shape of the local window used for estimating the signal variance affects the denoising performance. Therefore a locally adaptive neighborhood window[4] is selected for the signal variance estimation to obtain an increased denoised performance. The procedure for arbitrary window selection is narrated below.The detail coefficients obtained by applying L
{
=1,2,....j}
levels of decomposition to the noisy images are subjected to the following operations. A square region R of size 9x9 is considered in the subbandy
(k
)
. This region is then divided into subregions ,0
,
,1,
,2...
, 1 −S k k k
k
r
r
r
r
. The sub regions are partitioned in such a way that they are non-overlapping (r
k,iI
r
k,j;
i
≠
j
)
and their uniongenerates the region R ( )
, R
r i
i k =
U
. Thecoefficient under consideration wk is at the centre
of
r
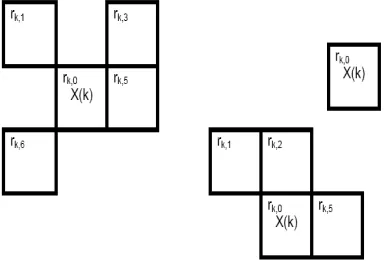
k,0and at the centre of R. The region and theirassociated sub regions are shown in fig.1.
1 , k
r
r
k,2r
k,34 , k
r
r
k,0r
k,56 , k
[image:3.595.299.510.78.280.2]r
r
k,7r
k,8Figure 1: .A square region R (9x9) and it sub regions (3x3) in a subband
The size of the arbitrary window for estimating the signal variance is then determined by finding a homogeneity measure among the sub regions. Homogeneity measure is defined as the normalized difference of variance between the sub region containing the coefficient under consideration and all the other sub regions in the region R. Here a region merging procedure is followed, starting from the sub region
r
k,0, the region containing thecurrent denoising coefficient, the merging continues until the homogeneity of variance is achieved. The equation for finding homogeneity is given as, 2 0 , 2 0 , 2 , , k k s k s k
h
σ
σ
σ
−
=
,s
=
0
,
1
,
2
....
S
−
1
(4)Where 2
,s
k
σ
is the local variance of the region
s k
r
, . The local variance of the sub regions arecalculated as given in
=
∑
∈( ) 2 , 2 , ,)
(
1
k n y j i s k j iy
k
n
σ
(5) Where n(k) is the neighborhood,n
(
k
)
is thecardinality of the neighborhood and
y
i,j is the coefficients in the neighborhood. This homogeneity measureh
ks, is then compared with
some specific threshold, to determine the shape of the window. Here a level adaptive threshold is used to determine the homogeneous variance given by,
) (
2
.
L jk
C
t
−805 C is scaling parameter and is empirically determined to be equal to 0.1 and
j
=
0
is the finest scale of decomposition andj
−
L
is thecoarsest scale of decomposition. If the homogeneity measures of the sub regions are less than the specified threshold then that sub region is included in the window. A binary matrix is defined to indicate whether the variance σk2,s is
homogeneous withσk2,0or not.
=
s k
v
,
1
ks kt
h
p
,
[image:4.595.92.286.338.469.2]0 otherwise (7) The sub regions having the binary value 1 are all joined together to get the arbitrary window. Some of the obtained arbitrary shaped windows are given below:
Figure 2: Arbitrary shaped windows obtained in the proposed approach
With the generated arbitrary window, the signal variance is then estimated as,
+ − = − =
−
=
∑
∑
2 1 0 , 1 0 , 2 , 2 n S s s k S s s k s k xv
v
σ
σ
σ
(8) Thus the weighted signal variance is estimated using an arbitrarily shaped window of neighborhoods using homogeneous variance measure.2.3 New Subband Adaptive Threshold
Selection of threshold is another critical issue in wavelet based denoising algorithms. If the threshold selected is too high, important image features are removed. If it is selected too low, then noisy pixels are not completely removed. Hence an optimal selection of threshold is therefore required. The wavelet coefficients can be modeled as GGD
variables. A Bayesian estimate is used for calculating the threshold. The proposed subband adaptive threshold used in this paper is defined as,
B j j
β
T
λ
=
(9) Where
β
jis the subband adaptation parameter given by,j
β
= Mj2 2 log
∗ (10)
Where M is the size of the subband and j is the current level of decomposition. The subband adaptation parameter β proposed here provides a better adaptability to the threshold at various levels of decomposition.
The threshold TBis defined as
(11)
Where is σn2 is the noise variance and 2
x
σ is
the signal variance and Yk is the absolute value of the wavelet coefficient k in the subband under consideration.
2.4 New Adaptive Thresholding Function The traditional hard and soft thresholding function proposed by Donoho were used in wavelet denoising for the past two decades along with other thresholding functions like semi soft, non- negative garrotte [9&10]. The traditional hard thresholding function kills too many wavelet coefficients, thereby introducing Gibb’s artifacts in the output image. The soft thresholding function introduces a fixed bias between the original and the denoised coefficients. Xiaogang Dong et al.,[8] proposed a new adaptive thresholding function to enhance the performance of noise removal by reducing the fixed bias of soft thresholding. The adaptive thresholding function [8] used is given below.
− − − − = j j k j k j k j k j w m W W W λ λ2 2 , , ,
, sgn( ) 1 exp
ˆ
j k j W
for ≥λ
,
=0 for Wj,k pλj (12) Where
W
j,kˆ
is the denoised coefficient,W
jk , is the noisy wavelet coefficient,λ
jis the subband806
∞
→
m
this function approaches the softthresholding function and if m→0 this function approaches hard thresholding function. By changing the value of m, effective thresholding function is obtained.
2.5 Proposed Denoising Scheme
The stepwise implementation of the above discussed procedure is given below.
Step 1: Decompose the input noisy image to L levels by applying stationary wavelet transform.
Step 2: Compute the noise variance using Equation 3
Step 3:Compute the inter scale dependency measure for each of the detail subbands LH, HL and HH at all levels using Equations(13) & (14)
Step4: Multiply each of the detail subbands at all levels by the corresponding measure computed in Step 3.
Step 5: Compute the measure of homogeneity using Equations (4) to (7)
Step 6: Estimate the signal variance as in Equation (8)
Step 7: Compute the threshold using Equations (9) to (11)
Step 8: Apply the adaptive thresholding function to estimate the noise free coefficients using Equation (12)
Step 9: Take inverse wavelet transform to reconstruct the image
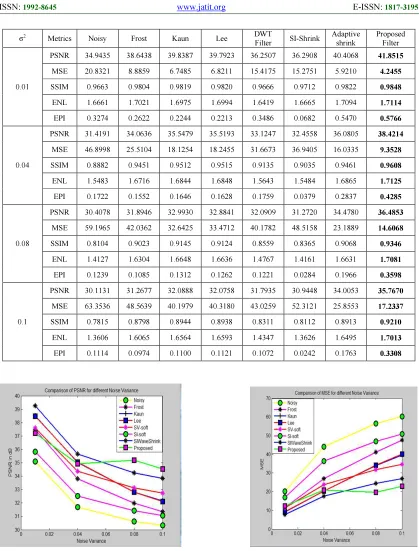
3. RESULTS
The performance of the proposed algorithm was verified using various performance metrics like, Peak Signal to Noise Ratio (PSNR), Mean Square error (MSE), Equivalent Number of Looks (ENL), Structural Similarity Index Measure (SSIM) and Edge Preservation Index (EPI).
[image:5.595.77.511.76.530.2]Clinical Ultrasound images were used for testing the proposed algorithm. Ultrasound images used in this experiment were obtained from Edapal Hospital, Kerala. The size of the images are 512 x 512 and are shown in figure 3 and figure 4. The performance of the proposed system is compared with standard speckle filters like, Frost, Kuan and Lee Filters, DWT based filter using Bayes threshold, Shift invariant filter using SWT and adaptive shrinkage technique in [8].
Figure 3: Input Ultrasound image1
Figure 4: Input Ultrasound image2
MATLAB simulations were carried out for different noise variances like 0.01, 0.04, 0.08 and 0.1.
Figure 5 shows the performance comparison of PSNR and MSE for ultrasound image2 with existing approaches.
[image:5.595.299.515.526.611.2]The algorithm was tested with different wavelet basis and is tabulated in table 3.
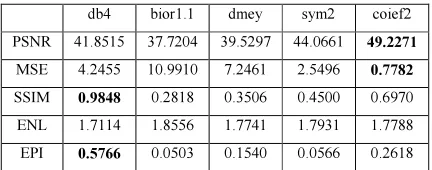
Table 1: Performance Comparison For Various Wavelets for Image 1 For Noise Variance 0.01
db4 bior1.1 dmey sym2 coief2
PSNR 41.8515 37.7204 39.5297 44.0661 49.2271
MSE 4.2455 10.9910 7.2461 2.5496 0.7782
SSIM 0.9848 0.2818 0.3506 0.4500 0.6970 ENL 1.7114 1.8556 1.7741 1.7931 1.7788
EPI 0.5766 0.0503 0.1540 0.0566 0.2618
Comparisons have been made with various wavelet basis functions like Coiflet, Daubechies, Symlets, Biorthogonal wavelets, Discrete approximation of Meyer wavelets in the proposed filter and the results are given in table 1. Table 2 gives the results of the proposed approach for different noise variances using db4 wavelet.
807
σ2 Metrics Noisy Frost Kaun Lee DWT
Filter SI-Shrink
Adaptive shrink
Proposed Filter
0.01
PSNR 34.9435 38.6438 39.8387 39.7923 36.2507 36.2908 40.4068 41.8515
MSE 20.8321 8.8859 6.7485 6.8211 15.4175 15.2751 5.9210 4.2455
SSIM 0.9663 0.9804 0.9819 0.9820 0.9666 0.9712 0.9822 0.9848
ENL 1.6661 1.7021 1.6975 1.6994 1.6419 1.6665 1.7094 1.7114
EPI 0.3274 0.2622 0.2244 0.2213 0.3486 0.0682 0.5470 0.5766
0.04
PSNR 31.4191 34.0636 35.5479 35.5193 33.1247 32.4558 36.0805 38.4214
MSE 46.8998 25.5104 18.1254 18.2455 31.6673 36.9405 16.0335 9.3528
SSIM 0.8882 0.9451 0.9512 0.9515 0.9135 0.9035 0.9461 0.9608
ENL 1.5483 1.6716 1.6844 1.6848 1.5643 1.5484 1.6865 1.7125
EPI 0.1722 0.1552 0.1646 0.1628 0.1759 0.0379 0.2837 0.4285
0.08
PSNR 30.4078 31.8946 32.9930 32.8841 32.0909 31.2720 34.4780 36.4853
MSE 59.1965 42.0362 32.6425 33.4712 40.1782 48.5158 23.1889 14.6068
SSIM 0.8104 0.9023 0.9145 0.9124 0.8559 0.8365 0.9068 0.9346
ENL 1.4127 1.6304 1.6648 1.6636 1.4767 1.4161 1.6631 1.7081
EPI 0.1239 0.1085 0.1312 0.1262 0.1221 0.0284 0.1966 0.3598
0.1
PSNR 30.1131 31.2677 32.0888 32.0758 31.7935 30.9448 34.0053 35.7670
MSE 63.3536 48.5639 40.1979 40.3180 43.0259 52.3121 25.8553 17.2337
SSIM 0.7815 0.8798 0.8944 0.8938 0.8311 0.8112 0.8913 0.9210
ENL 1.3606 1.6065 1.6564 1.6593 1.4347 1.3626 1.6495 1.7013
EPI 0.1114 0.0974 0.1100 0.1121 0.1072 0.0242 0.1763 0.3308
[image:6.595.89.508.108.659.2]
808
Noisy Image Frost Filter Kaun Filter Lee filter
[image:7.595.83.510.87.399.2]DWT Filter SIShrink Adaptive Shrink Proposed Filter
Figure 6: Visual Performance Comparison of The Proposed Filter With Different Filters
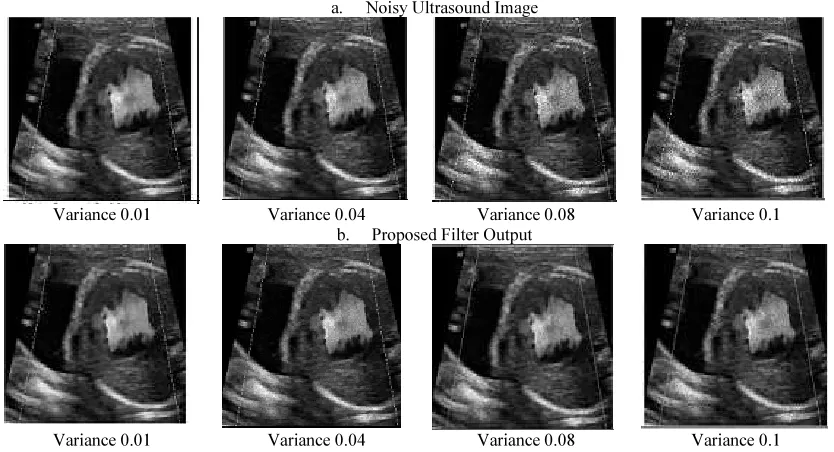
a. Noisy Ultrasound Image
Variance 0.01 Variance 0.04 Variance 0.08 Variance 0.1 b. Proposed Filter Output
Variance 0.01 Variance 0.04 Variance 0.08 Variance 0.1 Figure 7: Visual Quality Improvement Using Proposed Filter for Various Noise Variances
[image:7.595.86.503.433.659.2]809 4. DISCUSSION
From Table 1 it is seen that Coiflet gives high PSNR. But comparing the other performance indices like SSIM and EPI, db4 gives better result. The results generated in this experiment using dB4 are tabulated in Table2. From the results, the spatial domain filters like Frost, Kaun and Lee are good in removing speckle noise but lag in preserving the edges. The wavelet based filters can reduce speckles and increase PSNR while preserving fine details of the image. The subband adaptive filters reduce speckle and preserves the fine details as EPI is seen to be improved from Table 2. The performance analysis shows that on an average, PSNR is increased by 2.89%, MSE is reduced by 34%, SSIM is increased by 1.53%, ENL is increased by 2.53% and EPI is increased by 30% for the proposed Shift invariant modified adaptive wavelet shrinkage technique when compared with the existing SIWaveShrink technique [8]. From figure 6 & 7 it is seen that the visual quality of the images is significantly improved for the proposed denoising approach.
5. CONCLUSION
Thus the proposed approach yields an improved performance compared to the existing approaches. The selection of undecimated wavelet transform with the proposed subband adaptive threshold has increased the noise reduction ability of the filter. The estimation of weighted signal variance through a locally adaptive arbitrary window using homogeneity measure thus increases the PSNR value, as the arbitrary window gives a more accurate local statistics of the image compared to a local window. The proposed inter scale measure, helps to retain the important image features, and hence the edges and fine details are well preserved as seen from the results. Thus proposed filter performs comparatively better in terms of PSNR, preservation of edges and in visual quality.
REFERENCES
[1] Sudha.S, Suresh.G.R, Sukanesh.R, “Comparative study on Speckle Noise suppression techniques for Ultrasound Images”. International Journal of Engineering and Technology, Vol.1, No.5, 2009.
[2] David L Donoho, “De-noising by soft thresholding”, IEEE Transactions on Information Theory, Vol.41, No.3, 1995, pp:613–627.
[3] M. K. Mihcak, I. Kozintsev, and K. Ramchandran, “Spatially adaptive statistical
modeling of wavelet image coefficients and its application to denoisin”, Proc. IEEE Int. Conf. Acoustics, Speech, Signal Processing, No. 6, 1999, pp:3253-3256
[4] Il KyuEom and Yoo Shin Kim, “Wavelet-Based Denoising With Nearly Arbitrarily Shaped Windows”, IEEE Signal Processing Letters, Vol.11, No.12, 2004, pp:937-940
[5] Lei Zhanga, Paul Baob, XiaolinWuc, “Hybrid inter- and intra-wavelet scale image restoration”, Pattern Recognition, No. 36, 2003,pp:1737 – 1746
[6] Levent Sendur, and Ivan W. Selesnick, “Bivariate Shrinkage Functions for Wavelet-Based Denoising Exploiting Interscale Dependency”, IEEE Transactions On Signal Processing, Vol.50, No.11, 2002, pp:2744-2756
[7] U. D. Dwivedi, and S. N. Singh, “Enhanced Detection of Power-Quality Events Using Intra and Interscale Dependencies of Wavelet Coefficients”, IEEE Transactions On Power Delivery, Vol.25, No.1, 2010
[8] Xiwen Qin , Yang Yue, Xiaogang Dong, Xinmin Wang , ZhanSheng Tao, “An Improved Method of Image Denoising Based on Wavelet Transform”, International Conference on Computer, Mechatronics, Control and Electronic Engineering (CMCE) 24-26 Aug. 2010 doi: 10.1109/CMCE.2010.5610029 [9] Hong-Ye Gao and Andrew G. Bruce,
“Waveshrink With Firm Shrinkage”, Statistica Sinica,No. , 1997, pp7: 855-874
[10]Hong-Ye Gao, “Wavelet Shrinkage Denoising using the Non negative garrotte”, Journal of Computational and Graphical Statististics Vol.7, No.4, 1998, pp:469-488
[11]Alexandra Pizurica, Wilfried Philips, Ignace Lemahieu and Marc Acheroy, “Despeckling SAR Images Using Wavelets and A New Class Of Adaptive Shrinkage Estimators”,. Proceedings. International Conference on Image Processing , 7-10 Oct 2001. No. 2,
pp:233-236, 2001,
doi:10.1109/ICIP.2001.958467
[12]Paul Bao and Lei Zhang, “Noise Reduction for Magnetic Resonance Images via Adaptive Multiscale Products Thresholding”, IEEE Transactions On Medical Imaging, Vol.22, No.9, 200, pp:1089 – 1099
810 11-13 Dec. 2005 doi: 10.1109/INDCON.2005.1590117
[14]S. Grace Chang, Bin Yu, and Martin Vetterli, “Spatially Adaptive Wavelet Thresholding with Context Modeling for Image Denoising”, IEEE Transactions On Image Processing, Vol.9, No. 9, 2000, pp: 1522 - 1531