ISSN: 1992-8645 www.jatit.org E-ISSN: 1817-3195
INFORMATION-FUSION METHOD FOR URBAN TRAFFIC
FLOW BASED ON EVIDENCE THEORY COMBINING WITH
FUZZY ROUGH SET
1﹟
NING CHEN, 2﹟XING XU
1
Assoc. Prof., School of Mechanical and Automotive Engineering, Zhejiang University of Science and
Technology, HANGZHOU 310023, P.R.China
2 Asstt Prof., School of Mechanical and Automotive Engineering, Zhejiang University of Science and
Technology, HANGZHOU 310023, P.R.China
E-mail: [email protected], [email protected]
#
Joint first author: these authors contribute equally to this work.
ABSTRACT
The traffic detecting result is always short of accuracy by different kinds of individual sensors in urban China. A new information fusion approach is raised in this paper to solve the issue, based on fuzzy rough set theory combining with evidence theory. The method of attribute reduction has been improved based on rough set and it could consider the relation of attributes during reduction process. The essential probability function is obtained by the maximum fuzzy likelihood function that helps to diminish the effect of subjective factor. Furthermore, a new combination formula has been raised based on the Yager’s formulas. It can reduce the negative effect on fusion accuracy caused by the conflict of different evidences. Then, a new combination rule is given to dissolve the confliction among the traffic evidence data collected by different individual sensors. Finally, the experiment to fuse the traffic information from an intersection in Hangzhou City showed that the proposed approach could obtain a high accuracy.
Keywords: Information-Fusion, Urban Traffic Flow, Combination Rule; Information Confliction, Fuzzy
Likelihood, Combination Formula
1. INTRODUCTION
At present, there are several modes to collect traffic flow information data in urban China, such as loops, video detector, and dynamic OD analyzer. Because of their individual limitations, they might give the contradictory outcome each other and it is difficult to determine the credibility of the collected traffic data. Therefore, the multi-source information fusion method gets a wide application. For example, there have been classical fusion algorithms such as Kalman filter [1], Bayes reasoning [2]-[3], Fuzzy set theory[4]-[5]. Unfortunately, these kinds of algorithm lack capacities to figure out the conflict among the traffic flow message to be fused.
It is a relief that D-S evidence theory can fuse the uncertain message with unknown conditions by means of both trusted function and likelihood function coming from the essential probability function, and the fused outcome becomes more accurate [6]. However, to fuse the traffic data using D-S evidence theory, there are also several problems to be solved such as the traffic data
redundancy need be reduced, the essential probability formula of each evidence group should be extracted to avoid subjective effect like being assigned merely by the experts’ experience. Meanwhile, the conflicts of evidence should be figured out also. There probably exists the deficiency or difference among the data due to the failure of one or more sensors in a multi-sensor fusing system[7].
2. DATA PREPROCESSING BASED ON ROUGH SET
The fusion parameters of traffic flow are defined as follows: vehicular flux, lane occupancy ratio (
A
flu), average speed (B
ocp), queue length (C
spe),waiting time (Dseq), average traveling time (
E
tim).These parameters constitute vector x=(Aflu,Bocp,
, , , , )
spe seq tim dur
C D E F K , where K denotes the different collecting method.
The classical attribute reduction uses importance degree to describe the influence to decision attribute D after new attribute ‘a’ of condition attribute set C joined into reduction attribute set R. But it lacks consideration about the influence to set
R. Using dependent degree
k
abto judge whether the addition of the new attribute makes the certain ones of set R become unimportant is proposed in this paper. The algorithm as follows:Step 1:
Select condition attribute set
C A B C D
=
( ,
flu ocp,
spe,
seq,
,
)
tim dur
E F
, decision attributeD
=
K
. The current collecting data, historical data and sensor characteristic constitute the decision attribute table:· · ·
· · ·
· · ·
·
·
· ·
·
· ·
·
· 
1
1 1 1 1 1 1
1 1 flu ocp spe seq tim dur
i
i i i i i i
i flu ocp spe seq tim dur
n n n n n n n
n
flu ocp spe seq tim dur
D
A B C E F K
y
P y i A B C D E F K
y n
A B C D E F K
= =
M
M M M M M M M
M
M M M M M M M M M
( )
F X
= (1)
Where
1 1 1 1 1 1 1
1 flu ocp spe seq tim dur
i i i i i i i
flu ocp spe seq
i tim dur
n n n n n n n
n flu ocp spe seq tim dur
A B C D E F
x K
A B C D
X x E F K
x A B C D E F K
= =
is the original collected data set. In
(
,
,
flu ocp A B
F
=
f
f
,
,
,
, )
spe seq tim dur
C D E F
f
f
f
f
E
,each component expresses themapping from
x
i toy
i.Step 2:
In set C, if
∀ ∈
b
C
, select it as the original elements of set R.Step 3:
If
∀ ∈ ∧ ∉
a
C
a
R
, compute its importancedegree:
{ }
( ( )) ( ( ))
( , , )
( ) ( )
R a R
Card pos D Card pos D
SGF a R D
Card U Card U
= − .
If '
( , , ) max({ ( , , ) | })
SGF a R D = SGF a R D a∈C ,
and
∃ ∈
a
'C
: denoteR R
= ∪
{ }
a
' .Step 4:
Compute ' '
( )
'
(
( ))
( , )
( )
IND a a b
card POS
IND b
k
r a b
card U
=
=
for the new attribute
a
and∀ ∈
b
R
. If∃ ∈
b
'R
and ' ' '
'
max({ ( , ) | })
a b a b
k = k =r a b b∈R , delete the
attribute b temporarily from reduction set
R
. ThenR
is denoted asR
' (if the dependent degree are all equal, b’ is selected as the element which has the longest survival time in the set).Compute
SGF b R D
( ,
' ', )
. IfSGF b R D
( , , )
' '−
( , , )
SGF a R D
<
δ
(δ
is given in advance as thresholdvalue), do not delete attribute b from set
R
, and denoted asR
=
R
.Step 5:
Compute
γ
R( )
D
.Ifγ
R( )
D
=
γ
C( )
D
,R
satisfies the condition, then the calculation is over. Otherwise calculation turns to step 2.
3. CALCULATION ON ESSENTIAL
PROBABILITY FUNCTION BASED ON FUZZY LIKELIHOOD MEASUREMENT
To avoid the subjectivity while obtaining the essential probability function, this method is proposed base on fuzzy likelihood measure (case study of three collecting methods). The algorithm as follows:
Step 1:
ISSN: 1992-8645 www.jatit.org E-ISSN: 1817-3195 11 16 21 26 31 36 ij t t
Q t t t
t t = after attribute
reduction(i∈[1, 3],i∈Z j; ∈[1, 6],j∈Z). Where denotes the fuzzy membership function of the j-th traffic parameters which are collected by the j-th collecting methods respectively. Historical fusion data in the same condition are selected to be the basic traffic flow data, which are expressed as the fuzzy membership function of relevant attribute,
and denoted as
(
)
1, 2, , j
S= t t t ,
(
j
∈
[1, 6],
j
∈
Z
)
where
t
i is the fuzzy membership function ofrelevant attribute.
Step 2:
Matrix multiplication is defined as the fuzzy likelihood calculation between two fuzzy membership functions. So
11 1 16 6
21 1 26 6
31 1 36 6
3 6
( , )
( , )
( , )
( , )
( , )
( , )
( , )
ij j
t t
t t
M Q S
t t
t t
t t
t t
t t
ρ
ρ
ρ
ρ
ρ
ρ
ρ
×= • =
(i∈[1, 3],i∈Z j; ∈[1, 6], j∈Z) (2)
( , )t tij j p t(ij tj ) p A( (M N x)( )) sup min M x N xx { ( ), ( )}
ρ = ∩ ≠ ∅ = ≤ ∧ =
Where M x( )andN x( )are the relevant membership
functions of
t
ij andt
i .Step 3:
Compute the essential probability function of
M
divided by column to have normalization processing. The outcome is1 2 3
{( i , i , i ,
M= m m m
4) | [1, 6], }
i
m i∈ i∈Z , and each group is as follows:
1 1
1 2 3
2 2
1 2 3
3 3
1 2 3
4
1 2 3
( , ) ( ( , ) ( , ) ( , ) ( )) ( , ) ( ( , ) ( , ) ( , ) ( )) ( , ) ( ( , ) ( , ) ( , ) ( )) ( ) ( ( , ) ( , ) ( , ) ( )) i i i
i i i i i i i
i i i
i i i i i i i
i i i
i i i i i i i
i i
i i i i i i i
t t m
t t t t t t
t t m
t t t t t t
t t m
t t t t t t
m
t t t t t t
ρ
ρ
ρ
ρ
ρ
ρ
ρ
ρ
ρ
ρ
ρ
ρ
ρ
ρ
ρ
ρ
ρ
ρ
ρ
ρ
=
+ + + Θ
=
+ + + Θ
=
+ + + Θ
Θ =
+ + + Θ
1 2 3
( ( ) 1 max( ( , ), ( , ), ( , )),
[1, 6], )
i t ti i t ti i t ti i
i i Z
ρ
ρ
ρ
ρ
Θ = −
∈ ∈
(3) 1 i
m , mi2, mi3 and mi4 denote respectively the essential probability functions of the message collected by three collecting methods and the uncertain message.
4. CONFLICT SOLUTION OF THE
EVIDENCE COMBINATION
The disaccord to the real traffic scene may be occurred by the fused outcome if there is high conflict evidence, namely the conflict coefficient
1
k
→
. Yager has improved the D-S composite formula. And the new formula is as follows (two evidence sources):1)
m
( ) 0
∅ =
;2)
1 2
( )
( )
( ),
,
i j
i j
A B A
m A
m A m B
A
X
∩ =
=
∑
⋅
≠ ∅
3) 1 2 ( ) ( ) ( ) i j i jA B X
m X m A m B k
∩ =
=
∑
⋅ +( 1
( )
2( )
i j
i j A B
k
m A m B
∩ =∅
=
∑
⋅
) (4)Yager’s formula shows that if the conflict evidence can’t be resolved reasonably, it should be thrown into unknown field, but it will induce another issue. Although most of evidences have proved the conclusion is right, the combination outcome would be negative. Based on Yager’s formula, Sun Quan proposed an evidence combination formula which transforms the conflict by the credibility in the literature [8]. But this method ignores the evidence contribution to the combination outcome when computing the credibility of each group of conflict evidence[9].
In this paper we have improved the Yager evidence combination formula based on the literature [9], with the consideration about the credibility of group conflict evidence. The evidence credibility is used as proportional coefficient of the probability of the conflict evidence in the combination formula. The new evidence combination formula is as follows:
1)
m
( )
∅ =
0
;2)
m A
( )
=
p A
( )
+ ⋅
k q A A
( ),
≠ ∅
,
X
;3)
1
( )
( )
( )
(1
)
n
ij i
j i
m X
p X
k q X
k
ε
= ≤
=
+ ⋅
+ ⋅
∏
−
.
1
1 1 2 2
( ) ( ) ( ) ( ) i i n i i n n A F A A
p A m A m A m A
=
∈ =
=
∑
⋅ 1
( ) ( )
n
i i i
q A
β
m A=
=
∑
⋅(5)
The credibility between two evidences,
m
i andj
m
, is denoted asij
k
ij
e
ε
=
−(6)
That is decreasing function. The conflict magnitude between the two evidences is denoted as
( )
(
)
i j
ij i i j j
A A
k
m A
m A
∩ =∅
=
∑
⋅
(7)
The average credibility between evidence and other evidences is denoted as
1
1 1
n
i ij
j j i
n
α
ε
= ≠ =
−
∑
(8) The weight value of normalization is denoted as1 2 i i
n
α
β
α α
α
=
+ + +
(9)
It could be proved that
m A
( )
could be essential probability function, as there exists the belowconditions:
1)
m
( ) 0
∅ =
;2)
0
≤
m A
( ) 1
≤
;3)
( ) 1
A X
m A
⊂=
∑
(10)It is shown that the normalization credibility
β
iof the evidence in each group is used as the weight. It embodies fully the contribution degree of the evidence in each group to the combination outcome.
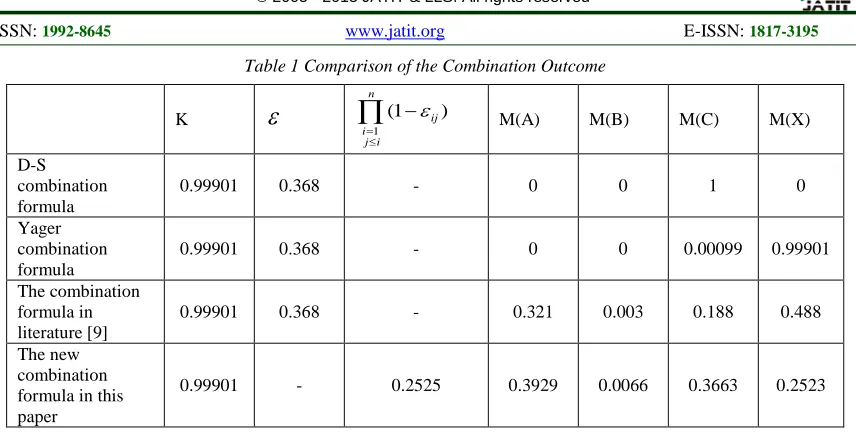
Table 1 shows the effect of the new combination formula of evidence theory.
1
:
1( ) 0.98,
1( ) 0.01,
1( ) 0.01
m m A
=
m B
=
m C
=
;2
:
2( )
0,
2( )
0.01,
2( )
0.99
m
m A
=
m B
=
m C
=
;3
:
3( )
0.9,
3( )
0,
3( )
0.1
m
m A
=
m B
=
m C
=
;The new combination formula could reduce uncertain probability caused by the conflict of different evidences. With fusing the essential probability functions obtained by fuzzy likelihood measure according the new combination formula, it
can acquire the better fusion outcome based on data filtering by maximum value.
5. APPLICATION
In the urban area of Hangzhou, the principle traffic data come from the sensors of loops, video detector, and dynamic OD analyzer. Here set Qingchun-Yan’an intersection, one intersection in the transportation grid, as an example to testify the above algorithms. The time slice (t) is 12:00:00 to 12:05:00 on Jan 1st, 2007 and the traffic data are derive from one lane. The historical fused data of three periods before the time (the period length is T) as the table 2 and table 3 shows. The number in the bracket is the data collecting mode. (‘-’denotes no data. In the bracket ‘1’ denotes loops, ‘2’ denotes video detector, ‘3’ denotes OD analyzer)
5.1 Attribute Reduction
The decision table is built based on the number of the collecting modes in the bracket. Condition attribute
C
=
(
A
flu,
B
ocp,
C
spe,
D
seq,
E
tim,
F
dur)
, decision attributeD
=
K
. The reduction process is according to the algorithm of attribute reduction inthis paper. Select
R
=
{
F
dur}
and1
6
δ
=
. Table 4shows the calculation steps of the algorithm. The final condition attribute is
{ ,
A E
flu tim}
.5.2 Fusion of the Traffic Data
1) The identification frame is
Θ =
{ , , }
X Y Z
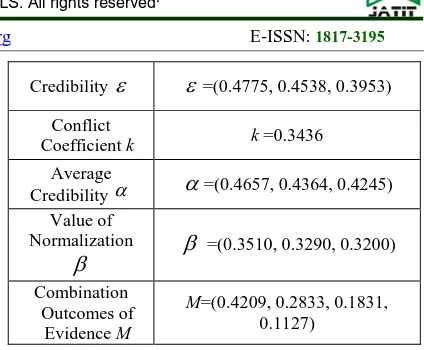
. (X, Y and Z denote the collected data of loops, video detector and OD analyzer). Compute the essential probability function. Table 5 shows the important parameters in this process.2) Based on the essential probability function and the new combination formula of evidence proposed in this paper, to get more credible fusion outcome. Table 6 shows the important parameters in the process.
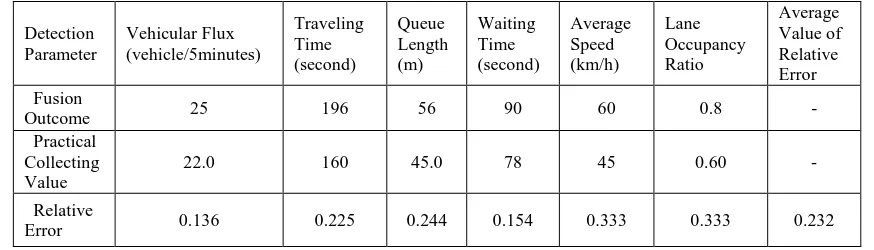
In table 7 the combination outcome of evidence shows that the traffic flow data which are collected by the loops have the maximal credibility. Table 8 shows the fusion outcomes, the practical data of the traffic flow which are collected by manual work in the same condition, the relative error and the average value of relative error of each traffic flow parameter.
ISSN: 1992-8645 www.jatit.org E-ISSN: 1817-3195
[image:5.612.314.526.63.238.2]to the below factors. The threshold value
δ
that affects the final outcome is obtained by human experience in table 4. Another one is that the variance of normal distribution is determined with the principle of 3σ
.Table 5 The Traffic Data After Treatment with Attribute Reduction
Flux
(vehicle/5minu tes)
Queue Length (m)
Average Speed (km/h)
Loops 11 - -
Video
Detector 36 30 36
OD
[image:5.612.93.302.188.295.2]Analyzer 15 - 48
Table 6 The Important Parameters in the Process
Key Parameter Value
Fuzzy Membership
Matrix
2
2 2 2
2 2
( 16) /18
( 25) /18 ( 56) /18 ( 60) /18
( 18) /18 ( 53) /18
0 0
0 x
x x x
x x
Q
e
e
e
e
e
e
− −
− − − − − −
− − − −
=
Benchmark Conversion
Matrix
2 2 2
( 20) /18 ( 60) /18 ( 56) /18
(
x,
x,
x)
S
=
e
− −e
− −e
− −Fuzzy Likelihood
Matrix
0.8 0 0 0.9 0.8 0.8 0.7 0 0.9
M Q S
= =
⋅
Vector of Essential Probability
Function
M
={(0.320,0.360,0.280,0.040),(0 ,0.800,0,0.200),(0,0.444,0.500,0.05 [image:5.612.95.300.319.533.2]6)}
Table 7 Combination Outcome with Maximal Credibility
Key Parameter Value
Conflict
Coefficient
κ
κ
=(0.7392, 0.7900, 0.9282)Credibility
ε
ε
=(0.4775, 0.4538, 0.3953)Conflict
Coefficient k k =0.3436
Average
Credibility α
α
=(0.4657, 0.4364, 0.4245) Value ofNormalization
β
β
=(0.3510, 0.3290, 0.3200)Combination Outcomes of
Evidence M
M=(0.4209, 0.2833, 0.1831, 0.1127)
6. CONCLUSION
The method of attribute reduction has been improved based on rough set and it could consider the relation of attributes during reduction process. The essential probability function is obtained by the maximum fuzzy likelihood function that helps todiminish the effect of subjective factor. Finally, a new combination formula has been raised based on the Yager’s formulas. It can reduce the negative effect on fusion accuracy caused by the conflict of different evidences. The experiment demonstrates that the proposed method is effective and practical to cope with issues such as urban traffic data fusion in urban Hangzhou.
ACKNOWLEDGMENT
This work is partially supported by National Natural Science Foundation of China(Grant No.61273240), and Key Project of Chinese Ministry of Education (Grant No.211070), and Zhejiang Provincial Natural Science Foundation of China (Grant No. LY12F03024).
Thanks for the suggestions of Prof. Hongzhao Dong at Zhejiang University of Technology.
Thanks for the suggestions of Miss Bingjing Xiang.
Table 1 Comparison of the Combination Outcome
K
ε
1
(1 )
n
ij i
j i ε
= ≤
−
∏
M(A) M(B) M(C) M(X)D-S combination formula
0.99901 0.368 - 0 0 1 0
Yager combination formula
0.99901 0.368 - 0 0 0.00099 0.99901
The combination formula in literature [9]
0.99901 0.368 - 0.321 0.003 0.188 0.488
The new combination formula in this paper
0.99901 - 0.2525 0.3929 0.0066 0.3663 0.2523
Table 2 Collected Data of Qingchun-Yan’An Intersection
Flux (vehicle/5mi nutes)
Traveling Time (second)
Queue Length (m)
Waiting Time (second)
Average Speed (km/h)
Lane Occupancy Ratio
Loops 16(1) - - - - 0.8(1)
Video
Detector 25(2) - 56(2) 90(2) 60(2) -
[image:6.612.97.525.66.287.2]OD Analyzer 18(3) 196(3) - - 53(3) -
Table 3 Historical Fusion Data of Qingchun-Yan’An Intersection at (t-T), (t-2t) and (t-3t)
Flux (vehicle/5mi nutes)
Traveling Time (second)
Queue Length (m)
Waiting Time (second)
Average Speed (km/h)
Lane Occupancy Ratio
t-T 20(1) 150(3) 60(2) 80(2) 56(3) 0.6(1)
t-2T 18(1) 160(3) 70(2) 150(2) 43(2) 0.7(1)
t-3T 16(3) 240(3) 40(2) 130(2) 30(3) 0.5(1)
Parameter
Method Method
ISSN: 1992-8645 www.jatit.org E-ISSN: 1817-3195
Table 4 The Attribute Reduction of Decision Table
Process Candidate Set SGF a R D( , , ) a k b
α
Rγ
R( )
D
γ
C( )
D
1
{
A B
flu,
ocp,
C
spe,
D
seq,
E
tim}
{ , , , , }4 3 3 3 46 6 6 6 6 flu
A
{ }
26 - -
{
A F
flu,
dur}
4
6 1
2
{
B
ocp,
C
spe,
D
seq,
E
tim}
1 1 1 2 { , , , }
6 6 6 6
E
tim{ }
1 1 ,
6 6
F
dur 26>δ
{ ,
A E
flu tim}
56 1
3
{
B
ocp,
C
spe,
D
seq,
F
dur}
1 1 1 {0, , , }
[image:7.612.91.528.299.424.2]6 6 6
C
spe{ }
0, 0 - -{ , , }
A C E
flu spe tim 1 1Table 8 The Fusion Outcome of the Traffic Flow Message
Detection Parameter
Vehicular Flux (vehicle/5minutes)
Traveling Time (second)
Queue Length (m)
Waiting Time (second)
Average Speed (km/h)
Lane Occupancy Ratio
Average Value of Relative Error Fusion
Outcome 25 196 56 90 60 0.8 -
Practical Collecting Value
22.0 160 45.0 78 45 0.60 -
Relative
Error 0.136 0.225 0.244 0.154 0.333 0.333 0.232
REFRENCES:
[1] Xie Wei, Ma Jiachen, and Yang Mingli, “Agent-oriented architecture for Intelligent service robot”, Proceedings of the 18th world congress on intelligent control and automation, New York, May 11-14,2012, pp 5964-5967 [2] Meng Xianrao, Bai Guanglai, and San Baogang,
Han Xinjie, “Application of Bayes date fusion on intelligent fault diagnosis in engine room”,
Journal of Dalian Maritime University, Vol.46, No.3, 2012, pp 179-191
[3] Brooks R. and Kaupp M.,“ORCA:a componment model and repository”, Software engineering for experiment robotics, Vol. 19, No. 4, 2011, pp 231-251.
[4] Cao Longbin and Dai Ruwei, “Fundamentals, Concepts, Analysis, Design and implementa-tion”, Beijing: Post &Telecom Press, June, 2012, China. pp 198-211.
[5] Bogler P.L. Shafer, “Dempster reasoning with applications to multisensor target identification system”, IEEE Trans System, Man and Cybernetics, SMC- 17, pp 968- 977.
[6] Carmine Grelle, Lucio Lppolito and Vincenzo Loia, “Agent-based architecture for designing hybrid control system”, Information Science , Vol.176, 2006, pp 1103-1130.
[7] Yavuz. H, “A new integrated approach to the conceptual design and development of an intelligent autonomous mobile robot”, Robotics and autonomous systems, Vol.11,No 1-2, 2007, pp 99-120,.
[8] Sun Quan, Ye Xiuqing and Gu Weikang, “A New Combination Rules of Evidence Theory”,
Acta Electronica Sinica., Vol. 39, No. 8, 2004, pp 611-628