7643
APPLICATION OF ARTIFICIAL NEURAL NETWORK FOR
POWER TRANSFORMER PEAK LOAD PREDICTION
1RAMADONI SYAHPUTRA, 2FEBRIAN DHIMAS SYAHFITRA, 3INDAH SOESANTI
1,2Department of Electrical Engineering, Faculty of Engineering,
Universitas Muhammadiyah Yogyakarta Jl. Ringroad Barat Tamantirto, Kasihan, Yogyakarta
INDONESIA 55183
3Department of Electrical Engineering and Information Technology, Faculty of Engineering,
Universitas Gadjah Mada
Jl. Grafika 2, Kampus UGM, Yogyakarta INDONESIA 55281
e-mail: [email protected]; [email protected]
ABSTRACT
Planning an electric power system is a very important task for electric power providers. Good and measurable planning will make the operation of the electric power system good, stable and highly reliable. One part of planning an electric power system is the forecast of future loads. Load estimates must be made as early as possible. The purpose of the peak load prediction is to anticipate the growth of the load in the future, so that the electricity provider company is ready with the condition of the electricity load that will occur in the next few years, where as long as this has not been done in many substations in Indonesia. In this study, a backpropagation neural network method for power transformers peak load forecasting has been proposed. The choice of backpropagation type is better accuracy of results than other types of neural networks. The case study of this study was Bumiayu Substation located in Brebes district, Central Java province, Indonesia. The parameters that are taken into account in electricity load forecasting are population growth data, Gross Regional Domestic Product (GRDP), and the data of peak load history of the Bumiayu substation. The results of the study have shown that the estimated electricity load in the next 10 years can still be served by two power transformers installed in Bumiayu Substation.
Keywords: Artificial Neural Network, Backpropagation, Peak Load Prediction, Power Transformer,
Substation.
1. INTRODUCTION
Electrical energy is energy that has a vital role in human life. Judging from the level of urgency, electrical energy can even be said to be primary energy in the present era [1]-[3]. Many sectors of human life are supported by this energy, ranging from domestic work, industry, commercial to public facilities. According to the 2016 Electricity Statistics data [4]-[7], PLN's 2015 electricity sales amounted to 202,845.82 GWh. Compared to 2014, sales of electricity increased by 4,244.04 GWh or 2.13%, consisting of sales for the industrial sector of 64,079.39 GWh, the household sector of 88,682.13 GWh, the commercial or business sector of 36,978.05 GWh and public or public sector of 13,106.25 GWh. The household sector has the biggest contribution to the sale of PLN electricity [8]. This is because population growth in Indonesia
7644 of electricity in Indonesia. Availability of sufficient electrical energy can affect the quality of life of the community, because from the functional side this electrical energy is used as an operational support for an industry or business entity, public facilities and even households [11]. It can be ascertained if the existing electrical energy is unable to meet the needs, economic growth will be hampered, and the level of community satisfaction in terms of electricity energy services will be reduced [12].
Electrical energy cannot be stored on a large scale, therefore this energy must be provided when needed. As a result, problems arise in the face of the need for electricity that is not fixed from time to time, how to operate an electric power system that can always meet the power demand at any time, with good quality. If the power delivered from generating buses is far greater than the demand on load buses, it will result in a power loss [13]-[14]. Whereas if the power generated and delivered is lower or does not meet the needs of the consumer, there will be a local blackout on the load buses, which consequently is detrimental to the consumer.
In distributing electrical energy, there is a substation that functions as a regulator of the flow of electrical power to be distributed to customers. Inside the substation there is a main component that is a power transformer that functions to transform electrical power by changing the working voltage of the system [15]. The capacity of a substation power transformer needs to be considered and considered, it aims to be able to reach the power transformer power capability in meeting the electricity needs of consumers [16]. If the load borne by the power transformer is greater, the longer the load borne will exceed the transformer capacity. This will cause the transformer to overload, and will have an impact on decreasing the quality of electrical energy services to customers. On the basis of fulfilling electrical energy in accordance with the needs and having good quality of service, the provider of electrical energy must have an estimated peak load of the transformer in the future. This is useful to reach the transformer capability in the next few years and also the provider of electrical energy can do early anticipation for the possibility of replacing new transformers. Therefore, it is necessary to forecast the transformer peak load
One method of forecasting is artificial neural networks (ANN) [17]. ANN is a system that is based on the way the human neural network works. One type of ANN is backpropagation, this type is chosen because when the output is not the same as
the expected target, the output will be propagated backwards in the hidden layer to be forwarded to the input layer, so there will be feedback to validate the ANN output [18].
The purpose of this study was to determine the procedure for the formation of Backpropagation type Neural Networks for peak load forecasting of the Bumiayu substation transformer. Another goal is to design, build, and analyze the model of peak load transformer based on GUI Matlab using Backpropagation type Neural Networks. The benefits expected in this study are to obtain a model of electric load forecasting that can be used as input material and consideration for companies providing electricity energy, so that forecasting data can be used as a reference for meeting the availability of electricity, operational budgets and expansion plans for substations. This research is also expected to be a reference and reference material for those who want to conduct a deeper study of forecasting techniques, especially the transformer peak load prediction. This research is very useful for electricity companies to plan the procurement and installation of power transformers in order to anticipate the growth of electrical loads.
2. BACKPROPAGATION NEURAL
NETWORKS
2.1 Artificial Neural Network
Artificial neural network (ANN) is an artificial intelligence system with the ability to learn and gather knowledge of learning outcomes in its cell network (neurons) so as to enable the network as a whole to be more intelligent in responding to the input provided. The ability to learn and accumulate this knowledge allows artificial neural network systems to adapt to the environment that provides input to them [19]. Like the human brain in responding to different environmental conditions, the role of ANN in the field of research and development is very important in the future that demands aspects of automation and interactive aspects between tools and people. Artificial neural network system is determined by three things, namely the pattern of inter-neuron relations or commonly called network architecture, the method for determining the linking weight (called the training or learning method), and the activation function.
7645 following layers. Information will be propagated from one layer to the next, starting from the input layer to the output layer through the hidden layer.
2.2 Backpropagation Mathod
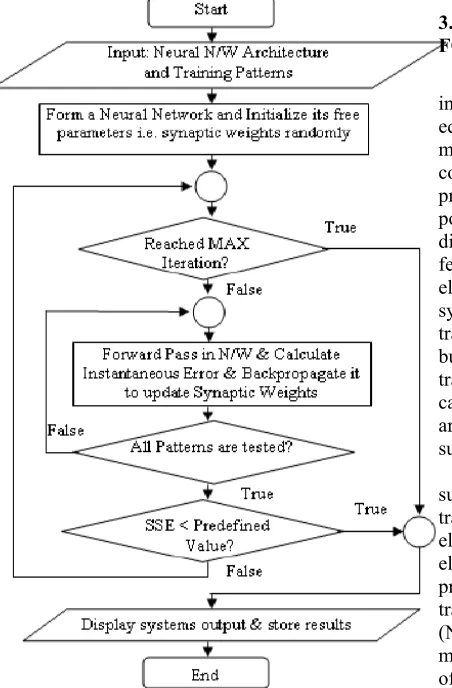
Backpropagation is a supervised learning algorithm and is usually used by many layers of perceptrons to change the weights connected to the neurons in the hidden layer [19]. The backpropagation algorithm uses an error output to change its weight value is backward. To get this error, the forward propagation stage must be done first. Figure 1 shows the flowchart of backpropagation neural network algorithm.
Figure 1. Flowchart of backpropagation neural network algorithm
This algorithm is referred to as back propagation because when an ANN is given an input pattern as a training pattern, the pattern goes to units in the hidden layer to be forwarded to the output layer
units [20]. Thus the output layer units provide a response called ANN output. When the ANN output is not the same as the expected output, the output will be propagated backward on the hidden layer forwarded to the unit in the input layer. Therefore the training mechanism is called backpropagation. Backpropagation has several units that are in one or more hidden layers. In backpropagation, the activation function used must fulfill several conditions, namely: continuous, differentiable easily and is a function that does not go down. One function that fulfills these three conditions so that they are often used is a binary sigmoid function that has a range (0, 1), which was used in this study.
3. POWER TRANSFORMER LOAD FORECASTING IN A SUBSTATION
The substation can be defined as an electrical installation composed of several electrical equipment that serves to transform high voltage to medium voltage electricity, as a measurement, control of operations and the implementation of the protection function of the system, and regulating power to other substations through high voltage and distribution transformers through medium voltage feeders [21]-23]. In other terms the substation is an electrical energy collection station of a generating system or transmission system consisting of power transformers, power breakers, separation switches, bus stations, current limiting reactors, current transformers, voltage transformers, coupling capacitors, voltage transformers capacitor, lightning arrester, protection relay, battery, and other supporting devices.
One of the most important equipment at the substation is a power transformer [24]. Power transformer is a device that is used to transform electrical power by increasing or decreasing the electrical voltage, but with a fixed frequency on the primary side and secondary side. In this power transformer there is a Neutral Current Transformer (NCT) which functions as earth fault protection by measuring the current flowing in the neutral point of the power transformer [25].
[image:3.612.94.320.279.623.2]7646 transformer is said to carry a light load. If the power transformer is loaded with 80% - 100% of its capacity then the transformer is said to carry heavy loads. Furthermore, if the power transformer is loaded > 100% of its capacity, the transformer is said to be overloaded. Figure 2 shows a 60 MVA power transformer in Bumiayu substation, Indonesia, which is used as a case study in this research.
Figure 2. A 60 MVA power transformer in Bumiayu substation, Indonesia
Based on the nature of the data used as the object of forecasting, the prediction is broadly divided into qualitative and quantitative. Qualitative forecasting relates to data that is not numerical or is more of a statement or opinion. While quantitative forecasting based on measurements uses numerical data.
Transformer load forecasting can be categorized as quantitative forecasting. Whereas, this quantitative forecasting can be applied if the following three conditions are met:
1. Information about the past is available 2. The information can be quantified in the
form of numerical data
3. It can be assumed that some aspects of past patterns will continue in the future.
More referring to quantitative forecasting, this method has 2 main forecasting models, namely the periodic series model and the causal model.
1. In the periodic series model, future estimates are carried out based on past values of a variable and / or past errors. It
aims to be able to find patterns in the series of historical data and extrapolate the pattern into the future.
2. In the causal model, the predicted factors indicate a causal relationship with one or more independent variables. The purpose of this causal model is to find the form of the relationship and use it to predict the future value of the dependent variable.
Both of the above models have their own advantages depending on certain conditions. This periodic series model is good for forecasting. Whereas the causal model can be used with greater success for decision making and wisdom.
In the field of electric power, forecasting is usually in the form of load forecasting including peak load forecasting (MW) and forecasting electrical energy requirements (MWh). Forecasting based on the time span can be grouped into three categories, namely short term, medium term and long term, respectively. The results of this forecasting can be used as consideration for making a plan to fulfill the availability of electricity and the development of electricity supply that is suitable for the needs of the next few years.
In general, forecasting methods that are often used by providers of electricity are divided into 5, namely:
1. Analytical method (End Use), this method is prepared based on data analysis of the end use of electricity by customers
2. Econometric method, this method is arranged based on economic and statistical principles.
3. Time series method, this method is arranged based on historical data relations. Where this is based on the fact that the events / data that have occurred will repeat again with the same pattern.
4. Combined method, this method is composed of several methods (usually a combination of analytical and econometric). This method considers more variables that can affect forecasting outcomes such as economic activity, technological progress, government policies, social and demographic activities.
7647 In this study the load forecasting method used is an artificial intelligence-based method that is backpropagation type neural network.
4. RESULTS AND DISCUSSION
In this study, the main object chosen as the study site was Bumiayu Substation located on Jalan Raya Paguyangan Bumiayu, Brebes district, Central Java Province, Indonesia. Bumiayu Substation is one of the substations owned by PT. PLN UPJ Bumiayu. Bumiayu substation has been interconnected with several other substations such as Kebasen substation, Balapulang substation and Kalibakal substation. It is intended that each of the substations back up each other's electrical power if there is interference with one of the feeders at the relevant substation.
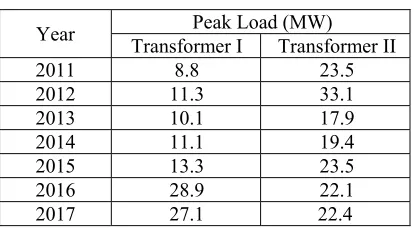
[image:5.612.315.522.395.568.2] [image:5.612.92.299.538.652.2]Bumiayu Substation has two power transformers, i.e. Transformer 1 60 MVA 150/20 KV capacity and 30 MVA 150/20 KV Transformer II. Previously Transformer 1 only had a capacity of 16 MVA until in 2016 it was changed to a transformer with a capacity of 60 MVA. Transformer transformations that take place take 3 months and during that time the temporary load gets supply from the mobile power transformer. In addition to Bumiayu Substation, the data in this study were also obtained from the Central Statistics Agency of Brebes district. The agency is the body responsible for population data in Brebes district, province of Central Java, Indonesia. Data obtained from the agency is the population growth data and Gross Regional Domestic Product (GRDP) for each year, from 2011 to 2017. The power transformer peak load data at Bumiayu Substation is shown in Table 1.
Table 1. Peak load at Bumiayu substation
Year Transformer I Peak Load (MW) Transformer II 2011 8.8 23.5 2012 11.3 33.1 2013 10.1 17.9 2014 11.1 19.4 2015 13.3 23.5 2016 28.9 22.1 2017 27.1 22.4
The formation of this forecasting model requires several variables that can affect the value of transformer peak load forecasting in the next few years. Therefore, demographic data is needed in Brebes district, Central Java province. This demographic data consists of population growth
data and Gross Regional Domestic Product (GRDP) of Brebes district. This data was obtained from the Brebes district Statistics Agency. Population data of Brebes district is shown in Table 2.
Table 2. Population data of Brebes district
Year (in trillion GRDP rupiah)
Population (in million)
2011 20.16 1.74 2012 22.90 1.74 2013 24.67 1.75 2014 27.44 1.76 2015 30.90 1.77 2016 34.45 1.78 2017 37.34 1.79
Based on population data as listed in Table 2, it can be assumed that the increase in population and GRDP for Brebes district can be made. The assumption of an increase in population and GRDP for Brebes district is shown in Table 3.
Table 3. Assumption of an increase in population and GRDP for Brebes district
Year (in trillion GRDP rupiah)
Population (in million)
2017 41.39 1.79 2018 45.88 1.80 2019 50.85 1.81 2020 56.36 1.81 2021 62.47 1.82 2022 69.24 1.82 2023 76.75 1.83 2024 85.07 1.83 2025 94.29 1.84 2026 104.51 1.84 2027 115.84 1.85
7648 divided into 2, namely the service area of transformer 1 and transformer 2. After calculation, that of 59.9% of the population of the Bumiayu Substation area is supplied by power transformer 2 and 40.1% of the population is supplied by power transformer 1.
Furthermore, data processing is carried out in accordance with the procedure for the formation of backpropagation type neural networks. As previously mentioned, the data consists of 7 types which refer to the highest peak transformer load every year from 2011 to 2017. However, the input pattern made reach 7 patterns. This is because the X5 input is taken from the peak load figure of the
previous year. Besides input X5, the input also
consists of X1, X2, X3, X4 with target T. Data
[image:6.612.315.519.198.398.2]processing of power transformer 1 is shown in Table 4 while data processing of power transformer 2 is shown in Table 5.
Table 4. Data processing of power transformer 1
Year
Input Data
Target X1 X2 X3 X4 X5
[image:6.612.89.300.341.462.2]2011 2.16 2.46 1.86 1.87 8.82 11.31 2012 2.46 2.65 1.87 1.88 11.31 10.13 2013 2.65 2.94 1.88 1.89 10.13 11.12 2014 2.94 3.32 1.89 1.90 11.12 13.34 2015 3.32 3.70 1.90 1.91 13.34 28.91 2016 3.70 4.01 1.91 1.92 28.91 28.91 2017 3.71 4.02 1.92 1.93 27.15 27.15
Table 5. Data processing of power transformer 2
Year
Input Data
Target X1 X2 X3 X4 X5
2011 3.32 3.67 2.78 2.79 23.51 33.14 2012 3.67 3.95 2.79 2.81 33.14 17.92 2013 3.95 4.40 2.81 2.83 17.92 19.43 2014 4.40 4.95 2.83 2.85 19.43 23.51 2015 4.95 5.52 2.85 2.86 23.51 22.13 2016 5.52 5.92 2.86 2.88 22.13 24.16 2017 5.92 6.41 2.88 2.91 24.16 25.11
In order to form a network model in the ANN algorithm, the data contained in Table 4 and Table 5 are used as input data for artificial neural networks. The network formed in this study is a multilayer network consisting of 1 input layer, 2 hidden layers and 1 output layer. A good network model for transformers1 and transformers2 is a network that has a high level of network accuracy.
This level of accuracy is obtained by doing many variations of the number of hidden layers and the number of neurons in each hidden layer. Then it was found that a good network model for this study was a network model consisting of 30 neurons in the first hidden layer and 10 neurons in the second hidden layer, as can be shown in Figure 3.
Figure 3. Multilayer network consisting of 1 input layer, 2 hidden layers and 1 output layer
Network training in this study takes into account the learning rate (α) parameter. The default value of this understanding rate is 0.01. The greater the value of α, the faster the training process will be. But if α is too large, the algorithm becomes unstable and reaches the local minimum point. In addition to the understanding rate, the other parameters used are momentum (mc). The momentum referred to is the momentum used to make weight changes based on the direction of the last pattern gradient and the previous pattern. The value of momentum used in this study is 0.8. After the training parameters are set, the training data that has been normalized will be carried out by the training command.
[image:6.612.88.300.488.614.2]7649 Or if the three previous conditions are not met, then the training will stop when it reaches the validation checks.
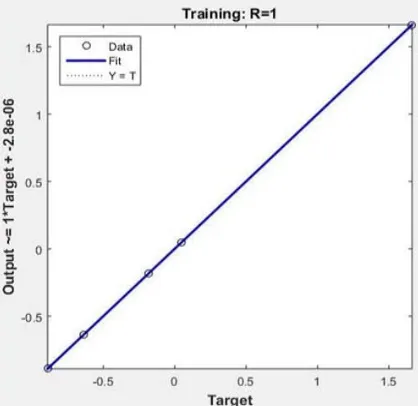
[image:7.612.312.522.220.422.2]Based on the network training process for power transformer 1, it was obtained that the change in network weight and bias for power transformer 1 was stopped at 113 iterations. This is because the training process has achieved its objective performance function which is to produce a goal performance value of 9.23e-10, where the value is smaller than the set goal performance parameter, which is 1e-09. Network training regression chart for power transformer 1 is shown in Figure 4.
Figure 4. Network training regression chart for power transformer 1
Based on the graph in Figure 4, it can be seen that the training on the network for power transformer 1 has a correlation coefficient (R) that is worth 1. This shows that the training that has been done has produced very good parameters. This correlation coefficient is obtained based on the linear regression plot mechanism. After the training process, then curve matching is done to compare the suitability between the network outputs with the training target. From the results of this curve matching, the "an" variable is obtained which is the result of the normalization. De-normalization is the process of returning normalized data to the original data.
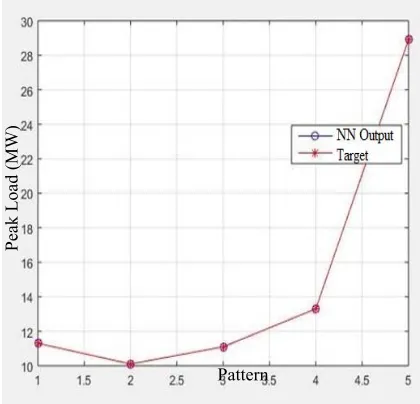
Furthermore, a comparison is made between the target value and the network training output presented in the form of array (H). In addition, MSE1 values are also shown which are obtained from the average square of the difference between
[image:7.612.91.297.256.456.2]the target and the network output in the training process. The comparison results show that the target value with network training output has a similar value, even the difference in value between the two input patterns is almost 0. The MSE training value generated on the network for power transformer 1 is 5.7446e-08. The results of this comparison are presented in graphical form as shown in Figure 5.
Figure 5. Comparison between training output and target for power transformer 1
Furthermore, based on the network training process for power transformer 2, it was obtained that the change in network weight and bias for power transformer 1 was stopped at 67 iterations. This is because the training process has achieved its objective performance function which is to produce a goal performance value of 9.43e-10, where the value is smaller than the set goal performance parameter, which is 1e-09. Network training regression chart for power transformer 1 is shown in Figure 6.
Based on the graph in Figure 6, it can be seen that the training on the network for power transformer 2 has a correlation coefficient (R) that is worth 1. This shows that the training that has been done has produced very good parameters. This correlation coefficient is obtained based on the linear regression plot mechanism. After the training process, then curve matching is done to compare the suitability between the network outputs with the training target. From the results of this curve matching, the "an" variable is obtained which is the
Pattern
Peak Lo
ad (M
W
7650 result of the normalization. De-normalization is the process of returning normalized data to the original data.
Figure 6. Network training regression chart for power transformer 2
Figure 7. Comparison between training output and target for power transformer 2
Furthermore, a comparison is made between the target value and the network training output presented in the form of array (H). In addition, MSE1 values are also shown which are obtained from the average square of the difference between the target and the network output in the training process. The comparison results show that the
[image:8.612.314.527.233.597.2]target value with network training output has a similar value, even the difference in value between the two input patterns is almost 0. The MSE training value generated on the network for power transformer 2 is 3.3414e-08. The results of this comparison are presented in graphical form as shown in Figure 7.
Table 6. Results of peak load prediction of power transformer 1
Year
Output Data Peak load (MW) X1 X2 X3 X4 X5
[image:8.612.92.300.389.598.2]2018 4.01 4.44 1.92 1.92 27.11 28.27 2019 4.44 4.92 1.92 1.92 28.27 29.14 2020 4.92 5.45 1.92 1.92 29.14 31.21 2021 5.45 6.05 1.92 1.93 31.21 31.27 2022 6.05 6.70 1.93 1.93 31.27 31.92 2023 6.70 7.43 1.93 1.93 31.92 32.09 2024 7.43 8.23 1.93 1.93 32.09 32.26 2025 8.23 9.13 1.93 1.94 32.26 33.52 2026 9.13 10.11 1.94 1.94 33.52 33.43 2027 10.12 11.21 1.94 1.94 33.43 33.39
Figure 8. Results of peak load prediction of power transformer 1
The results of the prediction of peak load for power transformer 1 are shown in Table 6 and the graph in Figure 8. Can be seen in Table 6 and Figure 8 which shows that the predicted peak load for power transformer 1 experiences an increase trend every year. This is directly proportional to the increase in GRDP value and the number of people served by power transformer 1. In 2027, the
Pattern
Peak Lo
ad (M
W
7651 predicted power transformer 1 peak load was 33.39 MW. This figure reaches 55.65% of the capacity for power transformer 1, and can be categorized as a light standard for the load of a power transformer.
Table 6. Results of peak load prediction of power transformer 2
Year
Output Data Peak load (MW) X1 X2 X3 X4 X5
2018 5.98 6.32 2.86 2.87 22.41 21.44 2019 6.63 7.35 2.87 2.87 21.44 20.93 2020 7,35 8.15 2.87 2.87 20.93 20.92 2021 8.15 9.03 2.87 2.88 20.92 21.44 2022 9.03 10.01 2.88 2.88 21.44 22.06 2023 10.01 11.11 2,88 2.89 22.06 22.41 2024 11.11 12.30 2.89 2.89 22.4 22.52 2025 12.30 13.63 2.89 2.89 22.52 22.75 2026 13.63 15.11 2.89 2.90 22.75 22.95 2027 15.11 16.75 2.90 2.91 22.95 23.19
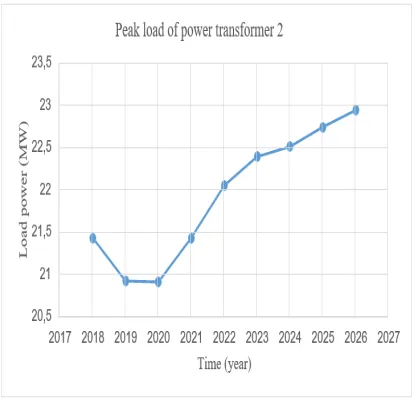
Figure 8. Results of peak load prediction of power transformer 2
The results of the prediction of peak load for power transformer 2 are shown in Table 7 and the graph in Figure 9. Can be seen in Table 7 and Figure 9 which shows that the predicted peak load for power transformer 2 experiences an increase trend every year. This is directly proportional to the increase in GRDP value and the number of people served by power transformer 2. In 2027, the predicted power transformer 2 peak load was 23.17
MW. This figure reaches 77.23% of the capacity for power transformer 2, and can be categorized as a reasonable standard for the load of a power transformer.
CONCLUSION
In this study, the peak load of power transformers was predicted using backpropagation type neural network method. The results of predictions that have been made for the period from 2018 to 2027 indicate a trend of peak load increases every year. In 2027, the predicted peak load of the transformer was 33.39 MW, equivalent to 55.65% of the capacity of power transformer 1, and could be categorized as a standard lightweight transformer load. Also in 2027, the peak load for power transformer 2 is predicted to be 23.17 MW, equivalent to 77.23% of the capacity of power transformer 2, and can be categorized as an optimal standard transformer load. Based on the results of this study it has been shown that until 2027 the power transformer I and power transformer II can still serve peak loads, because it still has not reached 80% of the maximum capacity of the two power transformers.
ACKNOWLEDGEMENTS
The authors gratefully acknowledge the contributions of the Directorate General of Development and Research Enhancement, Ministry of Research, Technology and Higher Education of the Republic of Indonesia, for funding this research.
REFRENCES:
[1] Syahputra, R., Soesanti, I., Ashari, M. (2016). Performance Enhancement of Distribution Network with DG Integration Using Modified PSO Algorithm. Journal of Electrical Systems (JES), 12(1), pp. 1-19.
[2] Syahputra, R., Robandi, I., Ashari, M. (2015). Performance Improvement of Radial Distribution Network with Distributed Generation Integration Using Extended Particle Swarm Optimization Algorithm. International Review of Electrical Engineering (IREE), 10(2). pp. 293-304.
[image:9.612.90.299.376.577.2]7652 Engineering (ICITACEE) 2014, UNDIP Semarang, pp. 404 - 408.
[4] Syahputra, R., Robandi, I., Ashari, M. (2015). Reconfiguration of Distribution Network with DER Integration Using PSO Algorithm. TELKOMNIKA, 13(3). pp. 759-766.
[5] Syahputra, R., Soesanti, I. (2017). Application of Fuzzy Multi-Objective Method for Distribution Network Reconfiguration with Integration of Distributed Generation. Journal of Theoretical and Applied Information Technology (JATIT), 95(23), pp. 6668-6677. [6] Syahputra, R., Soesanti, I. (2016). Design of
Automatic Electric Batik Stove for Batik Industry. Journal of Theoretical and Applied Information Technology (JATIT), 87(1), pp. 167-175.
[7] Soesanti, I., Syahputra, R. (2016). Batik Production Process Optimization Using Particle Swarm Optimization Method. Journal of Theoretical and Applied Information Technology (JATIT), 86(2), pp. 272-278. [8] Syahputra, R., Robandi, I., Ashari, M. (2015).
PSO Based Multi-objective Optimization for Reconfiguration of Radial Distribution Network. International Journal of Applied Engineering Research (IJAER), 10(6), pp. 14573-14586.
[9] Syahputra, R., Robandi, I., Ashari, M. (2014). “Optimal Distribution Network Reconfiguration with Penetration of Distributed Energy Resources”, Proceeding of 2014 1st International Conference on Information Technology, Computer, and Electrical Engineering (ICITACEE) 2014, UNDIP Semarang, pp. 388 - 393.
[10]Syahputra, R., Robandi, I., Ashari, M. (2014). Optimization of Distribution Network Configuration with Integration of Distributed Energy Resources Using Extended Fuzzy Multi-objective Method. International Review of Electrical Engineering (IREE), 9(3), pp. 629-639.
[11]Syahputra, R., Soesanti, I. (2016). DFIG Control Scheme of Wind Power Using ANFIS Method in Electrical Power Grid System. International Journal of Applied Engineering Research (IJAER), 11(7), pp. 5256-5262. [12]Jamal, A., Suripto, S., Syahputra, R. (2015).
Multi-Band Power System Stabilizer Model for Power Flow Optimization in Order to Improve Power System Stability. Journal of Theoretical and Applied Information Technology (JATIT), 80(1), pp. 116-123.
[13]Syahputra, R., Soesanti, I. (2015). Power
System Stabilizer model based on Fuzzy-PSO for improving power system stability. 2015 International Conference on Advanced Mechatronics, Intelligent Manufacture, and Industrial Automation (ICAMIMIA), Surabaya, 15-17 Oct. 2015 pp. 121 - 126. [14]Syahputra, R. (2017). Distribution Network
Optimization Based on Genetic Algorithm. Jurnal Teknologi, Journal of Electrical Technology UMY (JET-UMY), 1(1), pp. 1-9. [15]Syahputra, R., Robandi, I., Ashari, M., (2012),
“Reconfiguration of Distribution Network with DG Using Fuzzy Multi-objective Method”, International Conference on Innovation, Management and Technology Research (ICIMTR), May 21-22, 2012, Melacca, Malaysia.
[16]Syahputra, R., Wiyagi, R.O., Sudarisman. (2017). Performance Analysis of a Wind Turbine with Permanent Magnet Synchronous Generator. Journal of Theoretical and Applied Information Technology (JATIT), 95(9), pp. 1950-1957.
[17]Cecati, C., Kolbusz, J., Różycki, P., Siano, P., Wilamowski, B.N. (2015). “A Novel RBF Training Algorithm for Short-Term Electric Load Forecasting and Comparative Studies”, IEEE Transactions on Industrial Electronics, Vol. 62, No. 10, pp. 6519 – 6529.
[18]Quan, H., Srinivasan, D., Khosravi, A. (2014). “Short-Term Load and Wind Power Forecasting Using Neural Network-Based Prediction Intervals”, IEEE Transactions on Neural Networks and Learning Systems, Vol. 25, No. 2, pp. 303 – 315.
[19]Li, B., Zhang, J., He, Y., Wang, Y. (2017). “Short-Term Load-Forecasting Method Based on Wavelet Decomposition With Second-Order Gray Neural Network Model Combined With ADF Test", IEEE Access, Vol. 5, pp. 16324 - 16331.
[20]Khodayar, M., Kaynak, O., Khodayar, M.E. (2017). “Rough Deep Neural Architecture for Short-Term Wind Speed Forecasting”, IEEE Transactions on Industrial Informatics, Vol. 13, No. 6, pp. 1647 – 1654.
[21]Syahputra, R., Soesanti, I. (2016). Application of Green Energy for Batik Production Process. Journal of Theoretical and Applied Information Technology (JATIT), 91(2), pp. 249-256. [22]Syahputra, R. (2016). Application of
7653 [23]Jamal, A., Syahputra, R. (2016). Heat
Exchanger Control Based on Artificial Intelligence Approach. International Journal of Applied Engineering Research (IJAER), 11(16), pp. 9063-9069.
[24]Syahputra, R., Soesanti, I. (2016). An Optimal Tuning of PSS Using AIS Algorithm for Damping Oscillation of Multi-machine Power System. Journal of Theoretical and Applied Information Technology (JATIT), 94(2), pp. 312-326.
[25]Syahputra, R., Soesanti, I. (2016). Power System Stabilizer Model Using Artificial Immune System for Power System Controlling. International Journal of Applied Engineering Research (IJAER), 11(18), pp. 9269-9278. [26]Syahputra, R., Suripto, S., Soedibyo, Soesanti,