5172
A SELF-ORGANIZING MAP ALGORITHM USING ONLY A
TESTING DATA SET WITH THE ONE-DIMENSIONAL
VECTORS AND AN ODDS RATIO COEFFICIENT FOR
ENGLISH SENTIMENT CLASSIFICATION IN A PARALLEL
SYSTEM
1DR.VO NGOC PHU, 2VO THI NGOC TRAN
1Nguyen Tat Thanh University, 300A Nguyen Tat Thanh Street, Ward 13, District 4, Ho Chi Minh City,
702000, Vietnam
2School of Industrial Management (SIM), Ho Chi Minh City University of Technology - HCMUT,
Vietnam National University, Ho Chi Minh City, Vietnam
E-mail: 1[email protected], [email protected], 2[email protected]
ABSTRACT
Many different approaches have already been studied for sentiment classification for many years because It has been significant in everyday life, such as in political activities, commodity production, and commercial activities. A new model using an unsupervised learning for big data sentiment classification has been proposed in this survey. We have used a Self-Organizing Map Algorithm (SOM) to cluster all sentences of one document of the testing data set comprising 8,500,000 documents, which are the 4,250,000 positive and the 4,250,000 negative in English, into either the positive polarity or the negative polarity certainly. In this survey, we do not use any data sets. We do not any one-dimensional vectors based on a vector space modeling (VSM). We also do not use any multi-dimensional vectors based on the VSM. We only use many one-dimensional vectors based on many sentiment lexicons of our basis English sentiment dictionary (bESD). The valences and the polarities of the sentiment lexicons of the bESD are calculated by using An Odds Ratio Coefficient (ORC) through a Google search engine with AND operator and OR operator. We also do not use many multi-dimensional vectors based on the sentiment lexicons of the bESD. With one document of the testing data set, the SOM is used to cluster all the sentences of this document into either the positive or the negative on a map. The sentiment classification of this document is identified based on this map completely. We have tested the proposed model in both a sequential environment and a distributed network system. We have achieved 88.14% accuracy of the testing data set. The execution of the proposed model in the sequential system is greater than that in the parallel network environment. Many applications
and research of the sentiment classification can widely use the results of the proposed model.
Keywords: English Sentiment Classification; Distributed System; Parallel System; Odds Ratio Similarity Coefficient; Cloudera; Hadoop Map And Hadoop Reduce; Clustering Technology; Self-Organizing Map
1. INTRODUCTION
Many algorithms of the different fields such as a data mining, a computer science, a natural language processing and etc. have already been developed more and more. They are also used in applying to sentiment classification. The data mining and the natural language processing have had many significant relationships for many years. About clustering technologies of the data mining, a set of objects is processed into classes of similar objects,
called clustering data. One cluster is a set of data objects which are similar to each other and are not similar to objects in other clusters. A number of data clusters can be clustered, which can be identified following experience or can be automatically identified as part of clustering method.
5173 According to the surveys related the Self-Organizing Map Algorithm (SOM) in [20-24], a self-organizing map (SOM) or self-organizing feature map (SOFM) is a type of artificial neural network (ANN) that is trained using unsupervised learning to produce a low-dimensional (typically two-dimensional), discretized representation of the input space of the training samples, called a map, and is therefore a method to do dimensionality reduction. Self-organizing maps differ from other artificial neural networks as they apply competitive learning as opposed to error-correction learning (such as backpropagation with gradient descent), and in the sense that they use a neighborhood function to preserve the topological properties of the input space.
Also based on the SOM in [20-24], the advantages of the SOM are as follows: It is an unsupervised learning. We do not need any training data sets in English for the SOM. It shows many multi-dimensional data sets into either the one-dimensional data sets or the two-one-dimensional data sets, etc.
We build the basic principles for our new model as follows:
• We assume that each English sentence has m English words (or English phrases).
• We assume that the maximum number of one English sentence is m_max terms (words or phrases); it means that m is less than m_max or m is equal to m_max.
• We assume that each English document has n English sentences.
• We assume that the maximum number of one English document is n_max sentences; it means that n is less than n_max or n is equal to n_max.
• We transfer one sentence into one one-dimensional vector in English. Thus, the length of the vector is m. If m is less than m_max then each element of the vector from m to m_max-1 is 0 (zero).
• All the sentences of one document of the testing data set are transfer on many sentiment lexicons of our basis English sentiment dictionary (bESD).
Based on our opinion, the motivation of this new model is as follows: Many algorithms in the data mining field can be applied to natural language processing, specifically semantic classification for processing millions of English documents. An Odds Ratio Coefficient (ORC) and the SOM of the clustering technologies of the data mining filed can be applied to the sentiment classification in both a sequential environment and a parallel network system. This will result in many discoveries in
scientific research, hence the motivation for this study.
The novelty of the proposed approach is as follows: the Odds Ratio Coefficient (ORC) and the SOM are applied to sentiment analysis. This can also be applied to identify the sentiments (positive, negative, or neutral) of millions of many documents. This survey can be applied to other parallel network systems. Hadoop Map (M) and Hadoop Reduce (R) are used in the proposed model. Therefore, we will study this model in more detail.
With the purpose of this survey, we always try to find a new approach to reform many accuracies of the results of the sentiment classification and to shorten many execution times of the proposed model with a low cost.
To get higher accuracy and shorten execution time of the sentiment classification, we dot not use any data sets. We do not any one-dimensional vectors based on a vector space modeling (VSM) in [1-3]. We also do not use any multi-dimensional vectors based on the VSM [1-3]. We only use many one-dimensional vectors based on many sentiment lexicons of our basis English sentiment dictionary (bESD). We also do not use many multi-dimensional vectors based on the sentiment lexicons of the bESD. We create the sentiment lexicons of the bESD by using An Odds Ratio Coefficient (ORC) through a Google search engine with AND operator and OR operator. All the n_max sentences of one document of the testing data set are transferred into the n_max one-dimensional vectors of the document. We use the SOM to cluster the n_max one-dimensional vectors of the document into either the positive polarity or the negative polarity with the input of the SOM is the n_max one-dimensional vectors of this document. The document is identified the sentiment classification based on the results of the n_max one-dimensional vectors clustered into either the positive or the negative.
5174
Fig. 1: An Initialization Of The SOM – The Map
Then, after the SOM is implemented completely, we have the Map in Fig. 2 as follows:
Fig. 2: The Final Map – The Result Of Clustering By Using The SOM
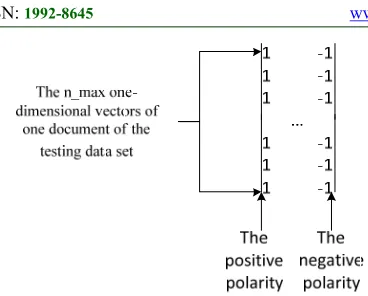
In Fig. 2, we have the vector 1 (0.1, 0), the vector 2 (0, 0.2), the vector 3 (0.3, 0.3), the vector 4 (0.4, 0.1) , and the vector 5 (0.2, 0.5). With the vector 1, the column of the positive polarity is 0.1 and the column of the negative polarity is 0, Thus, the value of the column of the positive polarity is greater than the value of the column of the negative polarity, therefore this vector is clustered into the positive. With the vector 2, the column of the positive polarity is 0 and the column of the negative polarity is 0.2. Therefore, the value of the column of the positive polarity is less than the value of the column of the negative polarity, thus this vector is clustered into the negative. With the vector 3, the column of the positive polarity is 0.3 and the column of the negative polarity is 0.3. So, the value of the column of the positive polarity is as equal as the value of the column of the negative polarity, therefore this vector is not clustered into both the positive and the negative. It meas that this vector is clustered into the neutral polarity. With the vector 4 (0.4, 0.1), the column of the positive polarity is 0.4 and the column of the negative polarity is 0.1. Thus, the value of the column of the positive polarity is
greater than the value of the column of the negative polarity, so this vector is clustered into the positive. With the vector 5, the column of the positive polarity is 0.2 and the column of the negative polarity is 0.5. Therefore, the value of the column of the positive polarity is less than the column of the negative polarity, thus this vector is clustered into the negative. One document is clustered into the positive if the number of the one-dimensional vectors (corresponding to the sentences of this document) clustered into the positive is greater than the number of the one-dimensional vectors (corresponding to the sentences of this document) clustered into the negative in the document. The document is clustered into the negative if the number of the one-dimensional vectors clustered into the positive is less than the number of the one-dimensional vectors clustered into the negative in the document. The document is clustered into the neutral if the number of the one-dimensional vectors clustered into the positive is as equal as the number of the one-dimensional vectors clustered into the negative in the document. Finally, the sentiment classification of all the documents of the testing data set is identified completely.
Firstly, all the above things are performed in the sequential system to get an accuracy of the result of the sentiment classification and an execution time of the result of the sentiment classification of the proposed model. Secondly, we implement all the above things in the parallel network environment to shorten the execution times of the proposed model to get the accuracy of the results of the sentiment classification and the execution times of the results of the sentiment classification of our new model
The crucial contributions of our new model can be applied to many areas of research as well as commercial applications as follows:
1)Many surveys and commercial applications can use the results of this work in a significant way.
3)The algorithms are built in the proposed model. 4)This survey can certainly be applied to other languages easily.
5)The results of this study can significantly be applied to the types of other words in English.
6)Many crucial contributions are listed in the Future Work section.
7)The algorithm of data mining is applicable to semantic analysis of natural language processing.
8)This study also proves that different fields of scientific research can be related in many ways.
9)Millions of English documents are successfully processed for emotional analysis.
[image:3.612.94.300.282.400.2]5175 11)The principles are proposed in the research. 12)The Cloudera distributed environment is used in this study.
13)The proposed work can be applied to other distributed systems.
14)This survey uses Hadoop Map (M) and Hadoop Reduce (R).
15)Our proposed model can be applied to many different parallel network environments such as a Cloudera system
16)This study can be applied to many different distributed functions such as Hadoop Map (M) and Hadoop Reduce (R).
17)The SOM – related algorithms are proposed in this survey.
18)The ORC – related algorithms are built in this work.
This study contains 6 sections. Section 1 introduces the study; Section 2 discusses the related works about the vector space modeling (VSM), Self-Organizing Map Algorithm (SOM) and Odds Ratio Coefficient (ORC), etc.; Section 3 is about the English data set; Section 4 represents the methodology of our proposed model; Section 5 represents the experiment. Section 6 provides the conclusion. The References section comprises all the reference documents; all tables are shown in the Appendices section.
2. RELATED WORK
We summarize many researches which are related to our research.
There are the works related to vector space modeling (VSM) in [1-3]. In this study [1], the authors examined the Vector Space Model, an Information Retrieval technique and its variation. In this survey [2], the authors considered multi-label text classification task and apply various feature sets. The authors considered a subset of multi-labeled files from the Reuters-21578 corpus. The authors used traditional tf-IDF values of the features and tried both considering and ignoring stop words. The authors also tried several combinations of features, like bigrams and unigrams. The authors in [3] introduced a new weighting method based onstatistical estimation of the importance of a word for a specific categorization problem. This method also had the benefit to makefeature selectionimplicit, since uselessfeatures for the categorization problemconsidered getavery small weight.
The latest researches of the sentiment classification are [4-14]. In the research [4], the authors presented their machine learning
experiments with regard to sentiment analysis in blog, review and forum texts found on the World Wide Web and written in English, Dutch and French. The survey in [5] discussed an approach where an exposed stream of tweets from the Twitter micro blogging site were preprocessed and classified based on their sentiments. In sentiment classification system the concept of opinion subjectivity has been accounted. In the stedudy, the authors present opinion detection and organization subsystem, which have already been integrated into our larger question-answering system, etc.
The surveys related the Odds Ratio coefficient are in [15-19]. The authors in [15] collected 76 binary similarity and distance measures used over the last century and reveal their correlations through the hierarchical clustering technique. In [16], because the odds ratio has many desirable properties, and some investigators may find the odds ratio is easier to interpret, the authors discussed modelling the association between binary responses at pairs of times with the odds ratio, etc.
There are the researches related the Self-Organizing Map Algorithm (SOM) in [20-24]. In [20], the self-organized map, an architecture suggested for artificial neural networks, was explained by presenting simulation experiments and practical applications. The self-organizing map had the property of effectively creating spatially organized internal representations of various features of input signals and their abstractions. In [21], the Kohonen Self-Organizing Map (SOM) was one of the most well-known neural network with unsupervised learning rules; it performed a topology-preserving projection of the data space onto a regular two-dimensional space. Its achievement has already been demonstrated in various areas, but this approach is not yet widely known and used by ecologists. The present work described how SOM can be used for the study of ecological communities, etc.
5176 one English word (or one English phrase). Finally, we identify the sentimental values of English verb phrases based on the basis English semantic lexicons of the basis English emotional dictionary (bESD).
There are the works related to PMI measure in [25-37]. In the research [25], the authors generated several Norwegian sentiment lexicons by extracting sentiment information from two different types of Norwegian text corpus, namely, news corpus and discussion forums. The methodology was based on the Point wise Mutual Information (PMI). The authors introduced a modification of the PMI that considers small "blocks" of the text instead of the text as a whole. The study in [26] introduced a simple algorithm for unsupervised learning of semantic orientation from extremely large corpora, etc.
Two studies related to the PMI measure and Jaccard measure are in [38-39]. In the survey [38], the authors empirically evaluated the performance of different corpora in sentiment similarity measurement, which is the fundamental task for word polarity classification. The research in [39] proposed a new method to estimate impression of short sentences considering adjectives. In the proposed system, first, an input sentence was analyzed and preprocessed to obtain keywords. Next, adjectives are taken out from the data which is queried from Google N-gram corpus using keywords-based templates.
The works related to the Jaccard measure are in [40-46]. The survey in [40] investigated the problem of sentiment analysis of the online review. In the study [41], the authors were addressing the issue of spreading public concern about epidemics. Public concern about a communicable disease can be seen as a problem of its own, etc.
The surveys related to the similarity coefficients to calculate the valences of words are in [52-56].
The English dictionaries are [57-62] and there are more than 55,000 English words (including English nouns, English adjectives, English verbs, etc.) from them.
3. DATA SET
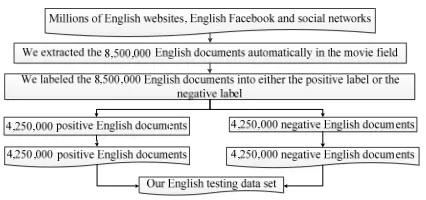
[image:5.612.312.525.93.193.2]Based on Fig. 1 below, we built our the testing data set including the 8,500,000 documents in the movie field, which contains the 4,250,000 positive and 4,250,000 negative in English. All the documents in our English training data set are automatically extracted from English Facebook, English websites and social networks; then we labeled positive and negative for them.
Fig. 3: Our Testing Data Set In English.
4. METHODOLOGY
[image:5.612.316.518.336.504.2]An overview of the proposed model is shown in Fig. 4. This section comprises two parts. The first part is the sub-section (4.1) which we create the sentiment lexicons of the bESD in both a sequential environment and a parallel network system. The second part is the sub-section (4.2) which we use the SOM to cluster the documents of the testing data set into either the positive or the negative.
Fig. 4: Overview Of Our New Model.
The sub-section (4.1) has three parts. The first part is the sub-section (4.1.1) which we calculate the valence and the polarity of one term (word or phrase) in English by using the ORC through the Google search engine with AND operator and OR operator. The second part is the sub-section (4.1.2) which we identify the valences and the polarities of the sentiment lexicons of the bESD in a sequential system. The third part is the sub-section (4.1.3) which we calculate the valences and the polarities of the sentiment lexicons of the bESD in a parallel network environment.
5177 (4.2.2) which we use the SOM to cluster the documents of the testing data set into either the positive or the negative in a parallel network system.
4.1 The sentiment lexicons in English
This section is used to create the sentiment lexicons in English in both a sequential environment and a distributed system.
The section comprises three parts. We identify a sentiment value of one word (or one phrase) in English in the first sub-section (4.1.1). We create a basis English sentiment dictionary (bESD) in a sequential system in the second sub-section (4.1.2). We also create a basis English sentiment dictionary (bESD) in a parallel environment in the third sub-section (4.1.3).
4.1.1 A valence of one word (or one phrase) in English
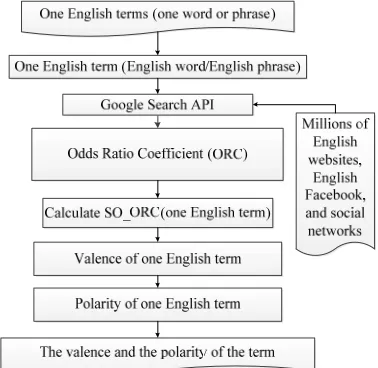
[image:6.612.100.289.385.569.2]In this part, the valence and the polarity of one English word (or phrase) by using the ORC through a Google search engine with AND operator and OR operator are calculated, as the following diagram in Fig. 5 below shows.
Fig. 5: Overview Of Identifying The Valence And The Polarity Of One Term In English Using An
Odds Ratio Coefficient (ORC)
We have an equation about Pointwise Mutual Information (PMI) between two words wi and wj based on [24-39] as follows:
𝑃𝑀𝐼 𝑤𝑖, 𝑤𝑗 𝑙𝑜𝑔 𝑃 𝑤𝑖, 𝑤𝑗
𝑃 𝑤𝑖 𝑥𝑃 𝑤𝑗 1
We also have an equation about SO (sentiment orientation) of word wi according to [1-15] as follows:
𝑆𝑂 𝑤𝑖 𝑃𝑀𝐼 𝑤𝑖, 𝑝𝑜𝑠𝑖𝑡𝑖𝑣𝑒
𝑃𝑀𝐼 𝑤𝑖, 𝑛𝑒𝑔𝑎𝑡𝑖𝑣𝑒 2
In eq. (2), according to [24-32], the positive is identified as follows: positive = {good, nice, excellent, positive, fortunate, correct, superior} In eq. (2), based on [24-32], the negative is shown as follows: negative = {bad, nasty, poor, negative, unfortunate, wrong, inferior}.
The PMI equations in [26, 27, 29] use the AltaVista search engine and the PMI equations in [28, 30, 32] use the Google search engine.
In addition, German is used in [28]. Macedonian is used in [29]. Arabic is used in [30]. Chinese is used in [31] and Spanish is used in [32].
The Bing search engine is also used in [30]. Chinesese is used in the PMI equations of [33-36] and Tibetan is also added in [33].
About the search engine, the AltaVista search engine is used in [35, 36]. The survey [36] uses three search engines, such as the Google search engine, the Yahoo search engine and the Baidu search engine.
Japanese with the Google search engine is used in the PMI equations of [37].
English is used in PMI equations and Jaccard equations with the Google search engine of [38, 39]. We have an equation about Jaccard between two words wi and wj according to [38-46] as follows:
𝐽𝑎𝑐𝑐𝑎𝑟𝑑 𝑤𝑖, 𝑤𝑗 𝐽 𝑤𝑖, 𝑤𝑗
|𝑤𝑖 ∩ 𝑤𝑗| |𝑤𝑖 ∪ 𝑤𝑗| 3
Based on [38-46], we have other type of the Jaccard equation between two words wi and wj as follows:
Jaccard wi, wj J wi, wj sim wi, wj
F wi, wj
F wi F wj F wi, wj 4
and we also have an equation about SO (sentiment orientation) of word wi as follows:
SO wi Sim wi, positive
5178 In eq. (5), according to [38-45], the positive and the negative in English are identified as follows: positive = {good, nice, excellent, positive, fortunate, correct, superior} and negative = {bad, nasty, poor, negative, unfortunate, wrong, inferior}. English is used in the Jaccard equations with the Google search engine in [38, 39, 41].
English is also used in the Jaccard equations in [40, 45].
Chinese is used in the Jaccard equations in [44, 46].
Arabic is used in the Jaccard equations in [42] and Chinese is used in the Jaccard equations with the Chinese search engine in [43].
Vietnamese is used in the Ochiai Measure through the Google search engine with AND operator and OR operator to calculate the sentiment values of the words in [52].
English is used in the Cosine Measure through the Google search engine with AND operator and OR operator to identify the sentiment scores of the words in [53].
The Sorensen Coefficient through the Google search engine with AND operator and OR operator is used to calculate the sentiment values of the words in English in [54].
The Jaccard Measure through the Google search engine with AND operator and OR operator is used to calculate the sentiment values of the words in Vietnamese in [55]
The Tanimoto Coefficient through the Google search engine with AND operator and OR operator is used to identify the sentiment scores of the words in English in [56]
With the above proofs, we have as follows: PMI is used with AltaVista in English, Chinese, and Japanese with the Google in English; Jaccard is used with the Google in English, Chinese, and Vietnamse. The Ochiai is used with the Google in Vietnamese. The Cosine and Sorensen are used with the Google in English. Based on [24-56], PMI, Jaccard, Cosine, Ochiai, Sorensen, Tanimoto and ODDS RATIO coefficient (ORC) are the similarity measures between two words, and they can perform the same functions and with the same characteristics. Therefore, ORC is used in calculating the valence of the words. In addition, we also prove that ORC can be used in identifying the valence of the English word through the Google search with the AND operator and OR operator.
We have an equation of the ORC based on the ODDS RATIO coefficient (ORC) in [15-19] as follows:
ODDS RATIO Coefficient a, b
ODDS RATIO Measure a, b ORC a, b
a ∩ b ∗ a ∩ b
a ∩ b ∗ a ∩ b 6
with a and b are the vectors.
According to he eq. (1), (2), (3), (4), (5), (6), we build many new equations of the ORC to calculate the valence and the polarity of the English words (or the English phrases) through the Google search engine as the following equations below.
In eq. (6), when a has only one element, a is a word. When b has only one element, b is a word. In eq. (6), a is replaced by w1 and b is replaced by w2.
ODDS RATIO Measure w1, w2 ODDS RATIO Coefficient w1, w2 ORC w1, w2
P w1, w2 ∗ P w1, w2
P w1, w2 ∗ P w1, w2 7
Eq. (7) is similar to eq. (1). In eq. (2), eq. (1) is replaced by eq. (7). We have eq. (8)
Valence w SO_ORC w
ORC w, positive_query
ORC w, negative_query 8
In eq. (7), w1 is replaced by w and w2 is replaced by position_query. We have eq. (9). Eq. (9) is as follows:
ORC w, positive_query A9
B9 9
with A9 = P w, positive_query ∗ P w, positive_query
B9 = P w, positive_query ∗
P w, positive_query
In eq. (7), w1 is replaced by w and w2 is replaced by negative_query. We have eq. (10). Eq. (10) is as follows:
ORC w, negative_query A10
B10 10
with A10 = P w, negative_query ∗ P w, negative_query
B10 = P w, negative_query ∗
P w, negative_query We have the information
about w, w1, w2, etc. as follows:
5179 2)P(w1, w2): number of returned results in Google search by keyword (w1 and w2). We use the Google Search API to get the number of returned results in search online Google by keyword (w1 and w2).
3)P(w1): number of returned results in Google search by keyword w1. We use the Google Search API to get the number of returned results in search online Google by keyword w1.
4)P(w2): number of returned results in Google search by keyword w2. We use the Google Search API to get the number of returned results in search online Google by keyword w2.
5)Valence(W) = SO_ORC(w): valence of English word (or English phrase) w; is SO of word (or phrase) by using the ODDS RATIO coefficient (ORC)
6)positive_query: { active or good or positive or beautiful or strong or nice or excellent or fortunate or correct or superior }
with the positive query is the a group of the positive English words.
7)negative_query: { passive or bad or negative or ugly or week or nasty or poor or unfortunate or wrong or inferior }
with the negative_query is the a group of the negative English words.
8)P(w, positive_query): number of returned results in Google search by keyword (positive_query and w). We use the Google Search API to get the number of returned results in search online Google by keyword (positive_query and w)
9)P(w, negative_query): number of returned results in Google search by keyword (negative_query and w). We use the Google Search API to get the number of returned results in search online Google by keyword (negative_query and w)
10)P(w): number of returned results in Google search by keyword w. We use the Google Search API to get the number of returned results in search online Google by keyword w
11)P(¬w,positive_query): number of returned results in Google search by keyword ((not w) and positive_query). We use the Google Search API to get the number of returned results in search online Google by keyword ((not w) and positive_query). 12)P(w, ¬positive_query): number of returned results in the Google search by keyword (w and ( not (positive_query))). We use the Google Search API to get the number of returned results in search online Google by keyword (w and [not (positive_query)]).
13)P(¬w, ¬positive_query): number of returned results in the Google search by keyword (w and ( not (positive_query))). We use the Google Search
API to get the number of returned results in search online Google by keyword ((not w) and [not (positive_query)]).
14)P(¬w,negative_query): number of returned results in Google search by keyword ((not w) and negative_query). We use the Google Search API to get the number of returned results in search online Google by keyword ((not w) and negative_query). 15)P(w,¬negative_query): number of returned results in the Google search by keyword (w and (not ( negative_query))). We use the Google Search API to get the number of returned results in search online Google by keyword (w and (not (negative_query))).
16)P(¬w,¬negative_query): number of returned results in the Google search by keyword (w and (not ( negative_query))). We use the Google Search API to get the number of returned results in search online Google by keyword ((not w) and (not (negative_query))).
As like Cosine, Ochiai, Sorensen, Tanimoto, PMI and Jaccard about calculating the valence (score) of the word, we identify the valence (score) of the English word w based on both the proximity of positive_query with w and the remote of positive_query with w; and the proximity of negative_query with w and the remote of negative_query with w.
The English word w is the nearest of positive_query if ORC (w, positive_query) is as equal as 1.
The English word w is the farthest of positive_query if ORC(w, positive_query) is as equal as 0.
The English word w belongs to positive_query being the positive group of the English words if ORC(w, positive_query) > 0 and ORC(w, positive_query) ≤ 1.
The English word w is the nearest of negative_query if ORC(w, negative_query) is as equal as 1.
The English word w is the farthest of negative_query if ORC(w, negative_query) is as equal as 0.
The English word w belongs to negative_query being the negative group of the English words if ORC(w, negative_query) > 0 and ORC(w, negative_query) ≤ 1. So, the valence of the English word w is the value of ORC(w, positive_query) substracting the value of ORC(w, negative_query) and the eq. (8) is the equation of identifying the valence of the English word w.
We have the information about ORC, SO_ORC, etc. as follows:
5180 positive_query) ≤ 1.
2)ORC(w, negative_query) ≥ 0 and ORC (w, negative_query) ≤ 1
3)If ORC (w, positive_query) = 0 and ORC (w, negative_query) = 0 then SO_ORC (w) = 0. 4)If ORC (w, positive_query) = 1 and ORC (w, negative_query) = 0 then SO_ORC (w) = 0. 5)If ORC (w, positive_query) = 0 and ORC (w, negative_query) = 1 then SO_ORC (w) = -1. 6)If ORC (w, positive_query) = 1 and ORC (w, negative_query) = 1 then SO_ORC(w) = 0. So, SO_ORC (w) ≥ -1 and SO_ORC (w) ≤ 1. The polarity of the English word w is positive polarity If SO_ORC (w) > 0. The polarity of the English word w is negative polarity if SO_ORC (w) < 0. The polarity of the English word w is neutral polarity if SO_ORC (w) = 0. In addition, the semantic value of the English word w is SO_ORC (w).
We calculate the valence and the polarity of the English word or phrase w using a training corpus of approximately one hundred billion English words — the subset of the English Web that is indexed by the Google search engine on the internet. AltaVista was chosen because it has a NEAR operator. The AltaVista NEAR operator limits the search to documents that contain the words within ten words of one another, in either order. We use the Google search engine which does not have a NEAR operator; but the Google search engine can use the AND operator and the OR operator. The result of calculating the valence w (English word) is similar to the result of calculating valence w by using AltaVista. However, AltaVista is no longer. In summary, by using eq. (8), eq. (9), and eq. (10), we identify the valence and the polarity of one word (or one phrase) in English by using the SC through the Google search engine with AND operator and OR operator.
We compare this result of the proposed model with the surveys in the tables as follows: Table 8, Table 9, Table 12, and Table 13.
In Table 8, we show the comparisons of our model with the researches related to the Odds Ratio Coefficient (ORC) in [15- 19]
The comparisons of our model’s positives and negatives the surveys related to the Odds Ratio Coefficient (ORC) in [15-19] are displayed in Table 9.
In Table 12, we present the comparisons of our model’s results with the works related to [1-32]. The comparisons of our model’s advantages and disadvantages with the works related to [1-32] are displayed in Table 13.
4.1.2 A basis English sentiment dictionary (bESD) in a sequential environment
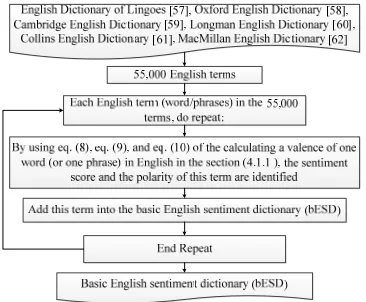
[image:9.612.326.509.200.351.2]At least 55,000 terms, including nouns , verbs, adjectives, etc. in English are based on [57-62]. The valence and the polarity of the English words or phrases for our basis English sentiment dictionary (bESD) by using the ORC are identified in a sequential system, as the following diagram in Fig. 6 below shows.
Fig. 6: Overview Of Creating A Basis English Sentiment Dictionary (Besd) In A Sequential
Environment
The algorithm 1 is proposed to perform this section Input: the 55,000 English terms; the Google search engine
Output: a basis English sentiment dictionary (bESD)
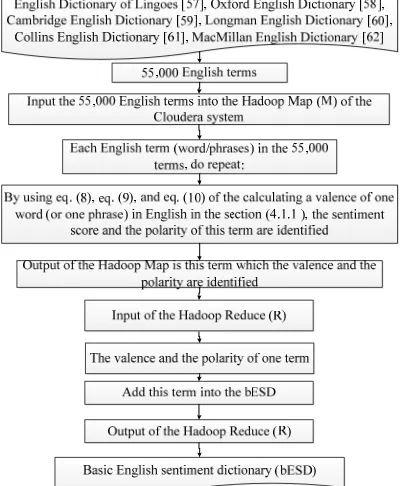
Step 1: Each term in the 55,000 terms, do repeat:
Step 2: By using eq. (8), eq. (9), and eq. (10) of the calculating a valence of one word (or one phrase) in English in the section (4.1.1), the sentiment score and the polarity of this term are identified. The valence and the polarity are calculated by using the ORC through the Google search engine with AND operator and OR operator.
Step 3: Add this term into the basis English sentiment dictionary (bESD);
Step 4: End Repeat – End Step 1; Step 5: Return bESD;
More 55,000 English words (or English phrases) of our basis English sentiment dictionary (bESD) are stored in Microsoft SQL Server 2008 R2.
4.1.3 A basis English sentiment dictionary (bESD) in a distributed system
5181 calculated in a parallel network environment from at least 55,000 English terms, including nouns, verbs, adjectives, etc. based on [57-62], as the following diagram in Fig. 7 below shows.
Fig. 7: Overview Of Creating A Basis English Sentiment Dictionary (Besd) In A Distributed
Environment
In Fig. 7, there are two phases in this section as follows: the Hadoop Map (M) phase and the Hadoop Reduce (R) phase. The input of the Hadoop Map phase is the 55,000 terms in English in [57-62]. The output of the Hadoop Map phase is one term which the sentiment score and the polarity are identified. The output of the Hadoop Map phase is the input of the Hadoop Reduce phase. Thus, the input of the Hadoop Reduce phase is one term which the sentiment score and the polarity are identified. The output of the Hadoop Reduce phase is the basis English sentiment dictionary (bESD). The algorithm 2 is built to implement the Hadoop Map phase.
Input: the 55,000 English terms; the Google search engine
Output: one term which the sentiment score and the polarity are identified.
Step 1: Each term in the 55,000 terms, do repeat:
Step 2: By using eq. (8), eq. (9), and eq. (10) of the calculating a valence of one word (or one phrase) in English in the section (4.1.1), the sentiment score and the polarity of this term are
identified. The valence and the polarity are calculated by using the ORC through the Google search engine with AND operator and OR operator.
Step 3: Return this term;
The algorithm 3 is proposed to perform thie Hadoop Reduce phase. The algorithm 3 has the main ideas as follows:
Input: one term which the sentiment score and the polarity are identified – The output of the Hadoop Map phase.
Output: a basis English sentiment dictionary (bESD)
Step 1: Add this term into the basis English sentiment dictionary (bESD);
Step 2: Return bESD;
At least 55,000 English words (or English phrases) of our basis English sentiment dictionary (bESD) are stored in Microsoft SQL Server 2008 R2.
4.2 Using Self-Organizing Map Algorithm to cluster the documents of the testing data set into either the positive or the negative in both a
sequential environment and a distributed system
The section comprise two parts. The first part is the sub-sectin (4.2.1) which we use the SOM to cluster the documents of the testing data set into either the positive or the negative in a sequential environment. The second part is the sub-section (4.2.2) which we use the SOM to cluster the documents of the testing data set into either the positive or the negative in a parallel network system.
4.2.1 Using Self-Organizing Map Algorithm to cluster the documents of the testing data set into either the positive or the negative in a sequential environment
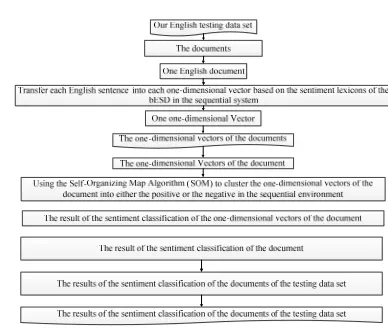
In Fig. 8, we use Self-Organizing Map Algorithm to cluster the documents of the testing data set into either the positive or the negative in a sequential environment
5182
Fig. 8: Overview Of Using Self-Organizing Map Algorithm To Cluster The Documents Of The Testing Data Set Into Either The Positive Or The Negative In A
Sequential Environment
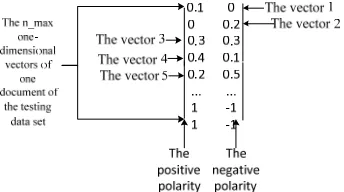
[image:11.612.134.261.333.428.2]We set an initialization of the SOM with its map in Fig. 9 as follows:
Fig. 9: An Initialization Of The SOM – The Map
Then, after the SOM is implemented completely, we have the Map in Fig. 10 as follows:
Fig. 10: The Final Map – The Result Of Clustering By Using The SOM
In Figue 10, we have the vector 1 (0.1, 0), the vector 2 (0, 0.2), the vector 3 (0.3, 0.3), the vector 4 (0.4, 0.1) , and the vector 5 (0.2, 0.5). With the vector 1, the column of the positive polarity is 0.1 and the column of the negative polarity is 0, Thus, the value of the column of the positive polarity is greater than the value of the column of the negative
polarity, therefore this vector is clustered into the positive. With the vector 2, the column of the positive polarity is 0 and the column of the negative polarity is 0.2. Therefore, the value of the column of the positive polarity is less than the value of the column of the negative polarity, thus this vector is clustered into the negative. With the vector 3, the column of the positive polarity is 0.3 and the column of the negative polarity is 0.3. So, the value of the column of the positive polarity is as equal as the value of the column of the negative polarity, therefore this vector is not clustered into both the positive and the negative. It meas that this vector is clustered into the neutral polarity. With the vector 4 (0.4, 0.1), the column of the positive polarity is 0.4 and the column of the negative polarity is 0.1. Thus, the value of the column of the positive polarity is greater than the value of the column of the negative polarity, so this vector is clustered into the positive. With the vector 5, the column of the positive polarity is 0.2 and the column of the negative polarity is 0.5. Therefore, the value of the column of the positive polarity is less than the column of the negative polarity, thus this vector is clustered into the negative. One document is clustered into the positive if the number of the one-dimensional vectors (corresponding to the sentences of this document) clustered into the positive is greater than the number of the one-dimensional vectors (corresponding to the sentences of this document) clustered into the negative in the document. The document is clustered into the negative if the number of the one-dimensional vectors clustered into the positive is less than the number of the one-dimensional vectors clustered into the negative in the document. The document is clustered into the neutral if the number of the one-dimensional vectors clustered into the positive is as equal as the number of the one-dimensional vectors clustered into the negative in the document. Finally, the sentiment classification of all the documents of the testing data set is identified completely.
We proposed the algorithm 4 to transfer one English sentence into the one-dimensional vector based on the sentiment lexicons of the bESD the sequential environment.
Input: one English sentence Output: one one-dimensional vector
Step 1: Split this sentence into the meaningful terms (meaningful words or meaningful phrases); Step 2: One-dimensionalVector := null;
[image:11.612.102.291.499.608.2]5183 Step 4: Get the valence of this term based on the sentiment lexicons of the bESD;
Step 5: Add this term into One-dimensionalVector; Step 6: End Repeat – End Step 2
Step 7: Return One-dimensionalVector;
We built the algorithm 5 to transfer one English document into the one-dimensional vectors of the document in the sequential environment.
Input: one English document
Output: the one-dimensional vectors of this document
Step 1: Split the English document into many separate sentences based on “.” Or “!” or “?”; Step 2: Ste TheOne-dimensionalVectors := null; Step 3: Each sentence in the sentences of this document, do repeat:
Step 4: One-dimensionalVector := the algorithm 1 to transfer one English sentence into the one-dimensional vector based on the sentiment lexicons of the bESD the sequential environment with the input is this sentence;
Step 5: Add One-dimensionalVector into TheOne-dimensionalVectors;
Step 6: End Repeat – End Step 2
Step 7: Return TheOne-dimensionalVectors;
We proposed the algorithm 6 to cluster one document of the testing data set into either the positive or the negative by using the SOM in the sequential environment.
Input: one document
Output: positive, negative, neutral;
Step 1: Set Matrix := {}{} with the n_max rows, the 2 columns
Step 2: Set i:= 0;
Step 3: Each i in the 2 columns -1, do repeat: Step 4: Set j := 0;
Step 5: Ech j in the n_max rows -1, do repeat: Step 6: If i is as equal as 0 Then Matrix[j][i] :=1; Step 7: If i is as equal as 1 Then Matrix[j][i] :=-1; Step 8: End Repeat – End Step 5
Step 9: End Repeat – End Step 3 Step 10: Set Learning rate := 0.9; Step 11: Set R := 0;
Step 12: While stopping condition false do step 13 to 19
Step 13: For each input vector x do step 14 to 16 Step 14: For ech j neuron, compute the Euclidean distance D(j)
Step 15: Find the index J such D(j) is a minimum Step 16: For all neurons j within a specified neighbourhood of J and for all i: wji (new)= wij(old )+ learning rate * (xi - wij (old) )
Step 17: Update learning rate. It is a decreasing function of the number of epochs: learning rate (t+1) = [learning rate(t)]/2;
Step 18: Reduce radius of topolofical neighbourhood at specified times
Step 19: Test stop condition. Typically this is a small value of the learning rate with which the weight updates are insignificant.
Step 20: Set count_positive := 0 and count_negative := 0;
Ste p 20: Ech j in the n_max rows -1, do repeat: Step 21: If Matrix[j][0] is greater than Matrix[j][1] Then count_positive := count_positive +1;
Step 22: If Matrix[j][0] is less than Matrix[j][1] Then count_negative := count_negative +1;
Step 23: End Repeat – End Step 20;
Step 24: If count_positive is greater than count_negative Then Return positive;
Step 25: Else If count_positive is less than count_negative Then Return negative;
Step 26: Return neutral;
We proposeD the algorithm 7 to cluster the documents of the testing data set into either positive or the negative by using the SOM in the sequential system.
Input: the testing data set
Output: the results of the sentiment classification of the testing data set
Step 1: Set TheResults := null;
Step 2: Each document in the documents of the testing data set, do repeat:
Step 3: OneResult := the algorithm 3 to cluster one document of the testing data set into either the positive or the negative by using the SOM in the sequential environment with the input is this document;
Step 4: Add OneResult into TheResults; Step 5: End Repeat – End Step 2; Step 6: Return TheResults;
4.2.2 Using Self-Organizing Map Algorithm to cluster the documents of the testing data set into either the positive or the negative in a distributed system
In Fig. 11, we use Self-Organizing Map Algorithm to cluster the documents of the testing data set into either the positive or the negative in a distributed environment.
5184 document of the testing data set into the n_max one-dimensional vectors of this document. All the n_max one-dimensional vectors of this document are clustered into either the positive polarity or the negative polarity by using the SOM with the input is the n_max one-dimensional vectors.
Fig. 11. Overview Of Using Self-Organizing Map Algorithm To Cluster The Documents Of The Testing Data Set Into Either The Positive Or The Negative In A
Parallel Environment
[image:13.612.128.267.411.511.2]We set an initialization of the SOM with its map in Fig. 12 as follows:
Fig. 12: An Initialization Of The SOM– the Map
[image:13.612.96.268.582.678.2]Then, after the SOM is implemented completely, we have the Map in Fig. 13 as follows:
Fig. 13: The Final Map – The Result Of Clustering By Using The SOM
In Figue 13, we have the vector 1 (0.1, 0), the vector 2 (0, 0.2), the vector 3 (0.3, 0.3), the vector 4 (0.4, 0.1) , and the vector 5 (0.2, 0.5). With the vector 1, the column of the positive polarity is 0.1 and the column of the negative polarity is 0, Thus, the value of the column of the positive polarity is greater than the value of the column of the negative polarity, therefore this vector is clustered into the positive. With the vector 2, the column of the positive polarity is 0 and the column of the negative polarity is 0.2. Therefore, the value of the column of the positive polarity is less than the value of the column of the negative polarity, thus this vector is clustered into the negative. With the vector 3, the column of the positive polarity is 0.3 and the column of the negative polarity is 0.3. So, the value of the column of the positive polarity is as equal as the value of the column of the negative polarity, therefore this vector is not clustered into both the positive and the negative. It meas that this vector is clustered into the neutral polarity. With the vector 4 (0.4, 0.1), the column of the positive polarity is 0.4 and the column of the negative polarity is 0.1. Thus, the value of the column of the positive polarity is greater than the value of the column of the negative polarity, so this vector is clustered into the positive. With the vector 5, the column of the positive polarity is 0.2 and the column of the negative polarity is 0.5. Therefore, the value of the column of the positive polarity is less than the column of the negative polarity, thus this vector is clustered into the negative. One document is clustered into the positive if the number of the one-dimensional vectors (corresponding to the sentences of this document) clustered into the positive is greater than the number of the one-dimensional vectors (corresponding to the sentences of this document) clustered into the negative in the document. The document is clustered into the negative if the number of the one-dimensional vectors clustered into the positive is less than the number of the one-dimensional vectors clustered into the negative in the document. The document is clustered into the neutral if the number of the one-dimensional vectors clustered into the positive is as equal as the number of the one-dimensional vectors clustered into the negative in the document. Finally, the sentiment classification of all the documents of the testing data set is identified completely.
5185
Fig. 14: Overview Of Transferring One Sentence Into One One-Dimensional Vector Based On The Sentiment
Lexicons Of The Besd In The Parallel System
In Fig. 14, this stage includes two phases: the Hadoop Map phase and the Hadoop Reduce phase. The input of the Hadoop Map phase is one sentence. The output of the Hadoop Mp is one term. The input of the Hadoop Reduce is the Hadoop Map, thus, the input of the Hadoop Reduce is one term. The output of the Hadoop Reduce is the one-dimensional vector of this sentence.
We proposed the algorithm 8 to implement the Hadoop Map phase
Input: one sentence; Output: one term;
Step 1: Input this document into the Hadoop Map in the Cloudera system.
Step 2: Split this sentence into the meaningful terms;
Step 3: Each term in the terms, do repeat:
Step 4:Get the valence of this term based on the sentiment lexicons of the bESD;
Step 5: Return this term;
Step 6: The output of the Hadoop Map is this term; We built the algorithm 9 to implement the Hadoop Reduce phase
Input: one term of the Hadoop Map (the input of the Hadoop Reduce is the output of the Hadoop Map)
Output: the one-dimensional vector of the English sentence – One-dimensionalVector;
Step 1: Receive one termp;
Step 2: Add this term into One-dimensionalVector; Step 3: Return One-dimensionalVector;
[image:14.612.325.515.249.604.2]In Fig. 15, we transfer one document into the one-dimensional vectors of the document based on the sentiment lexicons of the bESD in the parallel system as follows:
Fig. 15: Overview Of Transferring One Document Into The One-Dimensional Vectors Of The Document Based On The Sentiment Lexicons Of The Besd In The Parallel
System
5186 Hadoop Reduce is one one-dimensional vector. The output of the Hadoop Reduce is the one-dimensional vectors of this dcoument.
We proposed the algorithm 10 to implement the Hadoop Map phase
Input: one document;
Output: one one-dimensional vector (corresponding to one sentence)
Step 1: Input this document into the Hadoop Map in the Cloudera system.
Step 2: Split this document into the n sentences; Step 3: Each sentence in the n sentences, do repeat: Step 4: the one-dimensional vector := the transferring one sentence into one one-dimensional vector based on the sentiment lexicons of the bESD in the parallel system in Fig. 14 with the input is this sentence;
Step 5: Return this one-dimensional vector; Step 6: The output of the Hadoop Map is this one-dimensional vector;
We proposed the algorithm 11 to implement the Hadoop Reduce phase
Input: one one-dimensional vector of the Hadoop Map (the input of the Hadoop Reduce is the output of the Hadoop Map)
Output: the one-dimensional vectors of the English document
Step 1: Receive one one-dimensional vector of the Hadoop Map
Step 2: Add this one-dimensional vector into the one-dimensional vectors of the English document Step 3: Return the one-dimensional vectors of the English document;
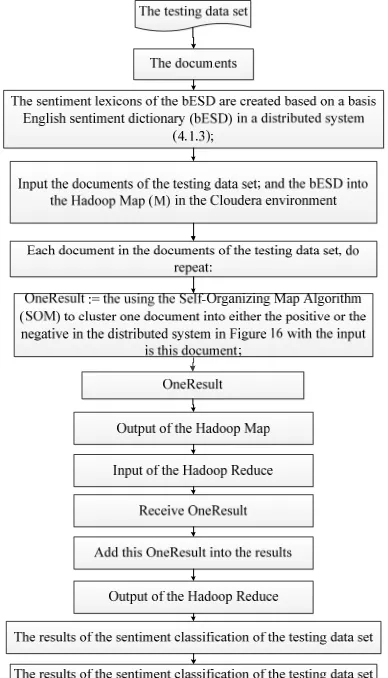
In Fig. 16, we use the Self-Organizing Map Algorithm (SOM) to cluster one document into either the positive or the negative in the distributed system. In Fig. 16, this stage comprises two phases: the Hadoop Map phase and the Hadoop Reduce phase. The input of the Hadoop Map is one document of the testing data set. The output of the Hadoop Map is the result of the sentiment classification of this document. The input of the Hadoop Reduce is the output of the Hadoop Map, thus, the input of the Hadoop Reduce is the result of the sentiment classification of this document. The output of the Hadoop Reduce is the result of the sentiment classification of this document
We proposed the algorithm 12 to perform the Hadoop Map phase
Input: one document
Output: the result of the sentiment classification of this document
Step 1: Set Matrix := {}{} with the n_max rows, the 2 columns
Step 2: Set i:= 0;
Step 3: Each i in the 2 columns -1, do repeat: Step 4: Set j := 0;
Step 5: Ech j in the n_max rows -1, do repeat: Step 6: If i is as equal as 0 Then Matrix[j][i] :=1; Step 7: If i is as equal as 1 Then Matrix[j][i] :=-1; Step 8: End Repeat – End Step 5
Step 9: End Repeat – End Step 3 Step 10: Set Learning rate := 0.9; Step 11: Set R := 0;
Step 12: While stopping condition false do step 13 to 19
Step 13: For each input vector x do step 14 to 16 Step 14: For ech j neuron, compute the Euclidean distance D(j)
Step 15: Find the index J such D(j) is a minimum Step 16: For all neurons j within a specified neighbourhood of J and for all i: wji (new)= wij(old )+ learning rate * (xi - wij (old) )
Step 17: Update learning rate. It is a decreasing function of the number of epochs: learning rate (t+1) = [learning rate(t)]/2;
Step 18: Reduce radius of topolofical neighbourhood at specified times
Step 19: Test stop condition. Typically this is a small value of the learning rate with which the weight updates are insignificant.
Step 20: Set count_positive := 0 and count_negative := 0;
Step 20: Ech j in the n_max rows -1, do repeat: Step 21: If Matrix[j][0] is greater than Matrix[j][1] Then count_positive := count_positive +1;
Step 22: If Matrix[j][0] is less than Matrix[j][1] Then count_negative := count_negative +1;
Step 23: End Repeat – End Step 20;
Step 24: If count_positive is greater than count_negative Then Return positive;
Step 25: Else If count_positive is less than count_negative Then Return negative;
Step 26: Return neutral;
We built the algorithm 13 to implement the Hadoop Reduce phase
Input the result of the sentiment classification of this document (the input of the Hadoop Reduce is the output of the Hadoop Map)
Output: the result of the sentiment classification of this document
Step 1: Receive the result of the sentiment classification of this document
5187
Fig. 16: Overview Of Using The Self-Organizing Map Algorithm (SOM) To Cluster One Document Into Either The Positive Or The Negative In The Distributed System.
In Fig. 17, we cluster the documents of the testing data set into either positive or the negative by using the Self-Organizing Map Algorithm (SOM) in the parallel system. In Fig. 17, this stage includes two phases: the Hadoop Map phase and the Hadoop Reduce phase. The input of the Hadoop Map phase is the documents of the testing data set. The output of the Hadoop Mp is one result of the sentiment classification of one document of the testing data set. The input of the Hadoop Reduce is the Hadoop Map, thus, the input of the Hadoop Reduce is one result of the sentiment classification of one document of the testing data set. The output of the Hadoop Reduce is the results of the sentiment classification of the testing data set
We proposed the algorithm 14 to implement the Hadoop Map phase
Input: the documents of the testing data set and the training data set;
Output: one result of the sentiment classification of one document of the testing data set;
Step 1: The sentiment lexicons of the bESD are created based on a basis English sentiment dictionary (bESD) in a distributed system (4.1.3); Step 2: Each document of the documents of the testing data set, do repeat:
Step 3: OneResult := the using the Self-Organizing Map Algorithm (SOM) to cluster one document into either the positive or the negative in the
distributed system in Fig. 16 with the input is this document;
Step 4: Return this OneResult;
Step 5: The output of the Hadoop Map is this OneResult;
We built the algorithm 15 to implement the Hadoop Reduce phase
Input: one result of the sentiment classification of one document of the testing data set;
Output: the results of the sentiment classification of the testing data set;
Step 1: Receive OneResult of the Hadoop Map Step 2: Add this OnResult into the results of the sentiment classification of the testing data set; Step 3: Return the results of the sentiment classification of the testing data set;
Fig. 17: Overview Of Clustering The Documents Of The Testing Data Set Into Either Positive Or The Negative By
Using The Self-Organizing Map Algorithm (SOM)
5. EXPERIMENT
[image:16.612.325.519.283.622.2]5188 We used a Java programming language for programming to save data sets, implementing our proposed model to classify the 8,500,000 documents of the testing data set. To implement the proposed model, we have already used Java programming language to save the English testing data set and to save the results of emotion classification.
The proposed model was implemented in both the sequential system and the distributed network environment.
Our model related to the Self-Organizing Map algorithm, a testing data set with the one-dimensional vectors and An Odds Ratio coefficient is implemented in the sequential environment with the configuration as follows: The sequential environment in this research includes 1 node (1 server). The configuration of the server in the sequential environment is: Intel® Server Board S1200V3RPS, Intel® Pentium® Processor G3220 (3M Cache, 3.00 GHz), 2GB CC3-10600 ECC 1333 MHz LP Unbuffered DIMMs. The operating system of the server is: Cloudera. The Java language is used in programming our model related to the Self-Organizing Map algorithm, a testing data set with the one-dimensional vectors and An Odds Ratio coefficient.
The proposed model related to the Self-Organizing Map algorithm, a testing data set with the one-dimensional vectors and An Odds Ratio coefficient is performed in the Cloudera parallel network environment with the configuration as follows: This Cloudera system includes 9 nodes (9 servers). The configuration of each server in the Cloudera system is: Intel® Server Board S1200V3RPS, Intel® Pentium® Processor G3220 (3M Cache, 3.00 GHz), 2GB CC3-10600 ECC 1333 MHz LP Unbuffered DIMMs. The operating system of each server in the 9 servers is: Cloudera. All 9 nodes have the same configuration information. The Java language is used in programming the application of the proposed model related to the Odds Ratio similarity coefficient of the clustering technologies in the Cloudera
In Table 1, the results of the documents of the English testing data set to test are presented.
The accuracy of the sentiment classification of the documents in the English testing data set is shown in Table 2 below.
The average time of the classification of our new model for the English documents in testing data set are displayed in Table 3.
6. CONCLUSION
In this survey, a new model has been proposed to classify sentiment of many documents in English using the Self-Organizing Map algorithm, a testing data set with the one-dimensional vectors and An Odds Ratio coefficient with Hadoop Map (M) /Reduce (R) in the Cloudera parallel network environment. Based on our proposed new model, we have achieved 88.14% accuracy of the testing data set in Table 2. Until now, not many studies have shown that the clustering methods can be used to classify data. Our research shows that clustering methods are used to classify data and, in particular, can be used to classify the sentiments (positive, negative, or neutral) in text.
The proposed model can be applied to other languages although our new model has been tested on our English data set. Our model can be applied to larger data sets with millions of English documents in the shortest time although our model has been tested on the documents of the testing data set in which the data sets are small in this survey.
According to Table 3, the average time of the sentiment classification of using the Self-Organizing Map algorithm, a testing data set with the one-dimensional vectors and An Odds Ratio coefficient in the sequential environment is 34,734,059 seconds / 8,500,000 English documents and it is greater than the average time of the sentiment classification of using the Self-Organizing Map algorithm, a testing data set with the one-dimensional vectors and An Odds Ratio coefficient in the Cloudera parallel network environment with 3 nodes which is 10,244,686 seconds / 8,500,000 English documents. The average time of the sentiment classification of using the Self-Organizing Map algorithm, a testing data set with the one-dimensional vectors and An Odds Ratio coefficient in the Cloudera parallel network environment with 9 nodes is 3,881,562 seconds / 8,500,000 English documents, and It is the shortest time in the table. Besides, The average time of the sentiment classification of using the Self-Organizing Map algorithm, a testing data set with the one-dimensional vectors and An Odds Ratio coefficient in the Cloudera parallel network environment with 6 nodes is 5,922,343 seconds / 8,500,000 English documents
5189 The accuracy of the proposed model is depending on many factors as follows:
1)The Odds Ratio Coefficient (ORC) 2)The SOM – related algorithms 3)The testing data set
4)The documents of the testing data set must be standardized carefully.
5)Transferring one document into one one-dimensional vector
The execution time of the proposed model is depending on many factors as follows:
1)The parallel network environment such as the Cloudera system.
2)The distributed functions such as Hadoop Map (M) and Hadoop Reduce (R).
3)The ORC – related algorithms
4)The performance of the distributed network system.
5)The number of nodes of the parallel network environment.
6)The performance of each node (each server) of the distributed environment.
7)The sizes of the training data set and the testing data set.
8)Transferring one document into one one-dimensional vector.
The proposed model has many advantages and disadvantages. Its positives are as follows: It uses the Odds Ratio similarity coefficient of the clustering technologies to classify semantics of English documents based on sentences. The proposed model can process millions of documents in the shortest time. This study can be performed in distributed systems to shorten the execution time of the proposed model. It can be applied to other languages. Its negatives are as follows: It has a low rate of accuracy. It costs too much and takes too much time to implement this proposed model.
To understand the scientific values of this research, we have compared our model's results with many studies in the tables below.
In Table 4, the comparisons of our model’s results with the works in [1-3] are shown.
The comparisons of our model’s advantages and disadvantages with the works in [1-3] are presented in Table 5.
In Table 6, the comparisons of our model with the latest sentiment classification models (or the latest sentiment classification methods) in [4-14] are displayed.
The comparisons of our model’s positives and negatives with the latest sentiment classification models (or the latest sentiment classification methods) in [4-14] are shown in Table 7.
In Table 8, the comparisons of our model with the rsearches related to the Odds Ratio Coefficient (ORC) in [15- 19] are presented.
The comparisons of our model’s positives and negatives the surveys related to the Odds Ratio Coefficient (ORC) in [15-19] are displayed in Table 9.
In Table 10, we show the comparisons of our model with the rsearches related to Self-Organizing Map Algorithm (SOM) in [20- 24].
The comparisons of our model’s positives and negatives the surveys related to the Self-Organizing Map Algorithm (SOM) in [20-24] are displayed in Table 11.
Future Work
Based on the results of this proposed model, many future projects can be proposed, such as creating full emotional lexicons in a parallel network environment to shorten execution times, creating many search engines, creating many translation engines, creating many applications that can check grammar correctly. This model can be applied to many different languages, creating applications that can analyze the emotions of texts and speeches, and machines that can analyze sentiments.
REFRENCES:
[1] Vaibhav Kant Singh, Vinay Kumar Singh, “Vector Space Model: An Information Retrieval System”, Int. J. Adv. Engg. Res. Studies/IV/II/Jan.-March,2015/141-143, 2015 [2] Víctor Carrera-Trejo, Grigori Sidorov, Sabino
Miranda-Jiménez, Marco Moreno Ibarra and Rodrigo Cadena Martínez, “Latent Dirichlet Allocation complement in the vector space
model for Multi-Label Text Classification”,
International Journal of Combinatorial Optimization Problems and Informatics, Vol. 6, No. 1, pp. 7-19, 2015
[3] Pascal Soucy, Guy W. Mineau, “Beyond TFIDF Weighting for Text Categorization in the Vector
Space Model”, Proceedings of the 19th
International Joint Conference on Artificial Intelligence, pp. 1130-1135, USA, 2015 [4] Basant Agarwal, Namita Mittal, “Machine
Learning Approach for Sentiment Analysis”,
Prominent Feature Extraction for Sentiment Analysis, Print ISBN 978-3-319-25341-1, 10.1007/978-3-319-25343-5_3, 21-45, 2016 [5] Basant Agarwal, Namita Mittal, “Semantic
![Table 5: Comparisons of our model’s advantages and disadvantages with the works in [1-3]](https://thumb-us.123doks.com/thumbv2/123dok_us/8902383.955407/22.612.86.525.404.729/table-comparisons-model-s-advantages-disadvantages-works.webp)
