IJPSR (2016), Vol. 7, Issue 10 (Research Article)
Received on 10 May, 2016; received in revised form, 10 August, 2016; accepted, 23 September, 2016; published 01 October, 2016
DNA BINDING AND NUCLEASE ACTIVITY OF STRUCTURALLY CHARACTERIZED COPPER(II) COMPLEX
S. Chandrasekhar and K. Hussain Reddy *
Department of Chemistry, Sri Krishnadevaraya University, Anantapur - 515003, Andhra Pradesh, India.
ABSTRACT: A mononuclear copper(II) complex [Cu(bpy)2(NO3)] NO3
H2O (bpy = 2,2’-bipyridine) has been synthesized and characterized
based on physico-chemical spectral data. The complex is characterized based on electronic, IR and ESR spectroscopies. The structure of the complex is determined by single crystal X-Ray crystallography. The complex crystallizes in monoclinic space group P-1. Structural analysis reveals that the complex adopts square pyramidal geometry with CuN4O
chromophore. The interactions of these complexes with calf thymus DNA have been investigated using absorption spectrophotometry. The high binding constant 4.89 x 10⁶ M-1 may bedue to the strong electrostatic attraction between the cationic complex and the negatively charged phosphodiester backbone of DNA. Nuclease activities of complexes are investigated on double stranded pBR322 plasmid DNA using gel electrophoresis experiments under different conditions. The complex cleaves DNA more effectively in the presence of oxidant.
INTRODUCTION: Copper plays several important roles in biology and medicine. It is constituent of many enzymes and proteins 1. Penta coordinated metal plays significant role in several proteins and enzymes. For example, pent coordinate copper is present in Cu-Zn superoxide dismustase. Improper regulation of copper causes severe diseases such as Wilson's and Menke’s diseases and some neurological disorders 2. Classical polypyridyl ligands such as 2,2-bipyridine and 1,10-phenanthroline are strong bidentate ligands which form stable chelates with many transition metals.
QUICK RESPONSE CODE
DOI:
10.13040/IJPSR.0975-8232.7(10).4204-13
Article can be accessed online on:
www.ijpsr.com
DOI link: http://dx.doi.org/10.13040/IJPSR.0975-8232.7 (10).4204-13
These ligands have a starring role in the field of chemistry and molecular recognition due to their usefulness in medicine and in the industry 3. Various mixed ligand complexes with these ligands have been synthesized and their antibacterial and antifungal activities have been studied 4-6.
Interaction of metal complexes with nucleic acids is an exciting area of research due to their potential use as drugs, tools for biochemical and biomedical applications in gene regulation. Deoxyribonucleic acids (DNA) is the primary target for most anti-cancer drugs 7, 8. Nuclease activity of copper- 1,10-phenanthroline complex was investigated in the year 1979. Since then the Copper complex are widely used as foot printing DNA molecules and cleaving agents 9-11 over the past two decades. DNA binding and cleavage activities of Copper complex with 1,10-phenanthroline are reported from our laboratories. Crystal structure and electronic properties of bis (2,2’-bipyridyl)-nitratocopper(II)
Keywords:
Copper(II) complex, Spectral properties, DNA binding
studies and nuclease activity
Correspondence to Author: K. Hussain Reddy
Professor, Department of Chemistry, Sri Krishnadevaraya University, Ananthapuramu –515003, India.
nitrate monohydrate complex are reported 12 in the year 1981. In continuation ongoing research work 13-15
from our laboratories we have revisited the structure determination of the complex with good resolution and considered worthwhile to investigate DNA binding and nuclease activity of structurally characterized pentacoordinate copper (II) complex, [Cu(bpy)2(NO3)] NO3 H2O
Experimental: Chemicals:
Analytical grade 2, 2’- bipyridyl, and Cu(NO3)2. 3H2O were obtained from Merck. The solvents were distilled before use. Calf thymus DNA (CT-DNA) and plasmid pBR322 (cesium chloride purified) were purchased from Genie Bio labs, Bangalore, India. Agarose (molecular biology grade) and ethidium bromide (EB) were obtained from Sigma. Solutions of CT-DNA in 50 µM Tris-HCl (pH, 7.0) gave the ratio of UV absorbance at 260 and 289 nm of 1.8 indicating that the DNA was sufficiently free of protein concentration. The DNA concentration was determined by UV absorbance at 260 nm using molar absorption coefficient 6600 M-1. Stock solutions were kept at 4oC and used after not more than four days. DNA binding studies were performed in 50 mM NaCl/5mM Tris base, pH, 7.0 buffer.
Physical measurements:
The elemental analyses were performed using a Perkin Elmer 2400 CHNS elemental analyzer. The molar conductance of the complex in DMF (10 −3 M) solution was measured at 28°C with a Systronic Model 303 direct reading conductivity bridge. The electronic spectra were recorded in DMF with a Perkin Elmer UV Lamda−50 spectrophotometer. FT–IR spectra in KBR disc were recorded in the range 4000–400 cm−1 with a Perkin Elmer spectrum 100spectrometer. The cyclic voltammetry was performed with a CH instruments 660C electrochemical analyzer and a conventional three electrode, Ag/AgCl reference electrode, glassy carbon working electrode and platinum counter electrode.
Nitrogen gas was purged and measurements were made on the degassed (N2 bubbling for 5 min) complex solution in DMF (10−3 M) containing 0.1
M tetrabutylammonium hexaflourophosphate (TBAHEP) as the supporting electrolyte.
Preparation of complex:
To a stirring solution of Cu(NO3)2. 3H2O (1.21 g, 5 mmol) in MeOH (10 mL), a solution of 2, 2’- bipyridyl (4.95 g, 25 mmol) in MeOH (50 mL) was added slowly. The stirring was continued for 30 min. The dark blue coloured complex was formed. It was collected by filtration and washed with a small quantity of MeOH. Yield: 69%; M.P. 228-230 oC,
X-ray crystallography:
Crystal data were collected using the Enraf–Nonius CAD4- MV31 single crystal X-ray diffractometer, Indian Institute of Technology-Madras, Chennai. Enraf–Nonius CAD4- MV31 single crystal X-ray diffractometer is a fully automated four circle instrument controlled by a computer. It consists of an FR 590 generator, a goniometer, CAD4F interface and a microVAX3100 equipped with a printer and plotter. The detector is a scintillation counter. A single crystal is mounted on a thin glass fiber fixed on the goniometer head. The unit cell dimensions and orientation matrix are determined using 25 reflections and then the intensity data of a given set of reflections are collected automatically by the computer. An IBM compatible PC/AT 486 is attached to micro VAX facilitating the data transfer on to a DOS floppy of 5.25″ or 3.5″. Maximum X-ray power is 40 mA × 50 kV. The data collected were reduced using SAINT program. The trial structure was obtained by direct method using SHELXS-86, which revealed the position of all non-hydrogen atoms and refined by full-matrix least squares on F 2 (SHELXS-97) and graphic tool was DIAMOND for windows. All non-hydrogen atoms were refined anisotropically, while the hydrogen atoms were treated with a mixture of independent and constrained refinements.
DNA Binding Study:
10−6 M and varying the nucleic acid concentration (0–7.36× 10⁻⁶ M). Absorption titration experiments were performed by maintaining the metal complex concentration constant while gradually increasing the concentration of CT-DNA with each addition of 10 µl DNA. The ratio of r = [complex]/[DNA] values vary from 23.41 to 2.60. Absorption spectra were recorded after each successive addition of DNA solution. The intrinsic binding constant (Kb) was calculated by using the equation,
[DNA]/(εa-εf) = [DNA]/(εb-εf) + 1/ Kb (εb-εf) ………. (1)
where [DNA] is the molar concentration of DNA in base pairs, εa, εb and εf are apparent extinction coefficient (Aobs/[M]), the extinction coefficient for the metal (M) complex in the fully bound form and the extinction coefficient for free metal (M) respectively.
Gel electrophoresis:
The extent of cleavage of DNA by the copper(II) complexes was monitored using agarose gel electrophoresis with pBR 322 DNA. After incubation for 30 min at 37oC, the samples were added to the loading buffer containing 0.25% bromophenol blue + 0.25% xylene cyanol + 30% glycerol, and solutions were loaded on 0.8% agarose gel containing 100 μg of ethidium bromide. Electrophoresis was performed at 75 V in TBE buffer until the bromophenol blue reached to 3/4 of the gel. Bands were visualized by UV transilluminator and photographed. The efficiency of DNA cleavage was measured by determining the ability of the complex to form open circular (OC) or nicked ircular (NC) DNA from its supercoiled (SC) form. The reactions were carried out under oxidative and/or hydrolytic conditions. Control experiments were done in the presence of hydroxyl radical scavenger DMSO (4 µL).
RESULTS AND DISCUSSION:
[image:3.612.315.564.411.578.2]The complex is stable at room temperature, non-hygroscopic, partially soluble in water, methanol, ethanol and readily soluble in acetonitrile (CH3CN), DMF and DMSO. Analytical data (Table 1) are consistent with the proposed molecular formulae of complex.
TABLE 1: ANALYTICAL DATA OF COMPLEX Complex
formula
Elemental analysis, Found (Calcd.)
C H N M
[Cu(bpy)2(NO3)]
NO3 H2O
45.85
(46.33) 3.45
(3.47)
16.18
(16.21)
11.15
(11.19)
The complex is partially soluble in water, methanol, ethanol and readily soluble in acetonitrile (CH3CN), DMF and DMSO. The complex was dissolved in DMF to perform conductivity measurements. Molar conductivity (90 Ω -1
cm2 mol-1) suggest that the complex (1) is 1:1 electrolyte. The magnetic moment of complex (1) is found to be 1.68 BM. Magnetic moments of complex correspond to spin-only value (1.73 BM) of mononuclear copper(II) complexes.
The electronic spectrum (Fig. 1) of copper(II) complex in DMF solvent was recorded. The complex (1) exhibits two strong bands and one weak band at 36800, 33154 and 16512 cm-1 respectively assigned to π - π*, CT and d-d transitions. The position of d-d band is suggestive of square pyramidal geometry16, 17
FIG 1: ELECTRONIC SPECTRUM OF [Cu(bpy)2(NO3)] NO3
H2O
IR spectrum studies:
FIG. 2: IR SPECTRUM OF [Cu(bpy)2(NO3)] NO3 H2O.
TABLE 2: SELECTED IR SPECTRAL DATA OF
[Cu(bpy)2(NO3)] NO3 H2O COMPLEX
Band frequency (cm-1) Assignment
3428 O-H stretch of hydrated water molecules
3085 Aromatic C-H stretch
2857 ---
1626 ν(C-N) bpy ring str. 1473 νNO of nitrato (B2)
1384 Ionic nitrate
1332 --
1255 νNO of nitrato (A1) 1031 νNO of nitrato ( A1)
771 --
501
A strong peak is present at 1384 cm-1 in IR spectra of[Cu(bpy)2(NO3)] NO3 H2O complex indicating the presence of ionic nitrate (D3h symmetry), which is in agreement with the results of the conductivity experiments. Complex also exhibits a strong band at 3,432 cm-1 assigned to –OH stretching of a water ligand.
Description of crystal structure of complex, [Cu(bpy)2(NO3)] NO3 H2O (1):
Slow evaporation of methanolic solution of complex 1 gave a single crystal of size 0.300 x 0.250 x 0.250 mm3 and was mounted on glass fibre. The cell parameters and the intensity data were obtained using Bruker Smart Apex CCD diffractometer equipped with a fine –focused sealed tube. The complex [Cu(bpy)2(NO3)] NO3 H2O crystallizes in monoclinic with space group of P21/c and with the unit cell a = 12.1125(3) A0, α= 61.7570(10)°, b = 14.6202(4) A0 , β= 85.531(3)°, c = 15.0912(4) A0 , γ = 67.572 (2)° and V=
2158.87(10) Å3 , Z= 4. Crystal data and structure refinements are shown in Table 3. The molecular structure of complex 1 is shown in Fig. 3 together with the numbering scheme in the metal coordination sphere. Unit Cell structure of the complex is shown Fig. 4
[image:4.612.49.302.57.250.2]FIG. 3: ORTEP VIEW OF COMPLEX (1)
FIG. 4: UNIT CELL STRUCTURE OF
The complex: (1)
[image:4.612.315.563.144.647.2]TABLE 3: CRYSTAL DATA AND STRUCTURE REFINEMENT FOR[Cu(bpy)2(NO3)] NO3 H2O
Parameter Data
Empirical formula C20 H18 Cu N6 O7
Formula weight 517.94
Temperature 296(2) K
Wavelength 0.71073 Å
Crystal system Triclinic
Space group P-1
Unit cell dimensions a = 12.1125(3) Å a= 61.7570(10)°.
b = 14.6202(4) Å b= 85.531(3)°. c = 15.0912(4) Å g = 67.572(2)°.
Volume 2158.87(10) Å3
Z 4
Density (calculated) 1.594 Mg/m3 Absorption coefficient 1.068 mm-1
F(000) 1060
Crystal size 0.300 x 0.250 x 0.250 mm3 Theta range for data
collection
2.094 to 24.999°.
Index ranges 14<=h<=14, 17<=k<=17, -17<=l<=17 Reflections collected 40835 Independent reflections 40835 [R(int) = ?]
Completeness to theta = 24.999°
99.9 %
Absorption correction Semi-empirical from equivalents Max. and min.
transmission
0.7799 and 0.7401
Refinement method Full-matrix least-squares on F2 Data / restraints /
parameters
40835 / 194 / 626
Goodness-of-fit on F2 1.022 Final R indices
[I>2sigma(I)]
R1 = 0.0649, wR2 = 0.1622
R indices (all data) R1 = 0.1391, wR2 = 0.2051 Extinction coefficient n/a
Largest diff. peak and
hole 0.482 and -0.686 e.Å-3
Selected bond lengths and bond angles are presented in Table 4. In the complex (1) the Cu ion is coordinated by four nitrogen atoms of two bipyridine ligands. Thus the four coordinate sites of copper are occupied by two bpy ligands. The fifth coordination site of copper is completed by oxygen atom of nitrate ligand (Fig. 3).
TABLE 4: BOND LENGTHS [Å] AND ANGLES [°] FOR [Cu(bpy)2(NO3)] NO3 H2O.
Bond Bond lengths [Å]:-
N(1)-Cu(1) 2.011(6)
N(2)-Cu(1) 1.967(6)
N(3)-Cu(1) 2.079(6)
N(4)-Cu(1) 1.958(7)
N(5)-Cu(2) 1.963(6)
N(6)-Cu(2) 2.011(6)
N(7)-Cu(2) 2.075(6)
N(8)-Cu(2) 1.964(6)
O(1)-Cu(2) 2.199(5)
O(5)-Cu(1) 2.111(6)
Bonds Bond angles ( 0 )
N(4)-Cu(1)-N(2) 176.8(3) N(4)-Cu(1)-N(1) 98.2(3) N(2)-Cu(1)-N(1) 81.7(3) N(4)-Cu(1)-N(3) 80.4(3) N(2)-Cu(1)-N(3) 102.2(3) N(1)-Cu(1)-N(3) 126.2(2) N(4)-Cu(1)-O(5) 88.5(3) N(2)-Cu(1)-O(5) 89.5(3) N(1)-Cu(1)-O(5) 141.1(3) N(3)-Cu(1)-O(5) 92.6(3) N(5)-Cu(2)-N(8) 176.9(2) N(5)-Cu(2)-N(6) 81.3(3) N(8)-Cu(2)-N(6) 99.9(3) N(5)-Cu(2)-N(7) 101.3(3) N(8)-Cu(2)-N(7) 80.2(3) N(6)-Cu(2)-N(7) 129.7(2) N(5)-Cu(2)-O(1) 88.9(2) N(8)-Cu(2)-O(1) 88.2(2) N(6)-Cu(2)-O(1) 135.1(2) N(7)-Cu(2)-O(1) 95.1(2)
Symmetry transformations used to generate equivalent atoms.
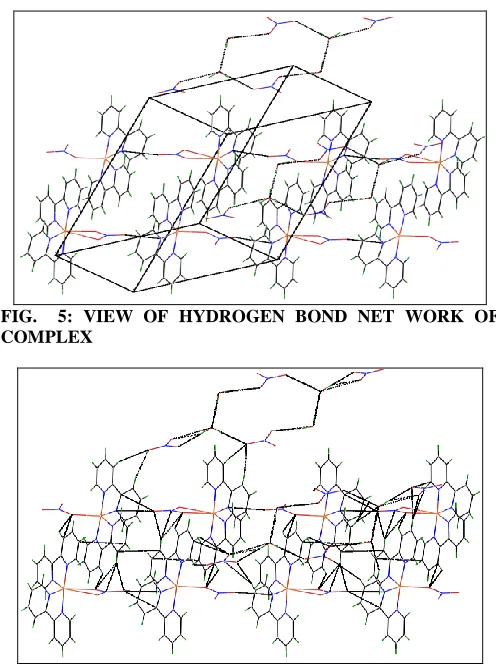
View of hydrogen bond net work and close packing are shown in Figs. 5 and 6 (a, b c) respectively. Hydrogen bonding data are given in Table 5.
FIG. 5: VIEW OF HYDROGEN BOND NET WORK OF COMPLEX
[image:5.612.312.566.54.316.2] [image:5.612.314.562.406.739.2] [image:5.612.48.303.654.754.2]TABLE 5: HYDROGEN BONDING DATA FOR [Cu(bpy)2(NO3)] NO3 H2O [Å and °]
D-H...A d(D-H) d(H...A) d(D...A) <(DHA)
C(1)-H(1)...O(14)#1 0.93 2.50 3.336(11) 149.1
C(4)-H(4)...O(7)#2 0.93 2.42 3.338(12) 168.5
C(7)-H(7)...O(7)#2 0.93 2.56 3.425(12) 154.3
C(10)-H(10)...O(11)#3 0.93 2.52 3.241(12) 134.8
C(12)-H(12)...O(8)#4 0.93 2.64 3.188(13) 118.5
C(14)-H(14)...O(1) 0.93 2.43 3.264(11) 149.6
C(17)-H(17)...O(1) 0.93 2.63 3.468(10) 150.5
C(17)-H(17)...O(3) 0.93 2.59 3.433(10) 151.2
C(21)-H(21)...O(9)#5 0.93 2.38 3.198(11) 147.0
C(24)-H(24)...O(12) 0.93 2.47 3.399(11) 173.7
C(27)-H(27)...O(12) 0.93 2.47 3.390(11) 171.6
C(29)-H(29)...N(11) 0.93 2.67 3.477(12) 145.1
C(29)-H(29)...O(9) 0.93 2.51 3.429(12) 171.8
C(32)-H(32)...O(10)#6 0.93 2.48 3.247(12) 140.0
C(34)-H(34)...O(5) 0.93 2.32 3.084(10) 139.3
O(13)-H(13A)...O(12)#7 0.92(4) 2.02(5) 2.875(10) 154(9) O(13)-H(13B)...O(8)#4 0.90(4) 2.03(5) 2.886(10) 157(8) O(14)-H(14A)...O(13) 0.87(4) 2.10(5) 2.964(10) 170(10) O(14)-H(14B)...O(10)#8 0.88(4) 2.06(5) 2.924(10) 164(9)
Symmetry transformations used to generate equivalent atoms:
#1 -x+1,-y+1,-z+1 #2 x+1,y,z-1 #3 x,y,z-1 #4 -x,-y+1,-z+1 #5 x+1,y,z #6 -x,-y,-z+2
#7 x,y+1,z-1 #8 -x,-y+1,-z+2
The crystal data for complex (1) are different from previously reported 29 data of [(bpy)2 Cu(NO3)]NO3 CH3OH and (bpy)2Cu(NO3)]NO3.
FIG. 6 (b): VIEW OF CLOSE PACKING SHOWING H- BONDING IN [Cu(bpy)2(NO3)] NO3 H2O.
[image:6.612.74.539.66.745.2] [image:6.612.87.527.373.726.2]1. Non classical hydrogen bond of N∙∙∙O type is present between the bipyridil nitrogen and the oxygen atom (not involved in bond formation with metal) of coordinate nitrate ion.
2. Ionic nitrates hydrogen bond with non coordinated water molecules.
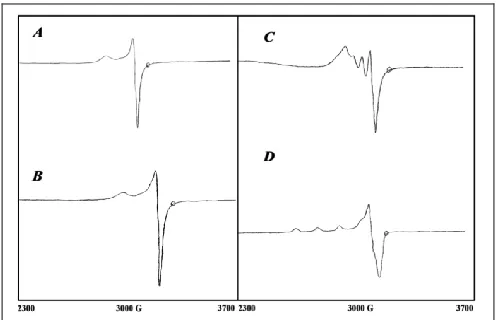
ESR spectral studies:
ESR spectra of [Cu(bpy)2(NO3)] NO3 H2O complex at room temperature and at liquid nitrogen temperature both in solid state and DMF medium are shown in Fig. 7. The g∥ and g⊥ were computed
from the spectra using tetracyanoethylene (TCNE) as a ‘g’ marker. From the spectrum of the complex at 300 and 77 K in the solid state, it is clear that g║ > g⊥ > 2.00 and the G values falling within the range 1.84- 3.12 are consistent with a dx2 – y2 ground state in a square planar or square pyramidal geometry 18, 19. According to Hathaway, if G > 4, the exchange interaction is negligible, whereas G < 4 indicates considerable exchange interaction between the metal centres in the solid complex. Thus, in the present case, the G values indicate some exchange interaction between the copper(II) atoms,.
FIG. 7: X-BAND ESR SPECTRA OF [Cu(bpy)2(NO3)] NO3 H2O AT (A) AT 300K, (B) AT LNT, (C) IN DMF SOLUTION AT 300K AND (D) AT LNT IN DMF SOLUTION
The ESR spectra of the complexes were also recorded in DMF at 300 K and at liquid nitrogen temperature and exhibit a set of four well-resolved peaks in the low-field region and one or two
weaker signals at high field corresponding to the g∥
and g⊥ respectively. The spin Hamiltonian and
orbital reduction parameters of DMF solution of complex(at LNT) are given: g║ (2.16); g┴ (2.06); gavg (2.11); G (2.73); A║X10-5 (0.0128); A┴X10-5 (0.018); K║(1.65); K┴ (0.63); λ (351); α2(0.23).
Electrochemical studies:
Redox behaviour of the complex has been investigated by cyclic voltammetry in DMF using 0.1M tetrabutylammonium hexafluorophosphate as supporting electrolyte. Fig. 8 shows the profile of complex (1) at 25, 50, and 75 mVs-1 scan rates. Electrochemical data obtained at the glassy carbon electrode are given in Table 6.
FIG. 8: CYCLIC VOLTAMMETRIC PROFILE OF
[Cu(bpy)2(NO3)] NO3 H2O
The cathodic peak current function values were found to be independent of the scan rate. Repeated scans as well as various scan rates showed that dissociation does not take place in these complexes. The non-equivalent current intensity of the cathodic and anodic peaks [ ic/ia = 0.945 (1) and 1.252 (1)] indicates quasi-reversible behaviour.
The potential difference (Ep = Epc – Epa) for complex exceeds the Nernstian requirement 59/n mV (n = number of electrons involved in the redox process) which suggests quasi-reversible character. The complexes have large separation (290mV) between the anodic and cathodic peaks, indicating the quasi-reversible character.
TABLE 6: CYCLIC VOLTAMMETRIC DATA OF COPPER(II) COMPLEX
Complex Redox
Couple
Cathodic peak Epc
Anodic peak Epa
∆ EP(mV) E1/2
(V)
ic/ia
[image:7.612.313.565.276.442.2] [image:7.612.49.298.426.586.2]Electronic absorption titrations:
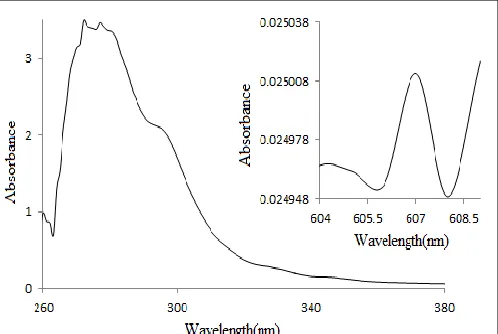
The binding interactions of the complexes with CT-DNA were monitored by comparing their absorption spectra with and without CT-DNA. With increasing DNA amounts, the hypochromism of π - π* absorption band increased up to +15.47, together with red shift of 1 nm indicating the binding of the complexes to DNA. Fig. 9 shows absorption spectra of complex 1 in the presence of increasing amounts of DNA.
FIG. 9: ABSORPTION SPECTRA OF [Cu(BPY)2(NO3)] NO3
H2O IN THE ABSENCE AND PRESENCE OF INCREASING
AMOUNT OF DNA. ARROWS SHOWS THE DECREASE IN
ABSORBANCE UPON INCREASING CONC. OF DNA (0 -
20µM)
The binding of an intercalative molecule to DNA is generally characterized by large hypochromism and significant red shift due to strong stacking interactions between the aromatic chromophore of the ligand and DNA base pairs, with the extent of hypochromism and red shift commonly consistent with the strength of intercalative interaction. However, in the present case, the magnitude of hypochromism and red shift observed for the Copper complex are lower than those observed for typical classical intercalators or partially intercalating complexes. To enable quantitative comparison of DNA binding affinities, the intrinsic binding constants Kb of the complexes for binding were obtained using Equation 1 given in experimental section. Electronic absorption spectral data upon addition of CT-DNA and binding constants of these complexes are given in the Table 7.
TABLE 7: ELECTRONIC ABSORPTION DATA UPON ADDITION OF CT-DNA TO THE COMPLEX
Complex formula
λ max/nm Free Bound
∆λ/nm H% Kb (M-1)
[Cu(bpy)2(NO3)]
NO3 H2O
314 315 1 +15.47 4.89 x 10⁶
The Kb value for the complex 1 is high, probably due to the strong electrostatic attraction between the cationic complex (1) and the negatively charged phosphodiester backbone of DNA [29, 30]. Since the complex is bulky, groove binding 20 of the complexes with DNA is suggested (rather than base pair intercalation).
Nuclease activity: Nuclease activity of complex 1 has been studied by agarose gel electrophoresis using pBR322 plasmid DNA in Tris-HCl/ NaCl (50mM/ 5mM) buffer (pH, 7) in the presence and absence of H2O2 after 30 minutes incubation period at 37°C. Nuclease activity of complex was also investigated in presence of free radical scavenger (DMSO) and reducing agent DTT. DNA cleavage activity of complex was studied at different concentrations. It was found that there is a nominal effect of concentration. Even at lower concentrations the complexes show much nuclease activity. From Fig.10 and Table 8, it is evident that Copper complex cleave DNA more effectively in the presence of oxidant indicating that the Cu(II) complex may be reduced by the peroxide to produce hydroperoxo species. Lanes 5 & 7 of Fig. 10 are almost invisible. It indicates that the DNA is completely degraded by the complex in presence of the oxidant. The hydroxyl free radical formed in the second step leads to DNA damage. This is consistent with the production of hydroxyl radicals by cuprous ions similar to the well known Fenton reaction 21, 22.
[image:8.612.47.300.207.403.2]of copper(I) complex by catalytic reduction which causes the production of more hydroxyl radicals which may support the oxidative cleavage.
The percentage of the three forms of DNA is presented in the Table 8. The decrease in
percentage of supercoiled form of DNA may be considered to estimate the cleavage activity of complex. In the absence of H2O2 the complexes cleaved supercoiled DNA (Form 1) into nicked DNA (Form II) only.
FIG. 10: IMAGES OF DNA CLEAVAGEBY [Cu(bpy)2(NO3)] NO3 H2O
[image:9.612.95.497.112.242.2]Lane 1: 1kb DNA ladder; Lane 2: DNA control; Lane 3: DNA + H2O2; Lane 4: DNA + Nitrate complex (200µM); Lane 5: DNA + Nitrate complex + H2O2; Lane 6: DNA + Nitrate complex + DMSO; Lane 7: DNA + Nitrate complex + DTT
TABLE 8: SELECTED SC PBR322 DNA CLEAVAGE DATA OF [Cu(bpy)2(NO3)] NO3 H2O
Lane No. Reaction Condition Percentage of
Form – I Form –II Form – III
1 1kb ladder - - -
2 DNA control 55 45 ND
3 DNA + H2O2 38 62 ND
4 DNA + Complex (200 μM) 29 44 27
5 DNA + Complex + H2O2(200 μM) 04 76 20
6 DNA + Complex + ( DMSO ) 37 43 20
7 DNA + Complex + ( DTT ) 08 32 60
CONCLUSION:
The complex [Cu(bpy)2(NO3)]NO3H2O. has been characterized based on molar conductivity, electronic and IR spectra. The structure of [Cu(bpy)2(NO3)] NO3 H2O complex is determined using single crystal X-Ray diffraction studies.. The complex is also investigated using ESR spectroscopy and cyclicvoltammetry. DNA binding constant of the complex is determined using absorption spectroscopy. Nuclease activity of the complex is investigated using gel electrophoresis experiments. Even at lower concentrations the complex shows much nuclease activity. The complex cleaves DNA more effectively in the presence of oxidant.
Supplementary Material: CCDC 1051153 contains the supplementary crystallographic data for Cu complex. These data can be obtained free of charge via http://www.ccdc.cam.ac.uk/conts/ retrieving.html, or from the Cambridge Crystallographic Data Centre, 12 Union Road, Cambridge CB2 1EZ, UK; fax: +44 1223 336 033; or e-mail:[email protected].
Supplementary information is available at www.ias.ac.in/chemsci.
ACKNOWLEDGEMENT: One of the authors (S. Chandrasekhar) is thankful to UGC, New Delhi for the award of BSR Junior Research Fellowship. The authors are thankful to UGC, New Delhi [Sanction No. Lr. No. F 40-80/2011(SR)] for financial support. The authors also thank UGC and DST for providing equipment facility under SAP and FIST programs respectively. KHR is thankful to UGC for the sanction of one-time grant [Sanction Lr. No. F.19-106/2013(BSR)] for financial support.
REFERENCES:
1. Hussain Reddy K: Bioinorganic Chemistry, New Age
International Pvt. Ltd, New Delhi 2003.
2. Wang T, Guo Z; Curr. Med. Chem, 2006; 13:525.
3. Agwara MO, Ndifon PT, Ndosiri NB, Paboudam AG,
Yufanji DM Mohamadou A: Bull. Chem. Soc. Ethiop. 2010; 24:383.
4. Esther OO, Adeoye IO, Florence A OA: J. Inorg. Chem,
2013; 3:26.
5. Maurya RC, Chourasia J, Sharma P: Indian J Chem,
6. Prashanthi Y, Kiranmai, K, Sathish, Kumar K, Vijay Kumar C, Shivaraj M: Bioinorganic Chemistry and Applications, 2012: Article ID 948534, 8pages.
7. Kelland L R: Eur J. Cancer, 2005: 41:971.
8. Jacques R, Antoine V, Philippe P, Jacques B: Crit. Rev.
Oncol. Hemat. 2004: 51, 205.
9. Wang XL: J. Inorg. Biochem, 2004; 98: 423.
10. Dhar S, Nethaji M,. Chakravarthy AR: J. Inorg. Biochem,
2005; 99: 805.
11. Li LZ: J. Inorg. Biochem. 2005; 99: 1076.
12. Faraday RJ, Hodgson P, Suresh T, Hathaway BJ: JCS
Dalton, 1981; 2070.
13. Hari Babu P, Patil YP, Hussain Reddy K, Nethaji M:
Inorg. Chim Acta, 2012; 392: 478.
14. 14. Hari Babu P, Patil YP, Hussain Reddy K, Nethaji
M: Trans Met Chem., 2014: 39:167.
15. Chandrasekahr S, Hussain Reddy K: J. Indian Chem. Soc,
2016: 93:309.
16. Chakravarthy AR, Reddy PAN, Santra BK and Thomas
AM: Proc. Indian Acad. Sci (Chem. Sci.) 2002; 114: 391.
17. Chailueecha C, Youngme S, Pakawatchai, C Chaichit N,
Van Albada GA Reedujk J: Inorg. Chim Acta, 2006; 359: 4168.
18. Zavalij PY, Burton BL, Jones Jr, WE: Crystal Structure
Commun, 2002:C58: m330-333
19. Philip V, Sunil V, Kurup MRP, Nethaji M: Polyhedron,
2005; 24:1133.
20. Selvi PT, Palaniandavar M: Inorg. Chim. Acta, 2002; 337;
420.
21. Song YM, Xu JP, Ding I, Hou Q, Liu JW and Zhu ZL: J
Inorg. Biochem, 2005; 103:396.
22. Raja K, Suseelamma A, Hussain Reddy K: J. Chem. Sci,
2016; 128:23.
All © 2013 are reserved by International Journal of Pharmaceutical Sciences and Research. This Journal licensed under a Creative Commons Attribution-NonCommercial-ShareAlike 3.0 Unported License. This article can be downloaded to ANDROID OS based mobile. Scan QR Code using Code/Bar Scanner from your mobile. (Scanners are available on Google Playstore)
How to cite this article:
Chandrasekhar S and Reddy KH:DNA binding and nuclease activity of structurally characterized Copper(II) complex. Int J Pharm Sci Res
![FIG. 2: IR SPECTRUM OF [Cu(bpy)2(NO3)] NO3 H2O.](https://thumb-us.123doks.com/thumbv2/123dok_us/8882053.946567/4.612.47.311.53.439/fig-ir-spectrum-cu-bpy-no-no-h.webp)
![TABLE 5: HYDROGEN BONDING DATA FOR [Cu(bpy)2(NO3)] NO3 H2O [Å and °] D-H...A d(D-H) d(H...A)](https://thumb-us.123doks.com/thumbv2/123dok_us/8882053.946567/6.612.74.539.66.745/table-hydrogen-bonding-data-for-no-a-and.webp)

![TABLE 8: SELECTED SC PBR322 DNA CLEAVAGE DATA OF [Cu(bpy)2(NO3)] NO3 H2O Lane No. Reaction Condition Percentage of](https://thumb-us.123doks.com/thumbv2/123dok_us/8882053.946567/9.612.95.497.112.242/table-selected-cleavage-data-lane-reaction-condition-percentage.webp)
