MLD-LEACH: AN ENHANCED LEACH PROTOCOL FOR
MULTIMEDIA WIRELESS SENSOR NETWORK
1
M. T. BENNANI, 2M. AIT KBIR
1
LIST Laboratory, Doctoral Studies Center "Sciences et Techniques de l'Ingénieur ", Abdelmalek Essaadi University, Morocco
2
LIST Laboratory, Doctoral Studies Center " Sciences et Techniques de l'Ingénieur ", Abdelmalek Essaadi University, Morocco
E-mail: 1 [email protected], 2 [email protected]
ABSTRACT
Transferring multimedia content such as videos and images over a wireless sensor network represents an open subject of research. It can be treated in different ways. For instance, we can send images through the network without compression using the spatial domain or using the frequency domain. In this paper use wireless sensor network routing protocols, such GPSR, for image transmission by processing it the frequency domain using the DCT transform. Actually, the aim of our work is to propose a new variante of Leach protocol, named MLD (Multiple Level Delay)-Leach, that is tested by studying the impact of image compression on energy consumption and the quantity of images received by the sink. For this purpose, we used Omnet++/Castalia as a simulator. Two applications are used in this simulation: the first one sends images without compression, and the second application sends images using a compression in the frequency domain. We are interested by this approach to study network energy behavior over time.
Keywords: Castalia, WMSN, LEACH protocol, OpenCV
1. INTRODUCTION
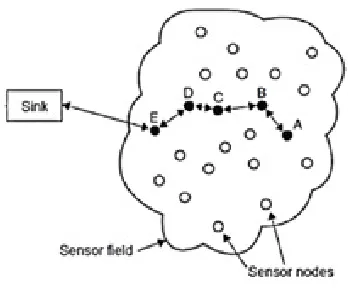
[image:1.612.336.510.409.556.2]As a result Of the unceasing development in micro-electro mechanical system (MEMS) and wireless communication technologies, low-priced and small communication systems are at hand called ''sensors". Actually, They are composed of transmission unit, a power unit control, a processing unit, a control unit and a sensing unit [1]. Wireless sensor network is a formation of numerous sensors. In fact, they capture information about the environment such as temperature, pressure etc.. . Then, the collected scalar data are sent to the base station (sink) as shown in figure 1. Actually, WSN is used in multiple domains like industry, medicine, agriculture, etc... . But, WSN suffers from multiple weaknesses in resources. Firstly, the processing power is limited. Secondly, the available memory is limited. Lastly, the energy is limited which affects the lifetime of the sensors. [2]
Figure 1:Wireless Sensor Network structure
of ressources, the need of High band with, the use of cross-layer and the coding of multimedia content [3]. In fact, WSN and MWSN have many applications in multiple fields of interest.
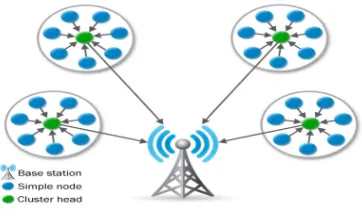
Figure 2: Architecture of WMSN
The development of sensors made possible Internet of things (IoT) possible. Since the world is interconnected and smarter every minute than before, IoT helps to make things easier and faster for us. Thus, WMSN uses scalar and multimedia data in multiple applications such as smart-grid or monitoring [5] etc... .
The routing process is an important phase in WMSN, because it's a major factor in energy consumption. As a consequence, it affects the lifetime of the network. In fact, there are multiple routing protocols like DD3 [6], SPIN [7], SAR [8], LEACH [9] etc.. . In this paper we choose LEACH, because it makes energy consumption a priority [9]. An image can be presented and processed in two domains, spatial or frequency domains. We can get the frequency domain by using the Fourier or DCT transforms. JPEG image coding uses a compression techniques based on DCT transform [12]. In this paper, we used the JPEG coding process result to reduce the number of packets transfered over a WMSN which can affect the energy consumption of the network[13].
The LEACH protocol is not suitable for WMSN [4]. Therefore, we prpose an improved version of the protocol, which combines image compression and packets routing to have the maximum quality of the transferred images. Actually, we use layers to minimize the number of intermediate CHs. Thus, the energy consumption is less, and the quality of constructed images by the sink has a better quality.
We are going to see the following sections: firstly, we will present related works. Secondly, we will present our proposed protocol. Thirtly, we will analyze the results of simulation.
2. RELATED WORK
2.1 LEACH protocol:
In 2000 Wendi B, Heinzelman proposed a new protocol called LEACH [9]. The simulation is executed in an equal period of time called Round. In each round two phases are performed: cluster setup phase and steady phase. During the cluster phase an election is made by each node to decide whether or not it's going to be a cluster node throughout the present round. Each node picks a random number which is compared which is compared to the threshold T(n). Then, we compare the chosen value and T(n). The node is elected cluster head if the picked number is minor than the threshold , otherwise it's not.
Eq. 1
According to the above formula p is the designate percentage of CH(Cluster Head), r is the round in progress and G is the list of nodes that wasn't picked as CH during 1/P rounds. Therefore, if a node is picked as a CH, it has to be elected CH only after 1/P rounds.
[image:2.612.317.507.337.376.2]Each CH advertises itself to the non CHs by sending an invitation. When they receive invitations they choose to join the CH that as the most powerful strength of signal. The cluster setup ends by the creation of clusters. Then each CH each member of the cluster will send its data to its CH in a limited period of time called "frame". This period of time is determined by CH using a TDMA packet. The figure below will shows the process.
Figure 3: LEACH Structure
[image:2.612.333.514.566.677.2]2.2 M-Leach
CHs in this protocol [10] don’t send the data directly to the sink. Instead, it takes CHS as a relay depending on the most favorable path to the sink throw intermidiates CHs.
2.3 Deficiencies of the LEACH protocol
Even if the lifetime of the network is more than other protocols such as plane multipath routing, it still has some drawbacks. The cluster-head communicates directly with the sink which causes some problems. Firstly, if the sink is far from the cluster-head, it will be impossible to communicate with it. Secondly, even if the sink is reachable by the cluster-head, the necessary energy to transmit data will be so high. Thus, the energy consumption of the network will increase. Therefore, the liftime of the network will be affected.
3 THE PROPOSED PROTOCOL
Our paper proposes new protocol named MLD-leach(Multiple Level Delay) that improves the leach protocol. Our protocol has as goal to extend the lifetime of the network by reducing the energy consumption. Also, make the protocol suitable for the multimedia content. To reach this goal, we use the same number of CHs as leach. Actually, in the leach protocol each CH sends the data directly to the sink. This process causes two major problems. Firstly, the CHs which are too far will not be able to send data to the sink. Secondly, the data sent from different CHs arrive simultaneously, which causes the lost of data, which affects the number of received packets. Hence, quality of receiving images is affected. In order to solve these problems we use multi-hope, distance and delay to choose the next CH.
3.1 Initialization phase:
After the election of all nodes, the sink broadcasts a message using the maximum energy transmission. The CHs that receive the message form the first level, store the distance from the sink, the strength of the signal, delay and the ID of the sink. Then each CH of the first level will rebroadcast the same message with the information of the sink (distance, delay) to the next level. In the level two, CHs create a table in which each line represents the CH's information about the source of the message. The informations are the total distance from the sink, the distance from the previous CH, the total delay from the sink, the strength of the signal and the delay between the previous CH and current CH. Then the same message will be send to the next level with total distance from the sink and
total delay. Then, the same process is repeated until all CHs are reached.
3.2 The Update phase
The update phase is launched when the first phase ends. Also, it's repeated every period of time.This period fixed durig the simulation . This process assures the update of the routing table in all levels.
3.3 The cluster setup phase
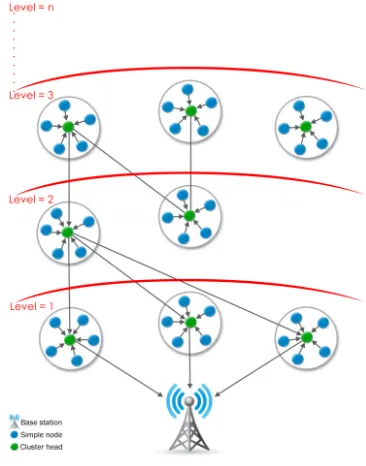
[image:3.612.326.509.324.557.2]This phase is the same as the original leach. Furthermore, we use this phase to update the delay in the table.This table contains the list of the CHs of the inferior level along with the distance ,the delay and ths distance from the sink. Also, the steady phase uses the same process as leach. After that phase, the routing phase begins. As shown in Figure 4.
Figure 4: Multi-level structure
3.4 The routing phase
In this phase, the CHs send the gathered data from their members to the next node.
The figure 4 shows that the CHs that belong to level one send their data directly to the sink using the strength of the signal. In the case of the CHs that belong to level two, we have two cases:
• If we have a CH which have a minimum total with a level superior than two, we have also two cases:
o If we have equal delays between the
previous CHs, we pick the node which has the shortest distance as shown in Figure4.
o We choose the node which has the
shortest delay if we have different delays as shown in figure4.
This process is repeated every time we want to transmit. Therefore, we can balance the energy consumption, to make sure that the maximum data are sent with the best delays.
4 SIMULATIONS AND RESULTS
4.1 Application layer
[image:4.612.329.529.213.372.2]In this paper, we compress images before sending them through to the network. This process is done in the application layer. We used the spectral aspects of images. We take an image, and divide it into small blocs 8×8. In this simulation we use the gray image which is presented in in figure 6.Then, we apply the DCT to each bloc. After that, we apply the Quantization on the DCT result. In order to reduce the size of data before transmission, we use the RLE compression technique. After that, the compressed bloc is sent over the network with its meta-data(size,bloc coordinates). Once the sink receives the data we apply the reverse process to retrieve the bloc, by applying the reverse quantisation using the same quantization matrix used in the source node. Finally, we create the image progressively from the received blocs.
Figure 5: Coding And Decoding Process Using DCT
4.2 simulation setup:
In this section we are going to give details about the simulations that we concluded and the results that we got. In fact, we used Castalia simulator [11] as a tool of evaluation.We used the radio model
CC2240 to simulate a real radio transmission. In fact, this radio model leads a few rounds number. Also, we compared our new protocol with the original leach and M-leach .
In our simulation we suppose that all the nodes are not reachable by the sink. The following table shows the proprieties used in our simulation. Also, we used 100 nodes distributed uniformly..
Table 1: Simulation Parameters.
Parameter Value
Tpology size 200x200 m2
Number of nodes 200
Round length 40s
CH probability 0.05
Number of trials 20
Initial power 30j
BS position (0,0)
Size of image 64x64
Number of sent images 1
Delay between images 200 s
Delay between sending packets
0.2 s
Quantization percentage 98 %
[image:4.612.367.509.414.571.2]The table I represent the parameters of the simulation.
Figure 6: The Gray Scale Image Used In Simulation
The figure 6 shows the image that we used in our simulation . in this simulation,each node sends an image like the figure 6 through the network,which makes 100 images.
4.3 Analysis of results:
[image:4.612.80.286.516.644.2]term of transferring images. The first metric is measuring the number of images in function of their corresponding quality. Actually, this metric allows us to evaluate the quality of receiving images. The second metric is the lost packets during the transmission.This metric shows us how network in term of delivering packets, which influences the number of received images and their quality.
Figure 7: Graph Of Dead Nodes
The figure 7 represents the number of dead nodes during the time of simulation. It shows a comparison between Leach, M-leach and MLD-Leach. Concerning LEACH, it shows that the first node dies in Round 42 and the last mode dies in Round 48. It also shows that the lifetime of the network is the smallest compared to the other protocols. In M-Leach the first nodes dies early, but the last node dies after leach in round 72. But the lifetime of the network of the network is longer than leach. Lastly, MLD-Leach has the longest lifetime of the network. Besides, the first node dies, after all other protocols die in Round 78 and the last node is dead in round 80, which can be explained by the fast draining of energy of the left sensors.
The results of leach can be explained by the fact that the cluster heads transmit directly to the sink with maximum energy of transmission to reach the sink. On the other side, the M-leach extends the lifetime of the network compared to leach protocol. Although, the M-leach protocol uses a variable number of intermediate clusters-heads, which puts some pressure on some cluster-heads rather than others. Hence, it has a direct effect on these CHs by dropping their energy faster than other CHs. Finally, our protocol proves that it is more consistent and extend the lifetime of the network too far compared to other protocols. It can be explained by the fact that we update the routing table periodically. Then, choosing the cluster-head,
which has the minimum pressure at the lowest level. Also, the optimization of energy transmission minimizes the energy consumption of CHs.
Figure 8: Number Of Images Per Quality Using LEACH Protocol
[image:5.612.318.512.484.621.2]The figure 8 shows that the Sink constructs images with a variety of qualities between 3% and 75% of the original image. We notice that the constructed images with 10% and 12,5% present the majority. Also, we can see that. By the using Leach, the number of received images is the biggest, but only one image has quality has 75% of the original image. The quality of the other constructed images is less than 40%. This can be reflected by the high level of lost packet related to this protocol, which is explained by the single hop from CHs to the Sink. This mode of transmission creates congestion around the Sink. Besides, the CHs which cannot reach the Sink can not transfer their images.
Figure 9: Number Of Images Per Quality Using M- LEACH Protocol
less than 40%. The quality of the other constructed images is less than 56%. These remarks can be explains by the fact that the M-leach suffers from a big number of lost packets, because of the high number of intermediates CHs. Also, the random election of CHs and the limited time of rounds make prevent packet the packets to get to the Sink in the current round, because they jump from a CH to another.
Figure 10: Number Of Images Per Quality Using MLD-LEACH Protocol
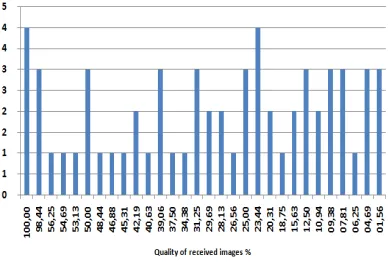
By using the MLD-Leach, The figure 9 shows that the Sink constructs images with a variety of qualities between 14% and 100% of the original image. We notice the MLD-leach the Sink can construct images with good quality (100 %)..These results can be explained by the fact that the MLD-leach has the fiewer number of lost packets.Also, the number of intermediate CHs is controlled by the number of levels.
Figure 11: Number Of Lost Pakets Per Protocol
This figure expresses the number of lost packets for each protocol. It is clear that our variant of the Leach protocol goes beyond the standar versions.
It is clear that our protocol is saving more energy which is expressed by the lifetime of the network. Also, by using our protocol, the sink reconstructs images with better quality compared to other protocols.
We are interested in future works by improving the results of the figure 10 by using a strategy that sends overlapped blocks over the network in order to complete the the missing image information.
5 CONCLUSION
In this paper, we studied two protocols, which are Leach and M-Leach. The main advantage of Leach is saving energy. M-Leach face up the most disatvantage of Leach which is distance. Actually, M-Leach can send from long distance. Then, we proposed a new protocol based on Leach and M-Leach protocol that supports multimedia content. In fact, Leach protocol is designed to save more energy without taking into a count the distance between nodes and the transfer multimedia transfer. We proved that our protocol surpasses LEACH and M-LEACH protocols in term of energy lifetime of the network and fixes its drawbacks. Also, it can transfer more images with better quality.
REFRENCES:
[1] D. Estrin, D. Culler, K. Pister, and G. Sukhatme, “Connecting the physical world with pervasive networks,” IEEE Pervasive Comput., vol. 1, no. 1, Jan. 2002, pp. 59–69.
[2] K. C. Rahman, “A survey on sensor network,” Journal of Computer and Information Technology, vol. 1, no. 1, 2010, pp. 76–87. [3] M. Abazeed, N. Faisal, S. Zubair, and A. Ali,
“Routing Protocols for Wireless Multimedia Sensor Network: A Survey,” Journal of Sensors, vol. 2013, pp. 1–11.
[4] M. A. Kbir and M. Bennani, “Round time adaptation for image transfering over wireless sensor networks leach protocol,” in 2016 4th IEEE International Colloquium on Information Science and Technology (CiSt), 2016, pp. 896– 900.
[5] M. S. Jamil, M. A. Jamil, A. Mazhar, A. Ikram, A. Ahmed, and U. Munawar, “Smart Environment Monitoring System by Employing Wireless Sensor Networks on Vehicles for Pollution Free Smart Cities,” Procedia Engineering, vol. 107, Jan. 2015, pp. 480–484. [6] C. Intanagonwiwat, R. Govindan, D. Estrin, J.
Heidemann, and F. Silva, “Directed Diffusion for Wireless Sensor Networking,” IEEEACM Trans Netw, vol. 11, no. 1, Feb. 2003, pp. 2–16. [7] W. R. Heinzelman, J. Kulik, and H.
[image:6.612.97.286.513.609.2][8] K. Sohrabi, J. Gao, V. Ailawadhi, and G. J. Pottie, “Protocols for self-organization of a wireless sensor network,” IEEE Pers. Commun., vol. 7, no. 5, Oct. 2000, pp. 16–27.
[9] W. R. Heinzelman, A. Chandrakasan, and H. Balakrishnan, “Energy-efficient communication protocol for wireless microsensor networks,” in Proceedings of the 33rd Annual Hawaii International Conference on System Sciences, 2000, p. 10 pp. vol.2–.
[10] R. V. Biradar, S. R. Sawant, R. R. Mudholkar, V. C. Patil, and others, “Multihop routing in self-organizing wireless sensor networks,” International Journal of Computer Science Issues (IJCSI), vol. 8, no. 1, 2011, pp. 155–164. [11]“Home.” [Online]. Available:
https://castalia.forge.nicta.com.au/index.php/en/. [Accessed: 21-Sep-2016].
[12] M. Antonini, M. Barlaud, P. Mathieu, and I. Daubechies, “Image coding using wavelet transform,” IEEE Transactions on image processing, vol. 1, no. 2, 1992,pp. 205–220. [13] A. Mammeri, A. Khoumsi, D. Ziou, and B.
Hadjou, “Modeling and adapting JPEG to the energy requirements of VSN,” in Computer Communications and Networks, 2008. ICCCN’08. Proceedings of 17th International Conference on, 2008, pp. 1–6.