Application of Deep Neural Network for Diabetes
Classification and
Prediction
D. Santhakumar1, Dr. S. Logeswari2
1
Assistant Professor, Department of CSE, CK college of Engineering and Technology 2
Professor and Head, Department of CSE, Bannari Amman Institute of Technology
Abstract: Diabetes mellitus is one of the major non-communicable diseases which have great impact on human life today. The statistics show that one in two adults with diabetes is undiagnosed, and in future there is a chance of one in 10 adults will have diabetes. By applying computational analytics on medical analytic data, the massive amount of data generated by the healthcare systems, that will be used to create medical intelligence which is drive medical prediction and forecasting. Developing medical intelligence out of the medical data available will create healthcare system to be patient centered and that will reduce medical cost and hospital readmission. Our work proposes a Neural System model for classifying patients with diabetes based on data sets with diabetic patients.
The Pima Indians Diabetes Dataset is been used. In order to set the features vector, Diabetes Pedigree Function is used with multiple premises.
The Neuro modeling is implemented using MATLAB Toolbox. The performances of the algorithm are analyzed in terms of specificity, precision and sensitivity. The proposed classification algorithm using comparison of SVM, Naive Bayes and Decision Tree are trained and tested on Indians Diabetes Database, proving maximum accuracy for training and testing data to make the banking and healthcare decision.
Keywords: Recurrent neural network, Support Vector machine, Precision, ROC(Receiver Operating Curve), Pima dataset, F-Measure, Accuracy, Naive Bayes, Decision Tree.
I. INTRODUCTION
Diabetes mellitus is a metabolic disorder which is portrayed by the changing behavior that appears in the blood glucose level of the human body. The resultant effect is the unusual or abnormal secretion of insulin which increases or decreases from the normal levels. In [1] the occurrence of diabetes is studied and it has been observed that more than half of diabetics is caused through heredity factors.
The levels of diabetes can be classified in two major parts: Type 1 and Type
2(there are other types also but this two are referred as most prevalent types). The vulnerability of Type 1 is secretion of affected β cells by the human pancreas that limits the blood glucose level less than that of required. Almost 90 percent of the diabetes is Type 2 which is caused because of deficiency in insulin secretion. In India, the growth of diabetes increases in a rapid manner such that more than 62 million people of the country are currently identified to be affected by the disease. According to a recent survey recorded during the World Health Day (April 7,
2018), India ranked second place with 64.5 million people affected with diabetes following china. As per the report of World Health Organization (WHO) 2016, it is noted that diabetes had been a cause for death of almost two lakhs and twenty thousand people in India alone.
II. RELATED WORK
In this section, review of recent literature related to diabetes patient classification has been carried out. Researches in [2] proposed a machine learning methodology to differentiate between patients affected with diabetes and patients not affected with diabetes based on the feature vector obtained through the diabetes patient’s dataset. The method has been applied towards the real world data and evaluated. To perform training of the model six classification algorithms namely J48, Multilayer Perceptron (a deep learning algorithm), Hoeffding Tree, JRip, BayesNet and Random Forest had been used and obtained a precision equal to 0.757 and the recall of 0.762.
Authors in [3] had proposed a model that utilizes improved K-Means and logistic regression algorithms for the prediction of high risk Type 2 Diabetes group. This model is a combinatory model which has both cluster and class for guaranteeing the prediction accuracy. The accuracy obtained by this model after the validation with real time dataset is 94 percentage which ensures that this model is reliable and effective
P.Suresh Kumar et al.[4] work is focused towards predictive analysis for the treatment of diabetes using a regression based data mining technique. Mode prediction is carried out via Oracle Data Miner (ODM) and the experimentation is performed through the Support Vector Machine (SVM). This method has segregated the age groups of the patients into two categories and the impact of the diabetes level had been noted. This level had been a feature set for the SVM to classify the patients into two groups (i.e. patients with diabetes and without diabetes)The major objective of work doneby Mario W.L et al [5] is to develop a web application which utilizes the classifiers and the real world data set to perform segregation in between the patients with and without diabetes. To develop a prediction model, the evaluation of thirteen classification models are performed. In order to verify the robustness of each model, the accuracy and ROC curve are measured and compared with one another. As the outcome of this verification process it is noted that random forest ranked top among all the other models from the perspective of accuracy and ROC curve calculation. Neelamshobha Niralaet al [6], recently proposed a systematic review that combines the application areas of machine learning, data mining and the wide variety of tools available in the diabetes research that focus towards, prediction and diagnosis of diabetes. The review stated that almost 85 percent of the machine learning algorithms used for diabetes prediction and diagnosis are supervised learning approaches and remaining 15 percent fall in the category of unsupervised learning approach. Among this approaches Support Vector Machine (SVM) is considered to be widely used and suitable methodology in diabetes research.
Researches in [7] had proposed a Deep Neural Network framework diabetes data classification that utilizes stacked auto encoders. The DNN is built by cascading the stacked encoders with soft max classifier. Proposed framework is compared with different neural network approaches and it is identified that the model provides high level accuracy of 86.26 percent and the precision value of 90.66 percent and the recall of 87.92 percent which portrays that the proposed model is an ideal classification model. Han Wu, Shengqi Yang et al [8] described the combination technique for elemental analysis of diabetes toenails and machine learning techniques for the classification of diabetes that falls in the category of type 2. Chemical combinations of the diabetes undiagnosed patients and volunteers without diabetes are compared and without diabetes. To validate the proposed methodology forty six machine learning models are compared and the seven out of nine samples provided the accuracy level of 0.90.
III. METHODOLOGY AND EXPLANATION
Deep learning comes under the category of machine learning algorithms. It performs feature extraction and transformation takes place by using nonlinear functionalities. The learning can be either supervised or unsupervised. In deep neural networks feature extraction and classification are not explicitly done. Recurrent neural network (RNN) has the capability to extract dynamic temporal behaviour from received input time sequence. RNN is a combination of nodes that consists of neurons which has directed connections to other nodes. Convolutional neural network (CNN), consists of three major subdivisions namely an input layer, an output layer and a layer consisting vast number of hidden layers. Convolutional, pooling and fully connected layers together forms a hidden layer. Our proposed architecture gets the input from the Pima Indian diabetes dataset and it takes the specified five different vector levels that has following features:
1) Diastolic blood pressure in millimetre Hg (F1) 2) Triceps skin fold thickness, expressed in mm (F2)
3) Body mass index, expressed in weight in kg/(heightin m)ˆ2(F3). 4) Diabetes pedigree function (F4)
A. PIDD-Pima Indians Diabetes Dataset
The five features are chosen from the Pima Indian diabetes dataset. We extracted the features of vector from a freely available dataset from UCI machine repository with standard dataset for any research purpose that have been include how many people were diabetes affected and not affected patients. The Pima dataset comprises of medical detail of 768 patient instance. The dataset also comprised as numeric-valued 5 attributes here the value of one class ’A’ treated as tested with negative for diabetes and value of another class ’B’ is treated as tested with positive for diabetes.
B. Preprocessing Data
Data Preprocessing is a technique which is used to convert the raw data into a clean data set with help of normalization. Normalization is the process of reducing the redundancy and dependency of data. Whenever the data is gathered from different sources it is collected in raw format which is not feasible for the analysis for the diabetes dataset.
C. Classification of SVM(Support Vector machine) Algorithm
[image:3.612.153.465.353.445.2]Classification is techniques is a one of the machine leaning technique. In this technique used for classify the data from after the preprocessed data. The Pima India diabetes dataset are SVM based training data set are classified as tested in which tested positive and tested negative. There are two-class training sample that the goal of a SVM is to find the best highest-margin separating hyperplane between the two classes [9]. For best generalization hyperplane shouldn’t lie in closer to the data points belong to the other class. Hyperplane must be selected which is distant from the data points from each category. The points that lie nearest to the margin of the classifier are the support vectors [10]. The Accuracy measures of the experiment is evaluated using MATLAB interface. The SVM finding the optimal separating hyperplane by which maximizing the distance between the two decision boundaries. Confusion matrix using represented the class A and B result.
Fig 1 Proposed system Architecture
D. Classification of Naive Bayes Algorithm
Naive Bayes is a classification algorithm with a represent which defines all the features are independent . In this status of a separate feature in a class doesn’t affect the status of another feature. Since it is based on conditional probability and it will considered as a powerful algorithm hire for classification purpose. It is working well for the data with imbalancing problems and missing some values. Naive Bayes is a machine learningclassifier which engagethe Bayes Theorem. Using Bayes theorem based on posterior probability P(G|X) can be formulated from P(G),P(X) and P(X|G) [11]. Therefore, P(G|X) = (P(X|G) P(G))/P(X)Where, 1) P(G|X) = Target class’s posterior probability .
2) P(X|G) = predictor class’s probability. 3) P(G) = class G’s probability being true. 4) P(X) = predictor’s prior probability.
The evaluate performance of Naive Bayes algorithm using Confusion Matrix represented the class A and B result.
E. Decision Tree Classifier
F. Various Measures of Performance with Accuracy Analysis
We used five metric measures to evaluate the resuSlts of the SVM, Naive Bayes, and Decision Tree are the classification: Precision, Recall, F- Measure and ROC Area. The precision has been computed with the proportion belong into class X among all those which were assigned to the class. It is the ratio of the number of applicable records fetched to the total number of inapplicable and applicable records.
Precision = tP
tP+fP
wheretP represent the number of true positives and fP represent the number of false positives. The recall has been computed as the proportion assigned to class X, among all the portion belonginto the class, i.e., how much portion of the class was captured. It is the ratio of the number of importantrecords fetched to the total number of important records.
Recall = _tP tP+fn
wheretP represent the number of true positives and fn represent the number of false negatives. The F-Measure is used to measure a test’s accuracy. In this score can be interpreted with the weighted average of the following two metrics the precision and recall
F-Measure = 2* _Precision* Recall_ Precision+ Recall
The Roc (Receiver Operating curve)Area is the probability of a positive instance are randomly chosen and is as classified above a negative randomly chosen.
The classification analysis consisted of building classifiers orderly evaluate the feature vector accuracy to distinguish between diabetes affected patients and not affected patients. For training data set where F is defined as the number of the features used in training dataset phase (F = 5).For the learning phase of dataset, we used in this paper as k-fold (10 fold)cross-validation: the dataset is randomly partitioned into k samples.
A single sample is retained as the validation dataset for testing the model, while the remaining k−1 samples of the original dataset are used as training data. We repeated the process for k = 10 times; each one of the k samples has been used once in the validation of dataset. To obtain a single estimate, then we compute the average of the k as 10 results from the folds.
Accuracy =
TP+TN
Total number of samples
Here, Accuracy is calculated as Total number of samples that have present in TP and TN. TP represented as True Positive, TN represented as True Negative. Accuracy is determined as the accuracy of algorithm in predicting instance.
IV. RESULT ANALYSIS
In this proposed system, we have chosen the database for Pima Indians Diabetes Dataset (PIDD) and it was taken 5attributes with F1 to F5
and it have 768 number of instance represented in
Table 1.
Database No. of
Attributes
No. of instance
PIDD 5 768
Class
A
B
A-Tested Negative
B-Tested Positive
500
268
0
0
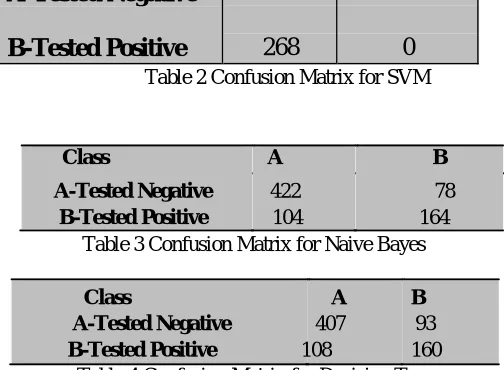
[image:5.612.179.431.138.323.2]SVM , Naive Bayes and Decision Tree are the classification algorithm using finding the result for Tested Negative and Tested positive using Confusion matrix represented the Class A and Class B.
Table 2 Confusion Matrix for SVM
Class A B
A-Tested Negative 422 78
B-Tested Positive 104 164
Table 3 Confusion Matrix for Naive Bayes
Class A B A-Tested Negative 407 93 B-Tested Positive 108 160
Table 4 Confusion Matrix for Decision Tree
Table 2,3 and 4 Above the SVM, Naive Bayes and decision Tree are the all classification algorithms represent as different performance value that calculated on various measures. The various measures are analyzed in which Naive Bayes have showing the maximum accuracy. So the Naive Bayes machine learningclassifier can predict the chances of diabetes occurrence with more accuracy as compared to other classifiers like SVM and Decision Tree.
Table 5 Comparative Performance of Classification Algorithms on Various measures like Precision, Recall, F-Measure, Accuracy and ROC(Receiver Operating Curve).
[image:5.612.184.437.558.626.2]We can end of this session that the Naive Bayes classification algorithm outstanding performance of comparatively other algorithms. So, Naive Bayes algorithm is considered as the best supervised machine learning method of this calculation method because it gives high accuracy in related to other classification algorithms with an accuracy of Naive Bayes algorithm have 76.30% show in Table 5.
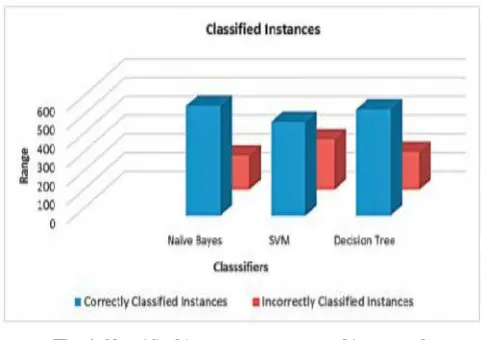
Table 6 Classifier’s performance of classification instance
Table 6 To determine the classifier performance of classified the instances. Purpose of these classified instances, in which calculated the accuracy and it will be analyzed. Performance of each algorithm based on evaluated by Correctly Classified Instances and Incorrectly Classified Instances short of a total number of instances.
Classification Algorithm
Precision Recall F- Measure Accuracy
%
ROC
Naive Bayes 0.759 0.763 0.760 76.30 0.819
SVM 0.424 0.651 0.513 65.10 0.500
Classification algorithm using calculated the correct and incorrect instance which performances of all classifier’s based on various measures are plotted through a graph show in Figure-2. Figure-3 represents ROC (Receiver Operating Curve) area of all classification algorithms.
[image:6.612.130.482.124.422.2]Fig 2 Classification Performance of Various Measures like Precision, Recall, F-Measure and Accuracy
Fig 4 Classified instance represented in a graph
Performance of Each and every algorithm is evaluated based on Correctly Classified Instances and Incorrectly Classified Instances short of a total number of instances. Figure.4 shows the graphical performance of all classification algorithms like SVM, Naive Bayes and Decision Tree on the basis of classified instances.
V. CONCLUSION
One of the most important in real world medical problem which is detection of diabetes in early stage.In this proposed system have used the deep learning of neural network concept for chosen the training dataset as 768 instance as a PIDD database and the various classification methods using to detect the diabetes Tested Positive and Negative. To predict the various measures on precision, recall, F-Measure, ROC and accuracy Classifier performance of various classification instances as Naive Bayes is the best algorithm for detecting the diabetes occurrence. Naive Bayes algorithm using achieved the accuracy of 76.30% to predict the diabetes.
REFERENCE
[1] V. Mitra, G. Sivaraman, H. Nam, C. Espy- Wilson, E. Saltzman, M. Tiede, Hybridconvolutional neural networks for articulatory and acoustic informationbased speech recognition, Speech Commun. 89 (2017) 103–112, http://dx.doi.org/10.1016/j.specom.2017.03.003.
[2] H. Mushcab, W.G. Kernohan, J. Wallace, R. Harper, S. Martin,Self-management of diabetes mellitus with remote monitoring: aretrospective review of 214 cases, Int. J. E- Health Med. Commun. (IJEHMC) 8(1) (2017) 52–61, http://dx.doi.org/10.4018/IJEHMC.2017010104
[3] U. Rashid, Ann based expert system to predict disease in cardiac patients atinitial stages, Int. J. E-Health Med. Commun. (IJEHMC) 6 (2) (2017)1055–1064, http://dx.doi.org/10.4018/IJEHMC.2015040101
[4] P. Suresh Kumar, S. Pranavi “Performance Analysis of Machine Learning Algorithms on Diabetes Dataset using Big Data Analytics” 2017 International Conference on Infocom Technologies and Unmanned Systems (ICTUS'2017),Dec. 18-20, 2017, ADET, Amity University Dubai, UAE
[5] Mário W.L. Moreiraa,b, Joel J.P.C. Rodriguesa,c,d,e,∗ NeerajKumarf, Jalal Al- Muhtadig,ValeriyKorotaev“Evolutionary radial basis function network for gestational diabetesdata analytics” Journal of Computational Science 27 (2018) 410–417
[6] NeelamshobhaNirala a,*, R. Periyasamy c, Bikesh Kumar Singh a, AwanishKumar”Detection of type-2 diabetes using characteristics of toe photoplethysmogram by applying support vector machine”biocybernetics and biomedicalengineering 39 (2019 ) 3 8 – 5 1
[7] PiyushSamant∗, RavinderAgarwal “Machine learning techniques for medical diagnosis of diabetes using iris images” Computer Methods and Programs in Biomedicine 157 (2018) 121–128
[8] Han Wu, Shengqi Yang *, Zhangqin Huang, Jian He, XiaoyiWang“Type 2 diabetes mellitus prediction model based on data mining” Informatics in Medicine Unlocked 10 (2018) 100–107.
[9] Sisodia, D., Shrivastava, S.K., Jain, R.C., 2010. ISVM for face recognition. Proceedings -2010 International Conference on Computational Intelligence and Communication Networks, CICN 2010 , 554–559doi:10.1109/CICN.2010.109.
[10] Sisodia, D., Singh, L., Sisodia, S., 2014. Fast and Accurate Face Recognition Using SVM and DCT, in: Proceedings of the Second International Conference on Soft Computing for Problem Solving (SocProS 2012), December 28-30, 2012, Springer. pp. 1027–1038.
[11] Ray, S., 2017. 6 Easy Steps to Learn Naïve Bayes Algorithm (with code in Python).