ISSN Online: 2169-2483 ISSN Print: 2169-2475
DOI: 10.4236/act.2019.82003 Jun. 20, 2019 24 Advances in Computed Tomography
Computed Tomography Using a Low Tube
Voltage Technique for Acute Ischemic Stroke
Kenji Nakamura
1*, Katsuhiko Maeda
1, Masao Tanooka
2, Shuhei Aoyama
1, Reiichi Ishikura
3,
Noriko Kotoura
11Department of Radiological Technology, Hyogo College of Medicine College Hospital, Nishinomiya, Japan 2Department of Radiotherapy, Takarazuka City Hospital, Takarazuka, Japan
3Department of Radiology, Hyogo College of Medicine, Nishinomiya, Japan
Abstract
Computed tomography (CT) is commonly used to assess for cerebral he-morrhage and acute ischemic stroke. We investigated the accuracy of CT us-ing a low tube voltage technique in acute ischemic stroke. We compared the standard deviation (SD), contrast between gray and white matter, and con-trast-to-noise ratio (CNR) between three groups (120 kV 500 mAs, 100 kV 850 mAs, and 100 kV 750 mAs using hybrid iterative reconstruction) in 50 patients without lesions, and visual evaluation using the normalized rank ap-proach was also performed. The mean value of SD was 4.02, 4.22, and 4.04, respectively, and the contrast between gray and white matter was 7.08, 8.66, and 8.68 HU, respectively; in addition, the CNR was 1.77, 2.06, and 2.15, re-spectively. The difference between the 100 kV and 120 kV groups was signifi-cant (p < 0.01). Visual evaluation showed a significant difference between the 100 and 120 kV groups (p < 0.05).
Keywords
Low Tube Voltage Technique, Computed Tomography, Acute Ischemic Stroke
1. Introduction
Computed tomography (CT) is useful in determining the treatment plan for pa-tients with acute stroke. According to the guidelines of the American Heart As-sociation/American Stroke Association (AHA/ASA), the information necessary to make decisions on emergency measures should be obtained using non-contrast enhanced CT in most cases [1]. CT is useful for excluding cerebral hemorrhage
How to cite this paper: Nakamura, K., Maeda, K., Tanooka, M., Aoyama, S., Ishi-kura, R. and Kotoura, N. (2019) Computed Tomography Using a Low Tube Voltage Technique for Acute Ischemic Stroke. Ad-vances in Computed Tomography, 8, 24-35. https://doi.org/10.4236/act.2019.82003
Received: March 9, 2019 Accepted: June 17, 2019 Published: June 20, 2019
Copyright © 2019 by author(s) and Scientific Research Publishing Inc. This work is licensed under the Creative Commons Attribution International License (CC BY 4.0).
DOI: 10.4236/act.2019.82003 25 Advances in Computed Tomography
and a diagnosis of acute ischemic stroke by identifying early ischemic changes (EIC).
The CT findings indicative of EIC include obscuration of the lentiform nuc-leus, loss of the insular ribbon, loss of gray-white matter differentiation, and ef-facement of the cortical sulci. To facilitate identification of these findings, the image should preferably have a high contrast between white matter and gray matter and low noise.
As a tool for increasing the agreement rate between readers, it has been rec-ommended that the Alberta Stroke Program Early CT Score (ASPECT) be used to evaluate for EICs in the middle cerebral artery region [2] [3]. The lower the ASPECT score, the higher the risk of cerebral hemorrhage after treatment with thrombolytic agents [4][5].
An evaluation method that combines diffusion-weighted imaging (DWI) us-ing magnetic resonance imagus-ing (MRI) and ASPECTS has been reported [6]. MRI alone may result in underestimation of EIC. If the EIC signal on CT is not elevated on DWI, this has been termed reversed discrepancy (RD) [7]. One study identified RD in 24% of 164 cases of hyperacute cerebral infarctions within 3 hours of onset and reported that many cases had atrial fibrillation [8].
Evaluation of the vascular occlusion site, collaterals, and penumbra using CT angiography (CTA) and CT perfusion (CTP) is now possible. The usefulness of these modalities in endovascular therapy has been widely reported [9]-[21]. However, while previous studies have reported the utility of low tube voltage imaging for acute ischemic stroke in contrast-enhanced CT [22][23][24], to our knowledge no study has evaluated the use of unenhanced CT using low tube voltage.
Therefore, we investigated the accuracy of unenhanced CT using the low tube voltage technique for acute ischemic stroke.
2. Materials and Methods
2.1. Patients and Imaging Protocol
This retrospective study was approved by the institutional ethics committee of Hyogo College of Medicine (approval number: 2501) and conducted in accor-dance with the ethical standards of the Declaration of Helsinki. All images used in the study had been acquired as part of routine clinical care during past medi-cal treatment. The purpose of the study and information regarding its imple-mentation were published on the home page of the web site of our institution, and patients were provided the opportunity to opt out.
DOI: 10.4236/act.2019.82003 26 Advances in Computed Tomography
including hemorrhage or acute infarction, by neuroradiologists, and their images were studied to quantitatively evaluate the diagnostic performance of the clinical image quality itself. These scan parameters were determined in fundamental physics experiments using a Catphan® 515 (The Phantom Laboratory, Salem
NY, USA) low-contrast detection module based on 120 kV and visual evalua-tions by neuroradiologists.
To estimate the CT radiation dose, the CT volume dose index (CTDIvol) and dose length product (DLP) were recorded. The effective dose (ED) for the brain was derived from the product of DLP and a previously reported conversion coef-ficient for the brain (k = 0.0021 mSv∙mGy−1∙cm−1) [25].
2.2. Image Analysis
[image:3.595.212.538.390.713.2]To evaluate image quality under the different protocols, 5 mm thick images from each reconstruction technique were downloaded from the PACS viewer (Syn-apse: Fuji Film Medical, Tokyo, Japan) to a workstation (Zio Station2: Ziosoft Inc., Tokyo, Japan). CT values and standard deviation (SD) were measured by setting the region of interest (ROI) as shown in Figure 1. The ROI was set at the putamen and posterior limb of the internal capsule on the axial sections through the basal ganglia to measure CT values of gray and white matter. An ROI with a
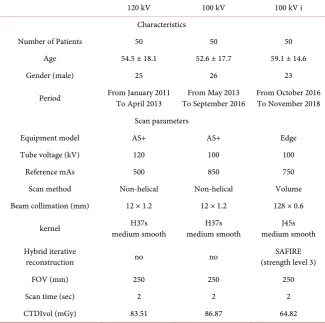
Table 1. Patient characteristics and scan parameters.
120 kV 100 kV 100 kV i
Characteristics
Number of Patients 50 50 50
Age 54.5 ± 18.1 52.6 ± 17.7 59.1 ± 14.6
Gender (male) 25 26 23
Period From January 2011 To April 2013 To September 2016 From May 2013 From October 2016 To November 2018
Scan parameters
Equipment model AS+ AS+ Edge
Tube voltage (kV) 120 100 100
Reference mAs 500 850 750
Scan method Non-helical Non-helical Volume Beam collimation (mm) 12 × 1.2 12 × 1.2 128 × 0.6
kernel medium smooth H37s medium smooth H37s medium smooth J45s
Hybrid iterative
reconstruction no no (strength level 3) SAFIRE
FOV (mm) 250 250 250
Scan time (sec) 2 2 2
CTDIvol (mGy) 83.51 86.87 64.82
DOI: 10.4236/act.2019.82003 27 Advances in Computed Tomography
Figure 1. The ROIs were set at the position shown and the SD was measured. ROIs were
set at the putamen and posterior limb of the internal capsule to measure the CT value. The diameters of the ROIs are 20 mm and 5 mm, respectively.
diameter of 20 mm was used to measure SD, and an ROI with a diameter of 5 mm was used to measure CT values of gray and white matter.
Image noise was defined as the mean SD of fifteen ROIs. The contrast-to-noise ratio (CNR) was calculated as follows [26]:
(
) (
)
CNR= CT valuegray matter−CT valuewhite matter image noise (1)
2.3. Statistical Analysis
Data are expressed as means ± standard errors of means. Multigroup compari-sons were carried out using one-way analysis of variance followed by Tu-key-Kramer multiple comparisons test, and p < 0.01 was considered statistically significant.
For visual evaluation, five radiological technologists with between 5 and 35 years of experience (mean: 14 years) evaluated the image quality of the brain CT, including image contrast, image noise, and image sharpness. The results ob-tained were transformed into normalized scores and analyzed using the least significant difference (LSD) method (significance level 5%) using a normalized rank approach [27]. The five radiological technologists were blinded to the ac-quisition parameters but were allowed to adjust the window level and width us-ing 2 megapixel color liquid-crystal display monitors (Eizo Nanao Corporation, Ishikawa, Japan).
3. Result
DOI: 10.4236/act.2019.82003 28 Advances in Computed Tomography
Figure 2. Comparison of the mean SD of the skull base, basal ganglia, and vertex between
[image:5.595.233.514.294.417.2]each imaging protocol. The SD was significantly higher only in the 100 kV group.
Figure 3. The mean CT value of gray and white matter for each imaging protocol. Note
that the CT value of the 100 kV group was significantly higher than that of the 120 kV group. The rate of increase in CT value when lowering the tube voltage was larger for gray matter than for white matter.
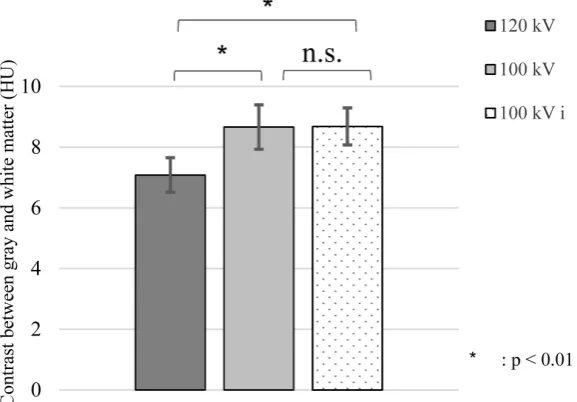
Figure 4. Contrast between gray and white matter. A significant difference was observed
[image:5.595.231.520.489.690.2]DOI: 10.4236/act.2019.82003 29 Advances in Computed Tomography
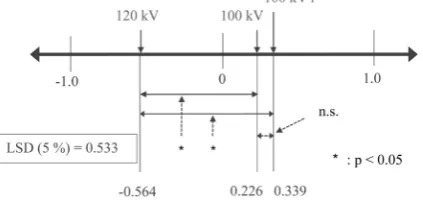
[image:6.595.241.505.220.390.2]difference was observed between the 100 kV and 120 kV groups (p < 0.01). The CNR calculated from the contrast between gray and white matter and the mean SD is shown in Figure 5. A significant difference was observed between the 100 kV and 120 kV groups (p < 0.01). The combined use of SAFIRE and a low tube voltage allowed reduction of the exposure dose. The result of visual evaluation using the normalized ranking method is shown in Figure 6. The LSD was 0.533. In the case that the distance between the two groups was > 0.533, there was a significant difference. Therefore, a significant difference was observed between the 100 kV group and 120 kV group (p < 0.05).
Figure 5. CNR calculated from the contrast between gray and white matter and average
of SD. A significant difference was observed between the 100 kV and 120 kV groups.
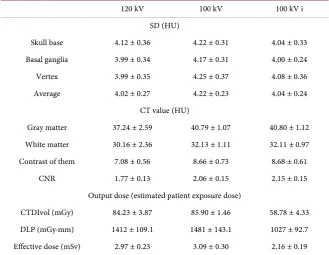
Table 2. Summary of quantitative evaluation.
120 kV 100 kV 100 kV i
SD (HU)
Skull base 4.12 ± 0.36 4.22 ± 0.31 4.04 ± 0.33 Basal ganglia 3.99 ± 0.34 4.17 ± 0.31 4.00 ± 0.24 Vertex 3.99 ± 0.35 4.25 ± 0.37 4.08 ± 0.36 Average 4.02 ± 0.27 4.22 ± 0.23 4.04 ± 0.24
CT value (HU)
Gray matter 37.24 ± 2.59 40.79 ± 1.07 40.80 ± 1.12 White matter 30.16 ± 2.36 32.13 ± 1.11 32.11 ± 0.97 Contrast of them 7.08 ± 0.56 8.66 ± 0.73 8.68 ± 0.61 CNR 1.77 ± 0.13 2.06 ± 0.15 2.15 ± 0.15
Output dose (estimated patient exposure dose)
CTDIvol (mGy) 84.23 ± 3.87 85.90 ± 1.46 58.78 ± 4.33 DLP (mGy∙mm) 1412 ± 109.1 1481 ± 143.1 1027 ± 92.7 Effective dose (mSv) 2.97 ± 0.23 3.09 ± 0.30 2.16 ± 0.19
[image:6.595.209.539.454.709.2]DOI: 10.4236/act.2019.82003 30 Advances in Computed Tomography
Figure 6. Results of visual evaluation using the normalized ranking method. A significant
difference was observed between the 100 kV and 120 kV groups.
4. Discussions
Acute ischemic stroke requires urgent assessment of the clinical and radiological features of the brain insult. The ability to exclude hemorrhage and assess the volume of any ischemic tissue to guide therapy allows the proper treatment of acute stroke [28]. A soft-copy review with a variable window width and center level settings was performed in order to improve the detection of parenchymal hypoattenuation of ischemic stroke. Reviewing plain CT images with a narrow window width on a monitor for accentuating the contrast of gray-white matter leads to increased sensitivity for detecting EIC [29]. However, this operation in-creases image noise. Therefore, if the original image does not improve the con-trast between gray and white matter while maintaining image noise, it cannot be said to be useful in cases of acute ischemic stroke.
As a technique to achieve this goal, we focused on low tube voltage. We found that the image noise at 100 kV increased significantly compared to that at 120 kV; however, the contrast between gray and white matter and CNR calculated at these levels was significantly improved, because the rate of increase in CT value when lowering the tube voltage was larger for gray matter than for white matter. We initially attempted to understand this characteristic using a commercially available phantom, but no phantom separates gray matter and white matter. Development and analysis results of a phantom expressing early ischemic change by changing the density of the substance have been reported [30], but the influence of differences in atomic number on CT value was not considered. Moreover, in Report 44 of the ICRU, the mass attenuation coefficients of gray matter and white matter were equal [31].
DOI: 10.4236/act.2019.82003 31 Advances in Computed Tomography
Figure 7. Approximate curve of the CT values of muscle and muscles with varying
adi-pose content at each energy level from a simulation using known linear attenuation coef-ficient data. As the tube voltage decreased, the larger the adipose content, the larger the CT value difference for the muscle was shown.
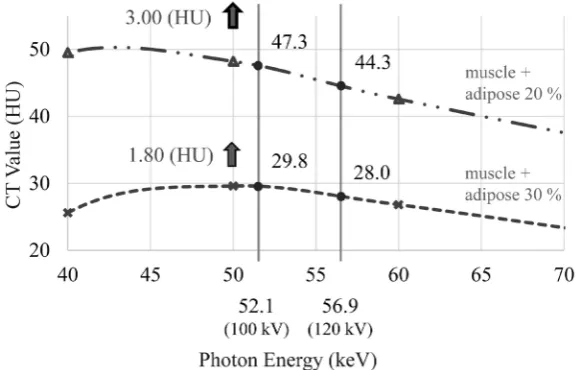
Figure 8. This Figure showing Figure 7 limited to the region of interest. The result was
obtained by simulating the approximate curve of the CT values of (muscle + 20% adi-pose) and (muscle + 30% adiadi-pose) for each energy. CT values at effective energies of 120 kV and 100 kV are also shown. Assuming gray matter is equivalent to muscle + 20% adi-pose and white matter is equivalent to muscle + 30% adiadi-pose, the changes in CT values due to low tube voltage correlated well with results obtained from image analysis.
Assuming gray matter as (muscle + 20% adipose) and white matter as (muscle + 30% adipose), the changes in CT values due to low tube voltage correlated well with the results obtained from image analysis.
[image:8.595.228.518.310.495.2]vol-DOI: 10.4236/act.2019.82003 32 Advances in Computed Tomography
tage was smaller than that for gray matter.
This study has several limitations. All imaging data were obtained with a sin-gle CT device. Even at the same tube voltage, differences among equipment manufacturers mean that the energy spectrum differs; therefore, devices with lower effective energy may show results discrepant with our results due to the greater influence of beam hardening.
Moreover, since hybrid iterative reconstruction (HIR) is a nonlinear image processing method, a previous study recommended that image noise should be evaluated using the noise-power spectrum (NPS) instead of SD [34]; however, calculating CNR using NPS did not change the finding of a significant difference in this study. Furthermore, a setting of 100 kV using SAFIRE could reduce im-age noise while maintaining improved contrast between gray and white matter, and its estimated patient exposure dose was lower than that of other methods. However, the HIR algorithm could not improve low-contrast detectability over that achieved with filtered back projection at the same radiation doses [34]; therefore, we considered that a sufficient dose (i.e. SD of the brain parenchyma is 4 or less at a slice thickness of 5 mm, with reference to GALACTIC by the Japanese Society of Radio-logical Technology) was necessary to evaluate EIC to the same extent.
5. Conclusion
CT with an adequate exposure dose using a low tube voltage technique can ef-fectively utilize the difference in adipose content between gray and white matter to improve image quality required in cases of acute ischemic stroke with or without SAFIRE.
Acknowledgements
We thank Libby Cone, MD, MA, from DMC Corp. (http://dmed.co.jp/) for editing a draft of this manuscript.
Research Involving Human Participants and/or Animals
All procedures in studies involving human participants were performed in ac-cordance with the ethical standards of Hyogo College of Medicine, and with the 1964 Helsinki Declaration and its later amendments or comparable ethical stan-dards. This article does not contain any studies with animals performed by any of the authors.
Informed Consent
The purpose of the research and information on its implementation were pub-lished on the home page of the web site of our institution, and patients were provided the opportunity to opt out.
Presentation at Conferences
DOI: 10.4236/act.2019.82003 33 Advances in Computed Tomography
Technologists, in Hakodate, Japan, on 22-24 September, 2017.
Conflicts of Interest
The authors declare no conflicts of interest regarding the publication of this pa-per.
References
[1] Powers, W.J., Derdeyn, C.P., Biller, J., et al. (2015) AHA/ASA Focused Update of the 2013 Guidelines for the Early Management of Patients with Acute Ischemic Stroke Regarding Endovascular Treatment: A Guideline for Healthcare Profession-als from the American Heart Association/American Stroke Association. Stroke, 46, 3020-3035.https://doi.org/10.1161/STROKEAHA.115.010716
[2] Barber, P.A., Demchuk, A.M., Zhang, J., et al. (2000) Validity and Reliability of a Quantitative Computed Tomography Score in Predicting Outcome of Hyperacute Stroke before Thrombolytic Therapy. ASPECTS Study Group. The Lancet, 355, 1670-1674.https://doi.org/10.1016/S0140-6736(00)02237-6
[3] Pexman, J.H., Barber, P.A., Hill, M.D., et al. (2001) Use of the Alberta Stroke Pro-gram Early CT Score (ASPECTS) for Assessing CT Scans in Patients with Acute Stroke. American Journal of Neuroradiology, 22, 1534-1542.
[4] Dzailowski, I., Hill, M.D., Coutts, S.B., et al. (2006) Extend of Early Ischemic Changes on Computed Tomography (CT) before Thrombolysis: Prognostic Value of the Alberta Stroke Program Early CT Score in ECASS II. Stroke, 37, 973-978.
https://doi.org/10.1161/01.STR.0000206215.62441.56
[5] Hirano, T., Sasaki, M., Tomura, N., et al. (2012) Japan Alteplase Clinical Trial Group: Low Alberta Stroke Program Early Computed Tomography Score within 3 Hours of Onset Predicts Subsequent Symptomatic Intracranial Hemorrhage in Pa-tients Treated with 0.6 mg/kg Alteplase. Journal of Stroke and Cerebrovascular Diseases, 21, 898-902.https://doi.org/10.1016/j.jstrokecerebrovasdis.2011.05.018
[6] Nezu, T., Koga, M., Nakagawara, J., et al. (2011) Early Ischemic Change on CT Versus Diffusion-Weighted Imaging for Patients with Stroke Receiving Intravenous Recombinant Tissue-Type Plasminogen Activator Therapy: Stroke Acute Manage-ment with Urgent Risk-Factor AssessManage-ment and ImproveManage-ment (SAMURAI) rt-PA Registry. Stroke, 42, 2196-2200.https://doi.org/10.1161/STROKEAHA.111.614404
[7] Kim, E.Y., Ryoo, J.W., Roh, H.G., et al. (2006) Reversed Discrepancy between CT and Diffusion-Weighted MR Imaging in Acute Ischemic Stroke. American Journal of Neuroradiology, 27, 1990-1995.
[8] Kawano, H., Hirano, T., Nakajima, M., et al. (2013) Diffusion-Weighted Magnetic Resonance Imaging May Underestimate Acute Ischemic Lesions: Cautions on Neg-lecting a Computed Tomography-Diffusion-Weighted Imaging Discrepancy. Stroke, 44, 1056-1061.https://doi.org/10.1161/STROKEAHA.111.000254
[9] Puetz, V., Dzialowski, I., Hill, M.D., et al. (2008) Calgary CTA Study Group: Intra-cranial Thrombus Extent Predicts Clinical Outcome, Final Infarct Size and He-morrhagic Transformation in Ischemic Stroke: The Clot Burden Score. Internation-al JournInternation-al of Stroke, 3, 230-236.https://doi.org/10.1111/j.1747-4949.2008.00221.x
[10] Sillanpää, N., Saarinen, J.T., Rusanen, H., et al. (2012) Location of the Clot and Outcome of Perfusion Defects in Acute Anterior Circulation Stroke Treated with Intravenous Thrombolysis. American Journal of Neuroradiology, 34, 100-106.
DOI: 10.4236/act.2019.82003 34 Advances in Computed Tomography
[11] Tan, I.Y., Demchuk, A.M., Hopyan, J., et al. (2009) CT Angiography Clot Burden Score and Collateral Score: Correlation with Clinical and Radiologic Outcomes in Acute Middle Cerebral Artery Infarct. American Journal of Neuroradiology, 30, 525-531.https://doi.org/10.3174/ajnr.A1408
[12] Thierfelder, K.M., Sommer, W.H., Ertl-Wagner, B., et al. (2016) Prediction of Stent-Retriever Thrombectomy Outcomes by Dynamic Multidetector CT Angio-graphy in Patients with Acute Carotid T or MCA Occlusions. American Journal of Neuroradiology, 37, 1296-1302.https://doi.org/10.3174/ajnr.A4694
[13] Menon, B.K., Qazi, E., Nambiar, V., et al. (2015) IMS Investigators: Differential Ef-fect of Baseline CTA Collaterals on Clinical Outcome in Patients Enrolled in the IMS-III Trial. Stroke, 46, 1239-1244.
https://doi.org/10.1161/STROKEAHA.115.009009
[14] Nambiar, V., Sohn, S.I., Almekhlafi, M.A., et al. (2014) CTA Collateral Status and Response to Recanalization in Patients with Acute Ischemic Stroke. American Journal of Neuroradiology, 35, 884-890.https://doi.org/10.3174/ajnr.A3817
[15] Souza, L.C., Yoo, A.J., Chaudhry, Z.A., et al. (2012) Malignant CTA Collateral Pro-file Is Highly Specific for Large Admission DWI Infarct Core and Poor Outcome in Acute Stroke. American Journal of Neuroradiology, 33, 1331-1336.
https://doi.org/10.3174/ajnr.A2985
[16] Menon, B.K., d’Esterre, C.D., Qazi, E.M., et al. (2015) Multiphase CT Angiography: A New Tool for the Imaging Triage of Patients with Acute Ischemic Stroke. Radiol-ogy, 275, 510-520.https://doi.org/10.1148/radiol.15142256
[17] Yan den Wijngaard, I.R., Holswilder, G., Wermer, M.J., et al. (2016) Assessment of Collateral Status by Dynamic CT Angiography in Acute MCA Stroke: Timing of Acquisition and Relationship with Final Infarct Volume. American Journal of Neu-roradiology, 37, 1231-1236.https://doi.org/10.3174/ajnr.A4746
[18] Lin, L., Bivard, A., Krishnamurthy, V., et al. (2016) Whole-Brain CT Perfusion to Quantify Acute Ischemic Penumbra and Core. Radiology, 279, 876-887.
https://doi.org/10.1148/radiol.2015150319
[19] Lansberg, M.G., Christensen, S., Kemp, S., et al. (2017) CT Perfusion to Predict Re-sponse to Recanalization in Ischemic Stroke Project (CRISP) Investigators: Com-puted Tomographic Perfusion to Predict Response to Recanalization in Ischemic Stroke. Annals of Neurology, 81, 849-856.https://doi.org/10.1002/ana.24953
[20] Campbell, B.C., Christensen, S., Levi, C.R., et al. (2011) Cerebral Blood Flow Is the Optimal CT Perfusion Parameter for Assessing Infarct Core. Stroke, 42, 3435-3440.
https://doi.org/10.1161/STROKEAHA.111.618355
[21] Inoue, M., Mlynash, M., Straka, M., et al. (2012) Patients with the Malignant Profile within 3 Hours of Symptom Onset Have Very Poor Outcomes after Intravenous Tissue-Type Plasminogen Activator Therapy. Stroke, 43, 2494-2496.
https://doi.org/10.1161/STROKEAHA.112.653329
[22] Waaijer, A., Prokop, M., Velthuis, B.K., Bakker, C.J.G., et al. (2007) Circle of Willis at CT Angiography: Dose Reduction and Image Quality-Reducing Tube Voltage and Increasing Tube Current Settings. Radiology, 242, 832-839.
https://doi.org/10.1148/radiol.2423051191
[23] Luo, S., Zhang, L.J., Meinel, F.G., et al. (2014) Low Tube Voltage and Low Contrast Material Volume Cerebral CT Angiography. European Radiology, 24, 1677-1685.
https://doi.org/10.1007/s00330-014-3184-z
DOI: 10.4236/act.2019.82003 35 Advances in Computed Tomography
Contrast Material: A Quantitative and Qualitative Comparison with Conventional Computed Tomography Angiography. Investigative Radiology, 47, 142-147.
https://doi.org/10.1097/RLI.0b013e31823076a4
[25] Huda, W., Ogden, K.M., Khorasani, M.R., et al. (2008) Converting Dose Length Product to Effective Dose at CT. Radiology, 248, 995-1003.
https://doi.org/10.1148/radiol.2483071964
[26] Gupta, A.K., Nelson, R.C., Johnson, G.A., et al. (2003) Optimization of Eight-Element Multi-Detecter Row Helical CT Technology for Evaluation of the Abdomen. Radi-ology, 227, 739-745.https://doi.org/10.1148/radiol.2273020591
[27] Nakamae, M. (2000) Study of the Reliability of Visual Evaluation by the Ranking Method Analysis of Ordinal Scale and Psychological Scaling Using the Normalized Rank Approach. Japanese Journal of Radiological Technology, 56, 725-730.
https://doi.org/10.6009/jjrt.KJ00001356925
[28] von Kummer, R., Bourquain, H., Bastianello, S., Bozzao, L., Manelfe, C., Meier, D. and Hacke, W. (2001) Early Prediction of Irreversible Brain Damage after Ischemic Stroke at CT. Radiology, 219, 95-100.
https://doi.org/10.1148/radiology.219.1.r01ap0695
[29] Lev, M.H., Farkas, J., Gemmete, J.J., Hossain, S.T., Hunter, G.J., Koroshetz, W.J., et al. (1999) Acute Stroke: Improved Nonenhanced CT Detection-Benefits of Soft-Copy Interpretation by Using Variable Window Width and Center Level Set-tings. Radiology, 213, 150-155.https://doi.org/10.1148/radiology.213.1.r99oc10150
[30] Nishimura, K., Tanaka, C., Fukao, M., et al. (2016) The Detectability of Iterative CT Reconstruction for Low-Contrast Lesions in Hyperacute Cerebral Infarction: As-sessment with Newly Developed Dedicated Head Phantoms. Japanese Journal of Radiological Technology, 72, 157-164.
https://doi.org/10.6009/jjrt.2016_JSRT_72.2.157
[31] Goldstone, K.E. (1990) Tissue Substitutes in Radiation Dosimetry and Measure-ment. ICRU Report 44, International Commission on Radiation Units and Mea-surements, 41.
[32] Shirotani, T. (1995) Attenuation Coefficients of Human Tissues and Tissue Substi-tutes. Japan Atomic Energy Research Institute, Ibaraki, 95-002.
[33] Hubbell, J.H., et al. (1969) Photon Cross Sections, Attenuation Coefficients and Energy Absorption Coefficients from 10 keV to 100 GeV. Natl. Stand. Ref. Data, 29.
https://doi.org/10.6028/NBS.NSRDS.29