Original Article
Pathomorphological changes of bone marrow
adipocytes in process of steroid-associated
osteonecrosis
Hui Sheng1*, Chun-Jun Sheng1*, Xiao-Yun Cheng1, Ge Zhang2, Kwong-Man Lee2, Kwok-Sui Leung2, Shen Qu1, Ling Qin2
1Department of Endocrinology and Metabolism, Shanghai Tenth People’s Hospital, Tongji University School of
Medicine, Shanghai 200072, China; 2Department of Orthopedics and Traumatology, The Chinese University of
Hong Kong, Hong Kong SAR, China. *Equal contributors to this work.
Received March 20, 2013; Accepted April 28, 2013; Epub May 15, 2013; Published June 1, 2013
Abstract: Objective: The role of extravascular fat deposition in pathogenesis of steroid-associated osteonecrosis (ON) still remains unclear. This study aimed to explore the pathomorphological changes of bone marrow adipocytes over time in a rabbit ON model. Methods: Thirty-two adult rabbits were divided into control group (n=16) and steroid group (n=16). Rabbits in the steroid group were injected with venous lipopolysaccharide once and intramuscular methylprednisolone trice to induce ON. Rabbits in the control group were treated with normal saline of equal volume. 2 weeks (early stage; n=8) and 4 weeks (late stage; n=8) after the last steroid injection, animals were sacrificed, and bilateral femora were harvested. The density, diameter and area of bone marrow adipocytes were determined by histomorphometry, and ON was evaluated histopathologically. Results: The adipocyte density in steroid group increased by 67.1% and 54.4% at week 2 and week 4, respectively, when compared with control group, but there was no significant difference between week 2 and week 4. The adipocyte diameter in the steroid group at week 4 was significantly larger than that in the control group, but the adipocyte diameter in the steroid group at week 2 was slightly smaller than that in the control group. The adipocyte area in the steroid group increased by 44% and 83.4% at week 2 and week 4, respectively, when compared with the control group, and the adipocyte area in the steroid group at week 4 was markedly larger than that at week 2. In the control group, there were a largest number of adipocytes with 40-50 μm in diameter. When compared with the control group, most of increased adipocytes in the steroid group at week 2 were 30-40 μm in diameter, and those at week 4 were 50-60 μm in diameter. In the steroid group, histopathological examination showed ON was found in 25% (2/8) of rabbits at week 2 and 87.5% (7/8) of rabbits at week 4. Conclusion: In the process of ON, extravascular fat deposition is characterized by increased small adipocytes at the early stage and hypertrophy of adipocytes at the late stage.
Keywords: Steroid-associated osteonecrosis, adipocyte, adipogenesis, fat transport
Introduction
Glucocorticoids have been widely applied in clinical treatment of inflammation and autoim-mune diseases, but glucocorticoid treatment brings a severe complication: osteonecrosis (ON). Recently, many study showed high inci-dence of ON and high collapse rate in patients recovering from SARS after receiving glucocor-ticoid treatment, which makes steroid associ-ated ON becoming a hot topic [1, 2]. There are several theories for steroid associated ON, such as theory of vascular compression due to
rab-bits according to previously described (this has a high inci-dence of ON) [7], and histomor-phometry and classic methods were employed to evaluate ON. This study aimed to investigate the dynamic change in bone marrow adipocytes in steroid associated ON. Our results may provide evidence on the relation-ship between extravascular fat deposition and steroid associat-ed ON.
Materials and methods
Animal model and grouping
A total of 32 rabbits aged 28-32 weeks were randomly assigned into control group (n=16) and steroid group (n=16). The steroid associated ON was introduced with methods developed in our department [7]. In brief, rabbits in the steroid group were intrave-nously injected with endotoxin (LPS; 10 μg/kg, Escherichia coli 0111:B4, Sigma-Aldrich) once and intramuscularly with methyl-prednisolone (20 mg/kg, Phar- macia and Upjohn, USA) thrice with an interval of 24 h. Animals in the control group were treated with normal saline of equal vol-ume. Rabbits were housed in a standard environment and given ad libitum access to food and water without activity restriction. 2 weeks (early stage) and 4 weeks (late stage) after last ste-roid injection, animals were sac-rificed (n=8 at each time point), and bilateral femora were col-lected for examination.
Sample collection and treat-ment
[image:2.612.88.371.71.231.2]After anesthesia, animals were sacrificed using an overdose of sodium pentobarbital, and bilat-eral femora were collected and fixed in 10% formalin for 72 h and then in 75% ethanol for 1 Figure 1. Density of adipocytes in bone marrow. The adipocytes in bone
[image:2.612.90.371.286.444.2]marrow increased in steroid group. *P<0.01 vs control group.
Figure 2. Mean diameter of adipocytes in bone marrow. The diameter of adipocytes significantly reduced at early stage (P<0.05) but markedly in-creased at late stage (P<0.01). *P<0.05, **p<0.01 vs control group.
[image:2.612.89.372.511.669.2]week. Decalcification was done in 9% formic acid for 4 weeks followed by dehydration in a series of ethanol solution and subsequent embedding in paraffin. The proximal 1/3 of femora was cut into 4-μm sections followed by mounting with resin and H&E staining.
Histomorphometry of adipocytes in bone mar-row
Four fields were randomly selected from each section at 100 magnification and two sections were collected from each femur. A total of 16 fields were selected from 4 sections of each rabbit followed by quantification of adipocytes in bone marrow. The density, diameter and area of adipocytes in bone marrow were determined and analyzed with Image-Pro Plus 5.1. Adipocyte density refers to number of adipo-cytes in unit bone marrow area (excluding bone trabecula); adipocyte diameter refers to mean diameter of adipocytes in bone marrow; cyte area refers to area of bone marrow adipo-cytes in unit bone marrow area (excluding bone trabecula) [9].
Histopathological examination of ON
ON was defined as formation of empty lacunae or karyopyknosis of a large number of necrotic osteocytes in bone trabecula, accompanied necrosis of surrounding fat tissues [9]. Once one femur developed ON, positivity for ON was confirmed.
Statistical analysis
Statistical analysis was done with SPSS version 13.0 for Windows (SPSS Inc., Chicago, IL, USA). Density, diameter and area of adipocytes were compared with analysis of variance between two groups. Data were expressed as mean ± standard deviation (|±SD). A value of P<0.05 was considered statistically significant.
Results
Density of adipocytes in bone marrow
In the control group, the density of adipocytes in bone marrow was 149±15/mm2. In the ste-roid group, the density of adipocytes in bone marrow was 249±25/mm2 at week 2 and 230±23/mm2 at week 4, which were increased by 67.1% and 54.4%, respectively, when
com-pared with the control group (P<0.01). However, the density of adipocytes in bone marrow was comparable between week 2 and week 4 (P>0.05) (Figure 1).
Diameter of adipocytes in bone marrow
The mean diameter of adipocytes in bone mar-row was 42.6±3.6 μm in control group, 38.2±3.1 μm in steroid group at week 2 and 52.9±4.1 μm in steroid group at week 4. Significant difference in the mean diameter of adipocytes was noted between the control group and the steroid group at different time points (Figure 2).
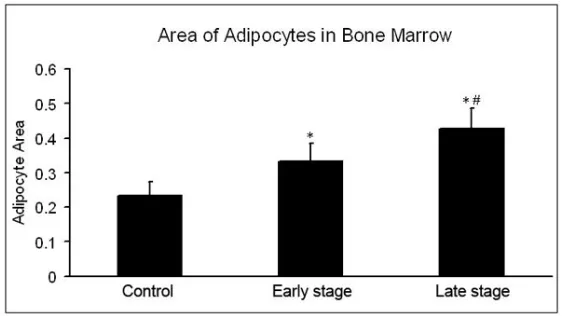
Area of adipocytes in bone marrow
The area of adipocytes in bone marrow was 23.2±3.9% in the control group. In the steroid group, the area of adipocytes in bone marrow was 33.4±4.7% at week 2 and 42.6±5.3% at week 4, which were increased by 44% and 83.6%, respectively, when compared with the control group (P<0.01) (Figure 3).
Proportion of adipocytes with different sizes in bone marrow
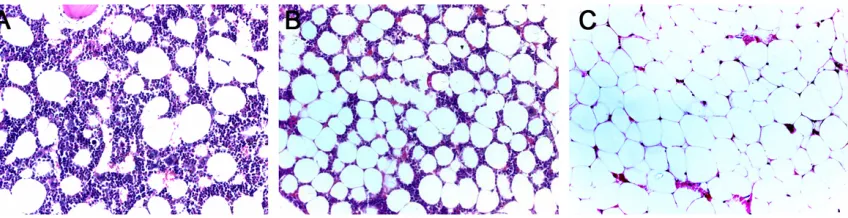
In the control group, the majority of adipocytes in bone marrow had a diameter of 40-50 μm. In the steroid group, the majority of adipocytes in bone marrow were 30-40 μm at week 2 and 50-60 μm at week 4 (Figures 4 and 5).
Incidence of ON
At the early stage (week 2), ON was found in 2 out of 8 rabbits (25%), and the incidence of ON was 87.5% (7/8) at the late stage (week 4). In the control group, ON was not observed.
Discussion
In the present study, the area, density and diameter of adipocytes in bone marrow at week 2 (early stage) were significantly larger than those in control group. This suggests that extra-vascular fat deposition at the early stage of ON is attributed to the increase in the number of adipocytes. In addition, at late stage (week 4), the area of adipocytes in bone marrow was markedly larger than that in the control group and the steroid group at week 2. With the increased incidence of ON at week 4, the mean diameter of adipocytes in bone marrow in ste-roid group was also significantly larger than that in the control group. Of note, the number of large adipocytes in the steroid group at week 4 was larger than that in the control group. Although the density of adipocytes at week 4
was higher than that in the control group, but comparable to that at week 2 in the steroid group. This indicates that the extravascular fat deposition at the late stage is attributed to the enlargement (hypertrophy) of adipocytes and at the early stage is attributed to the increase in the number of adipocyte.
[image:4.612.95.521.76.275.2]In vivo study showed glucocorticoid could pro-mote the differentiation of bone marrow derived mesenchymal stem cells (BMSCs) into adipo-cytes [10]. Recently, our group also found that BMSCs from rabbits with steroid associated ON had increased potential to differentiate into adipocytes following differentiation induction [11]. This implies that the small adipocytes which increase at early stage after steroid treat-Figure 4. Number of adipocytes with different sizes in bone marrow. The majority of adipocytes had small diameter at the early stage and had large diameter at the late stage.
[image:4.612.97.521.326.435.2]ment are attributed to the differentiation of BMSCs in the presence of glucocorticoids. The increased diameter of adipocytes in live ani-mals with ON can be explained by disturbance of fat transport [12, 13]. This indicates that the increase in large adipocytes at late stage of steroid treatment may be, at least partially, associated with compromised fat transport in adipocytes. Thus, our findings provide an inter-ventional strategy for ON: to block the signaling pathway involving in glucocorticoid induced adi-pogenesis at early stage and to promote fat transport in adipocytes may be feasible in pre-vention of ON.
Acknowledgement
This study was supported by National Natural Science Foundation of China (30900698) and Doctoral Fund of the Ministry of Education (20090072120020).
Address correspondence to: Dr. Hui Sheng, Department of Endocrinology and Metabolism, Shanghai Tenth People’s Hospital, Tongji University School of Medicine, Shanghai 200072, China. E-mail: [email protected]; Dr. Ling Qin, Department of Orthopedics and Traumatology, The Chinese University of Hong Kong, Hong Kong SAR, China. E-mail: [email protected]
References
[1] Li ZR, Sun W, Qu H, Zhou YX, Dou BX, Shi ZC, Zhang NF, Cheng XG, Wang DL and Guo WS. [Clinical research of correlation between os-teonecrosis and steroid]. Zhonghua Wai Ke Za Zhi 2005; 43: 1048-1053.
[2] Zhao FC, Guo KJ and Li ZR. Osteonecrosis of the femoral head in SARS patients: seven years later. Eur J Orthop Surg Traumatol 2012; [Epub ahead of print].
[3] Assouline-Dayan Y, Chang C, Greenspan A, Shoenfeld Y and Gershwin ME. Pathogenesis and natural history of osteonecrosis. Semin Ar-thritis Rheum 2002; 32: 94-124.
[4] Tan G, Kang PD and Pei FX. Glucocorticoids af-fect the metabolism of bone marrow stromal cells and lead to osteonecrosis of the femoral head: a review. Chin Med J (Engl) 2012; 125: 134-139.
[5] Zhang G, Wang XL, Sheng H, Xie XH, He YX, Yao XS, Li ZR, Lee KM, He W, Leung KS and Qin L.
Constitutional flavonoids derived from Epime-dium dose-dependently reduce incidence of steroid-associated osteonecrosis not via direct action by themselves on potential cellular tar-gets. PLoS One 2009; 4: e6419.
[6] Motomura G, Yamamoto T, Miyanishi K, Ya-mashita A, Sueishi K and Iwamoto Y. Bone marrow fat-cell enlargement in early steroid-induced osteonecrosis--a histomorphometric study of autopsy cases. Pathol Res Pract 2005; 200: 807-811.
[7] Qin L, Zhang G, Sheng H, Yeung KW, Yeung HY, Chan CW, Cheung WH, Griffith J, Chiu KH and Leung KS. Multiple bioimaging modalities in evaluation of an experimental osteonecrosis induced by a combination of lipopolysaccha-ride and methylprednisolone. Bone 2006; 39: 863-871.
[8] Miyanishi K, Yamamoto T, Irisa T, Yamashita A, Jingushi S, Noguchi Y and Iwamoto Y. Bone marrow fat cell enlargement and a rise in in-traosseous pressure in steroid-treated rabbits with osteonecrosis. Bone 2002; 30: 185-190. [9] Zhang G, Qin L, Sheng H, Wang XL, Wang YX,
Yeung DK, Griffith JF, Yao XS, Xie XH, Li ZR, Lee KM and Leung KS. A novel semisynthesized small molecule icaritin reduces incidence of steroid-associated osteonecrosis with inhibi-tion of both thrombosis and lipid-deposiinhibi-tion in a dose-dependent manner. Bone 2009; 44: 345-356.
[10] Cui Q, Wang GJ and Balian G. Pluripotential marrow cells produce adipocytes when trans-planted into steroid-treated mice. Connect Tis-sue Res 2000; 41: 45-56.
[11] Sheng HH, Zhang GG, Cheung WH, Chan CW, Wang YX, Lee KM, Wang HF, Leung KS and Qin LL. Elevated adipogenesis of marrow mesen-chymal stem cells during early steroid-associ-ated osteonecrosis development. J Orthop Surg Res 2007; 2: 15.
[12] Rodriguez A, Catalan V, Gomez-Ambrosi J and Fruhbeck G. Role of aquaporin-7 in the patho-physiological control of fat accumulation in mice. FEBS Lett 2006; 580: 4771-4776. [13] Zhang G, Qin L, Sheng H, Yeung KW, Yeung HY,