Original Article
COMT Val158Met polymorphism is associated with
blood pressure and lipid levels in general families
of Bama longevous area in China
Lin Ge1*, Hua-Yu Wu2*, Shang-Ling Pan1, Ling Huang1, Peng Sun1, Qing-Hua Liang3, Guo-Fang Pang3, Ze-Ping Lv3, Cai-You Hu3, Cheng-Wu Liu1, Xiao-Ling Zhou1, Ling-Jin Huang1, Rui-Xing Yin4, Jun-Hua Peng1
1Department of Pathophysiology, Guangxi Medical University, Nanning, Guangxi, China; 2Department of Cell
Biology & Genetics, Guangxi Medical University, Nanning , Guangxi, China; 3Department of Neurology, Jiangbin
Hospital of Guangxi Zhuang Autonomous Region, Nanning, Guangxi, China; 4Department of Cardiology, The First
Affiliated Hospital of Guangxi Medical University, Nanning, Guangxi, China. *Equal contributors.
Received September 21, 2015; Accepted October 25, 2015; Epub November 1, 2015; Published November 15, 2015
Abstract: To see the possible relationship between COMT Val158Met polymorphism and blood pressure (BP) and se-rum lipid levels and its putative role in human longevity, we genotyped COMT Val158Met (rs4680) by PCR-RFLP for members from Bama long-lived families (BLF, n = 1538), Bama non-long-lived families (BNLF, n = 600), Pingguo (a county outside Bama region) long-lived families (PLF, n = 538) and Pingguo non-long-lived families (PNLF, n = 403) after anthropometric measures were collected and serum lipid levels were detected. The distribution of genotypes
and alleles among four family groups was significantly different (all P < 0.01), with GA/AA genotype and minor allele A presenting more frequently in Bama population than Pingguo Population (P < 0.01). The systolic blood pressure (SBP), pulse pressure (PP), total cholesterol (TC), triglyceride (TG) and low density lipoprotein-cholesterol (LDL-C) levels of GG genotype carriers were dramatically higher than non-GG carriers in BNLF (P < 0.05); the SBP and PP levels of GG carriers were lower (P < 0.05) while TC, LDL-C level were higher (P < 0.01) than that of non-GG carriers in PLF; no difference in blood pressure and lipids were observed between genotypes in BLF and PNLF (P > 0.05). Correlation analyses revealed that COMT Val158Met was mainly correlated negatively with SBP, diastolic blood pressure (DBP) and LDL-C in BNLF and negatively with TC level in BLF, BNLF and PLF. These data suggest that COMT
Val158Met polymorphism may have more impact on the modulation of BP and lipid profiles in the average families
than in the long-lived families in Bama region. The association between this SNP and other phenotypes (e.g. cogni-tion) and its roles in the longevity in Bama area thus warrant further investigation.
Keywords: COMT, blood pressure, blood lipid, longevity
Introduction
Catechol-O-methyl-transferase (COMT) is an enzyme that catalyses the degradation of cat-echolamine neurotransmitters including dopa-mine (DA), norepinephrine, epinephrine, L-dopa and their metabolitesand thus inactivate them [1]. It is well established that DA plays essential roles in executive processing, especially in the function of pre-frontal cortex (PFC) [2, 3], and age-related loss of dopaminergic function cor-relates with cognitive impairment [4].
The gene encoding human COMT is mapped to chromosome 22q11 which spans 27 kb with 6 exons and is the most widely studied member
1538 family members from Bama long-lived families residing Bama area along the mid-stream of Hongshuihe River Basin (Bama, Fengshan, Donglan and Du’an County), Guangxi Zhuang Autonomous Region, P. R. China were enrolled as our target study group (BLF, 870 males and 668 females, aged 61. 8 ± 25. 8 ranging 30-104 years). Family members from three other families living in Bama and out-of-Bama area were recruited as comparison groups: (1) Bama non-long-lived families (BNLF, n = 600, 394 males and 206 females, age 53. 1 ± 23. 5 ranging 30-77 years), who live in the same area as BLF (environment-matched) but without a history of exceptional longevity (no past or current nonagenarian/centenarian in
the first, second and third degree relatives); (2)
Pingguo long-lived families (PLF, n = 538, 342 males and 196 females, aged 58. 5 ± 25. 5 ranging 30-95 years) from Pingguo, a county which belongs to Youjiang River system and is 200 km away from Bama area (environment-unmatched); (3) Pingguo non-long-lived fami-lies (PNLF, n = 403, 258 males and 145 females, aged 48. 5 ± 19. 6 ranging 30-72 years), average families from Pingguo County which have no history of exceptional longevity. These control groups were set to attenuate the potential confounding effect of environmental factors such as dietary habit and lifestyle or ethnic background on our observational vari-ables. All subjects were ethnically Zhuang, apparently healthy and had no evidence of any chronic illness. Participants with a history of myocardial infarction, stroke, hypertension and diabetes were excluded. The current study was approved by the Ethics Committee of Guangxi Medical University. All participants gave their written informed consents after an extensive description of aims of the study.
Epidemiological survey
Information on socio-demographic and lifestyle factors was collected with standardized ques-tionnaires. Anthropometric variables including blood pressure, body height, body weight, waist circumference and body mass index (BMI) were measured or calculated in all groups as des- cribed previously [11]. Hypertension was
defined as systolic blood pressure (SBP) > 140
mmHg and/or diastolic blood pressure (DBP) > 90 mmHg, and/or self-reported anti-hyperten-sive treatment within 2 weeks prior to the sur-vey [13]. Normal weight, overweight, and obe-Met allele [3, 7]. Patients with Parkinson’s
dis-ease (PD) and Alzheimer’s disdis-ease (AD) who exhibit poor cognition are more prevalent of COMT Val allele than average controls [8]. The COMT Val allele is associated with a younger age at onset in men with idiopathic PD [9]. Preclinical trials showed that COMT inhibitors improved working memory and attention in model animals and humans [2, 10]. More intriguingly, this polymorphism has so far only been found in humans, the only species that can develop cognition, a behavioral domain in which humans differ from non-human primates [3]. Together, these observations demonstrate that COMT Val allele correlates strongly with poorer while Met allele with better cognitive performance. In this context, it is therefore rea-sonable to hypothesize that long-lived popula-tions who preserve good cognition may be endowed a higher COMT Met frequency.
Nevertheless, it is worth noting that COMT has both central and peripheral effect, elevated cir-culatory COMT may increase peripheral vascu-lar resistance and predisposes individuals to hypertension. In addition, cognition is a consid-erably complex trait which is not only deter-mined by cerebral structure and volume but
also influenced by other factors such as blood
and nutrition supply. Hypertension and
unfavor-able lipid profile may impair cerebral vascular
functionality and be associated with poorer cognitive status.
Bama long-lived individuals residingalong the midstream of Hongshuihe River in Guangxi Pro-vince, P. R. China have emerged as an optimal cohort for human aging/longevity study over the past decades [11]. They had been found to preserve better cognition and daily living activ-ity as compared to age-matched populations from other regions in China [12]. In the current investigation, we genotyped the COMT Val- 158Met polymorphism and evaluate the poten-tial correlation with blood pressure and lipid levels for Bama long-lived families with normal cognition to see whether this variant overrepre-sents in these families and account for the lon-gevity in Bama area by interplaying with
com-mon cognitive influencing factors.
Materials and methods Subjects studied
The study design and the participating families
sity were defined as BMI < 24, 24 to 28, and >
28 kg/m2, respectively [14]. Biochemical measurements
An overnight fasting venous blood sample of 8 mL was drawn by venipuncture from each sub-ject, 4 mL of which was collected in a glass tube for serum separation and subsequent lipid determination while the remaining was trans-ferred to an anticoagulant tube (4.80 g/L citric acid, 14.70 g/L glucose, and 13.20 g/L triso-dium citrate) for DNA extraction. Total choles-terol (TC), triglycerides (TG), low density lipopro-tein cholesterol (LDL-C) and high density lipo-protein cholesterol (HDL-C) levels were mea-sured by enzymatic methods with commercially
available kits as also previously described [11]. Individuals with TC > 5.17 mmol/L and/or TG >
1.70 mmol/L were defined as dyslipidemia [15].
Genotyping
[image:3.629.100.540.96.256.2]Genomic DNA was extracted from peripheral blood leukocytes by using standard methods. The COMT Val158Met polymorphism was geno-typed by PCR-RFLP method using endonucle-ase Nla III for digestion as described by Lachman et al [16]. To ensure the reliability of genotyping, six randomly selected DNA sam-ples (two for each genotype) were sequenced and the sequencing results were all in line with that of genotyping. Laboratory technicians who Table 1. Comparison of clinical characteristics among groups (_x±s)
Parameters BLF (n = 1538) BNLF (n = 600) PLF (n = 538) PNLF (n = 403) F (χ2) P
Male/female (n) 870/668 394/206 342/196 258/145 20.872 0.001
Age (years) 61.75±25.80 53.12±23.51▲ 58.54±25.45▲ 48.53±19.60▲,# 77.477 0.000
BMI (kg/m2) 21.37±3.41 21.41±3.20 21.00±3.14▲ 21.63±3.68 3.162 0.024
FPG (mmol/L) 4.75±1.34 4.53±1.09▲ 4.41±1.47▲ 4.590±1.60 6.007 0.004
SBP (mmHg) 143.45±27.69 137.47±25.33 136.17±27.00▲ 129.26±21.56▲,# 11.180 0.000
DBP (mmHg) 86.56±12.10 85.30±11.55 81.67±11.03▲ 81.53±11.15▲,# 27.312 0.000
PP (mmHg) 56.89±23.08 52.18±20.74 54.59±22.92 47.73±17.72 1.440 0.229
TC (mmoL/L) 5.16±1.05 5.12±0.98 4.576±0.93▲ 4.58±0.98▲,# 60.096 0.000
TG (mmoL/L) 1.06(0.77) 1.08(0.82) 0.94(0.68)▲ 0.91(0.79) ▲,# 5.287 0.001
HDL-C (mmoL/L) 1.60±0.43 1.56±0.39 1.57±0.37 1.57±0.40 0.380 0.768
LDL-C (mmoL/L) 2.92±0.92 2.94±0.87 2.42±0.78▲ 2.42±0.85▲,# 59.133 0.000
BLF, Bama long-lived families; BNLF, Bama lived families; PLF, Pingguo long-lived families; PNLF, Pingguo non-long-lived families; BMI, body mass index; FPG, fasting plasma glucose; SBP, systolic blood pressure; DBP, diastolic blood pressure; PP, pulse pressure; TC, total cholesterol; TG, triglyceride; HDL-C, high-density lipoprotein cholesterol; LDL-C, low-density lipopro-tein cholesterol. The quan titative variables were presented as mean ± standard deviation and the values of TG were presented as median (interquartile range). As compared to BLF, ▲indicates P<0.05; comparison between PNLF and HNLF, #indicates P<0.05.
[image:3.629.106.526.345.470.2]and serum lipid variables was evaluated using analysis of covariance (ANCOVA). Multiple logis-tic analyses with stepwise modelling were used to evaluate the association of blood pressure and serum lipid levels with genotypes (GG = 1, GA = 2, AA = 3) and several environment fac-tors. In all hypothesis tests, two-tailed values of P<0.05 were considered statistically signifi -cant. All data were analyzed using the statisti-cal software package SPSS 16.0 (SPSS Inc, Chicago, IL).
Results
General clinical characteristics
The comparison of basic demographic and clin-ical data between BLF and other referent performed genotyping were blinded to clinical
and biochemical data. Statistical analyses
Levels of the quantitative variables are present-ed as mean ± SD (TG levels are presentpresent-ed as medians and interquartile due to skewed distri-bution). Allelic and genotypic frequencies were calculated directly. Hardy-Weinberg equilibrium was computed for the expected genotype
distri-bution using the standard goodness-of-fit test.
[image:4.629.99.529.93.521.2]Difference in genotype and allele distribution between the groups was estimated by using the chi-square test. The statistical evaluation for the categorical variables was based on the calculation of the Student t-test. The associa-tion of COMT genotypes with blood pressure
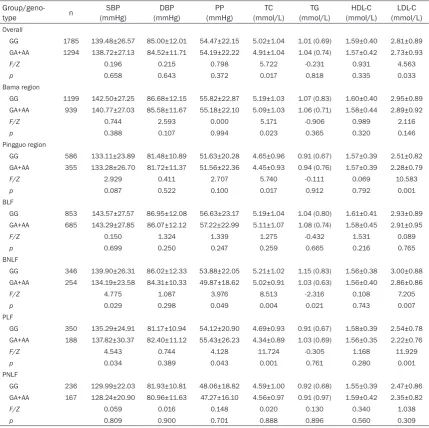
Table 2. Impact of COMT Val158Met genotype on BP and lipid levels in different groups
Group/geno-type n (mmHg)SBP (mmHg)DBP (mmHg)PP (mmol/L)TC (mmol/L)TG (mmol/L)HDL-C (mmol/L)LDL-C
Overall
GG 1785 139.48±26.57 85.00±12.01 54.47±22.15 5.02±1.04 1.01 (0.69) 1.59±0.40 2.81±0.89 GA+AA 1294 138.72±27.13 84.52±11.71 54.19±22.22 4.91±1.04 1.04 (0.74) 1.57±0.42 2.73±0.93
F/Z 0.196 0.215 0.798 5.722 -0.231 0.931 4.563
p 0.658 0.643 0.372 0.017 0.818 0.335 0.033
Bama region
GG 1199 142.50±27.25 86.68±12.15 55.82±22.87 5.19±1.03 1.07 (0.83) 1.60±0.40 2.95±0.89 GA+AA 939 140.77±27.03 85.58±11.67 55.18±22.10 5.09±1.03 1.06 (0.71) 1.58±0.44 2.89±0.92
F/Z 0.744 2.593 0.000 5.171 -0.906 0.989 2.116
p 0.388 0.107 0.994 0.023 0.365 0.320 0.146
Pingguo region
GG 586 133.11±23.89 81.48±10.89 51.63±20.28 4.65±0.96 0.91 (0.67) 1.57±0.39 2.51±0.82 GA+AA 355 133.28±26.70 81.72±11.37 51.56±22.36 4.45±0.93 0.94 (0.76) 1.57±0.39 2.28±0.79
F/Z 2.929 0.411 2.707 5.740 -0.111 0.069 10.583
p 0.087 0.522 0.100 0.017 0.912 0.792 0.001
BLF
GG 853 143.57±27.57 86.95±12.08 56.63±23.17 5.19±1.04 1.04 (0.80) 1.61±0.41 2.93±0.89 GA+AA 685 143.29±27.85 86.07±12.12 57.22±22.99 5.11±1.07 1.08 (0.74) 1.58±0.45 2.91±0.95
F/Z 0.150 1.324 1.339 1.275 -0.432 1.531 0.089
p 0.699 0.250 0.247 0.259 0.665 0.216 0.765
BNLF
GG 346 139.90±26.31 86.02±12.33 53.88±22.05 5.21±1.02 1.15 (0.83) 1.56±0.38 3.00±0.88 GA+AA 254 134.19±23.58 84.31±10.33 49.87±18.62 5.02±0.91 1.03 (0.63) 1.56±0.40 2.86±0.86
F/Z 4.775 1.087 3.976 8.513 -2.316 0.108 7.205
p 0.029 0.298 0.049 0.004 0.021 0.743 0.007
PLF
GG 350 135.29±24.91 81.17±10.94 54.12±20.90 4.69±0.93 0.91 (0.67) 1.58±0.39 2.54±0.78 GA+AA 188 137.82±30.37 82.40±11.12 55.43±26.23 4.34±0.89 1.03 (0.69) 1.56±0.35 2.22±0.76
F/Z 4.543 0.744 4.128 11.724 -0.305 1.168 11.929
p 0.034 0.389 0.043 0.001 0.761 0.280 0.001
PNLF
GG 236 129.99±22.03 81.93±10.81 48.06±18.82 4.59±1.00 0.92 (0.68) 1.55±0.39 2.47±0.86 GA+AA 167 128.24±20.90 80.96±11.63 47.27±16.10 4.56±0.97 0.91 (0.97) 1.59±0.42 2.35±0.82
F/Z 0.059 0.016 0.148 0.020 0.130 0.340 1.038
quencies of minor allele (A, Met) and its homo-zygotic (AA) and heterohomo-zygotic (GA, Val/Met) genotype of BLF were almost identical to that of BNLF (25.88%, 7.22% and 37.32% vs. 24.67%, 7.00% and 35.33%) but markedly higher than that of Pingguo groups (Figure 1A-C). However, these differences did not maintain through sex
stratification (data not shown).
Genotype and blood pressure and serum lipids
As shown in Table 2, in the overall, Bama and Pingguo population, no impact of COMT Val- groups was summarized in Table 1. The SBP,
DBP, BMI, FPG, TC, TG, LDL-C levels of BLF were similar with that of local BNLF controls but were
significantly higher than that of non-local coun -terparts. This might be ascribed to the higher mean age of BLF. No difference was found on pulse pressure and HDL-C levels among the four groups.
Genotype and allele distribution
None of the genotypic and allelic distributions
deviated significantly from that predicted by the
Hardy-Weinberg equilibrium (P > 0.05). The
fre-Table 3. Impact of COMT genotype on BP and lipids in different families stratified by gender
Group/genotype n SBP
(mmHg)
DBP (mmHg)
PP (mmHg)
TC (mmol/L)
TG (mmol/L)
HDL-C (mmol/L)
LDL-C (mmol/L)
BLF
Male GG 485 138.26±22.67 87.33±11.46 50.93±18.91 5.19±1.07 1.10 (1.01) 1.59±0.44 2.85±0.93 GA+AA 385 137.99±23.09 86.08±11.31 51.90±18.08 5.05±1.06 1.11 (0.90) 1.58±0.51 2.80±0.94
F/Z 0.963 1.577 4.214 3.013 -0.866 0.005 0.340
p 0.327 0.209 0.040 0.083 0.387 0.942 0.560
Female GG 368 150.77±31.73 86.42±12.86 64.35±26.03 5.19±1.00 0.99 (0.61) 1.64±0.36 3.03±0.82 GA+AA 300 150.36±31.85 86.05±13.14 64.31±26.67 5.20±1.08 1.04 (0.64) 1.59±0.35 3.05±0.94
F/Z 0.143 0.352 0.010 0.000 -1.862 3.153 0.015
p 0.705 0.553 0.922 0.982 0.063 0.076 0.904
BNLF
Male GG 230 137.80±25.22 87.27±12.49 50.53±20.77 5.11±0.94 1.22 (0.86) 1.53±0.38 2.88±0.84 GA+AA 164 131.51±18.89 84.37±10.25 47.15±13.79 4.98±0.93 1.04 (0.84) 1.52±0.41 2.83±0.90
F/Z 5.548 6.225 1.216 2.805 -1.865 0.027 0.616
p 0.019 0.013 0.271 0.095 0.062 0.870 0.433
Female GG 116 144.14±28.03 83.51±11.67 60.63±23.09 5.40±1.14 1.07 (0.81) 1.62±0.37 3.25±0.92 GA+AA 90 139.07±29.83 84.22±10.52 54.84±23.47 5.08±0.87 0.95 (0.52) 1.64±0.38 2.93±0.76
F/Z 0.970 0.392 2.268 5.296 -1.409 0.083 8.484
p 0.326 0.532 0.134 0.022 0.159 0.774 0.004
PLF
Male GG 218 134.24±21.20 81.96±10.02 52.28±18.48 4.78±0.93 1.01 (0.90) 1.53±0.39 2.58±0.81 GA+AA 124 134.62±24.73 84.23±11.35 50.39±20.04 4.33±0.90 1.07 (1.03) 1.55±0.38 2.15±0.74
F/Z 0.928 4.974 0.121 19.797 -0.765 0.356 22.769
p 0.336 0.026 0.728 1.17E-5 0.445 0.551 2.74E-6
Female GG 132 137.28±30.75 79.67±12.42 57.61±24.57 4.52±0.90 0.76 (0.44) 1.66±0.36 2.47±0.74 GA+AA 64 144.33±38.86 78.67±9.69 65.67±33.59 4.36±0.88 0.91 (0.41) 1.57±0.31 2.36±0.79
F/Z 2.286 0.311 4.878 1.447 -1.735 2.879 0.739
p 0.132 0.578 0.029 0.231 0.083 0.092 0.391
PNLF
Male GG 157 128.09±20.75 83.11±11.12 44.98±18.34 4.59±1.05 1.00 (0.94) 1.48±0.37 2.47±0.94 GA+AA 101 126.77±19.23 82.23±11.97 44.53±14.35 4.62±0.99 0.95 (1.17) 1.55±0.43 2.33±0.87
F/Z 1.014 0.002 1.335 0.511 -0.278 2.781 0.776
p 0.315 0.962 0.249 0.475 0.774 0.097 0.379
Female GG 79 133.69±24.038 79.63±9.84 54.06±18.41 4.59±0.89 0.84 (0.43) 1.69±0.40 2.49±0.70 GA+AA 66 130.42±23.14 79.08±10.91 51.35±17.73 4.48±0.94 0.81 (0.52) 1.64±0.40 2.37±0.75
F/Z 0.403 0.101 0.362 0.207 -0.155 0.302 0.541
[image:5.629.99.526.92.563.2]blacks (0.32), but profoundly lower than that of Caucasians (German, 0.52) [17-21], indicating
a geographical-specific allelic distribution pat -tern worldwide. The underlying mechanism for this great discrepancy and its implication has
yet to be elucidated. Further stratification anal -yses by gender and region showed that the fre-quency of mutant COMT genotypes (GA/AA) of BLF is statistically analogous to that of local
general families, but significantly higher than
that of out-of-Bama populations. The overrepre-sentation of an allele in Bama population seems to implicate that if it acts as an advan-tage factor it may be a genetic contribution to the longevity in the area; by contrary however, if it is a deleterious variant there may be other unknown buffering variants to counteract its unfavorable effect [22].
COMT 158Met has not only been linked to a reduced COMT activity and an increased cere-158Met polymorphism on SBP, DBP and PP
was detected (P > 0.05 for all), however, when it came to lipids, the TC and LDL-C levels of A allele carriers (GA/AA) were remarkably lower than non-A carriers (GG) (P < 0.05 for each). When analyzed according to families, no differ-ence was observed on blood pressure and lipid levels between the mutant (GA/AA) and the ancestral genotype (GG) in BLF and PNLF, which
persisted after sex stratification. However, GA/
AA genotype dramatically lowered SBP, PP, TC, TG and LDL-C levels in BNLF while raised SBP in PLF. When gender was taken into account, the impact of GA/AA genotype on blood pressure in BNLF mainly existed in males while its impact on lipids mainly existed in females. In PLF, GA/ AA genotype was associated with elevated DBP and lowered TC and LDL-C in males while with higher PP in females (Table 3). Together, in
Bama population, the influence of COMT
Val158Met polymorphism on blood pressure
and lipid levels predominantly in aver-age families rather than long-lived families.
Correlation analyses
Multiple linear regression analyses showed that COMT Val158Met corre-lated positively with PP in BLF while negatively with SBP and DBP in BNLF, i.e., A-allele carries tended to have higher PP in BLF but lower SBP and DBP in BNLF. No any correlation was observed between blood pressure and COMT polymorphism in the two Pinguo groups.
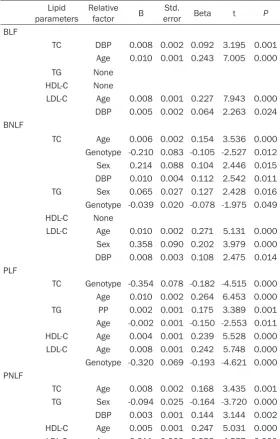
On lipids, COMT Val158Met correlat-ed with TC and LDL-C inversely in BNLF and PL, with A allele carriers tending to produce less TC and LDL-C. An absence of association was noted this polymorphism and lipids in BLF and PNLF (Tables 4, 5).
Discussion
[image:6.629.98.351.107.475.2]In the current study, the frequency of the minor A allele of the COMT gene at +158 locus in the overall population studied is around 0. 24, similar to that of other Chinese healthy populations (e.g. Shanghai Hans, 0. 25; South- western Hans, 0. 21), Japanese popu-lation (0.32) and even American Table 4. Relationship between blood pressure and relative
factors in different families
BP Relative factor B errorStd. Beta t P
BLF
SBP Age 0.646 0.023 0.616 28.210 0.000
DBP Age 0.178 0.018 0.380 9.835 0.000
TC 0.964 0.314 0.083 3.067 0.002
BP Age 0.479 0.025 0.541 18.907 0.000
Genotype 2.568 1.002 0.056 2.563 0.010 BNLF
SBP Age 0.702 0.037 0.651 18.874 0.000
Genotype -4.953 1.738 -0.095 -2.849 0.005
DBP Age 0.120 0.021 0.249 5.833 0.000
Sex -3.829 0.969 -0.159 -3.952 0.000 Genotype -2.436 0.921 -0.104 -2.645 0.008
LDL-C 1.490 0.569 0.110 2.617 0.009
PP Age 0.540 0.029 0.614 18.634 0.000
PLF
SBP Age 0.735 0.035 0.680 20.814 0.000
TG 14.344 3.736 0.133 3.840 0.000
DBP Age 0.169 0.020 0.379 8.634 0.000
PP Age 0.535 0.032 0.577 16.536 0.000
TG 13.611 3.444 0.147 3.952 0.000
HDL-C 4.836 2.120 0.078 2.281 0.023
PNLF
SBP Age 0.532 0.046 0.491 11.672 0.000
DBP Age 0.184 0.035 0.310 5.251 0.000
TG 8.021 2.152 0.191 3.728 0.000
ing populations [28]. Assuming that COMT Met is indeed correlated with hypertension, COMT inhibitor entacapone may be a therapeutic strategy, but its elusive anti-hypertensive effect has not been established [29]. Thus, there is no clear consensus on the association between COMT rs4680 and hypertension to date. We have no appropriate explanation for the higher blood pressure in BLF currently; a long-term longitudinal follow-up is thus warranted.
Very little data was available as far as the asso-ciation between COMT Val158Met
polymor-phism and lipid profile is concerned, most of
which were mainly based on population models bral DA level which is favorable of the
mainte-nance of better cognition, but also to a higher risk of hypertension due to a spontaneous ele-vation of peripheral DA concentration. For instance, systolic and diastolic pressure had been found to be raised in Met/Met COMT homogenous individuals in Taiwanese females and Sweden and Japanese middle-aged males as compared to the other two genotypes, which was interpreted by a lowered degradation of DA and catechol estrogen and their resultant peripheral synaptic levels [7, 23]. By investigat-ing the impact of COMT rs4680 on blood pres-sure and its association with daily intake of salt and calories, Htun et al observed that Japa-
nese middle-aged men carrying COMT Met/Met genotype dis-played higher systolic and dia-stolic pressure levels and high-er incidence rate of hyphigh-erten- hyperten-sion than who carried Val/Val and Val/Met genotypes [24]. These ob-servations had found their support in animal models, in which hypertensive rats exhibited higher COMT activity than normotensive rats [25], and COMT knockout mice were more resistant to salt-induced hypertension than genetically normal mice [26]. Nevertheless, Hagan et al noted almost oppo-site results in Norwegian popu-lation: enhanced instead of reduced COMT activity correlat-ed with hypertension, Val/Val rather than Met/Met homoge-nous genotype presented more frequently in SBP-elevated sub-jects [27]. In the current study, after adjustment for age, we found that although the blood pressure level of BLF was
sig-nificantly higher than that of
geographic- and non-geograph-ic-matched controls, it lacked distinct association with COMT Val158Met polymorphism, wh- ile in BNLF, Met allele was found to be related to lowered SBP and DBP, particularly in men.
These divergent finding may be
attributed to the different genetic background, sample size, sex ratio, age range of the enrolled subjects across study-Table 5. Relationship between serum lipid parameters and
relative factors in different families
Lipid
parameters Relative factor B errorStd. Beta t P BLF
TC DBP 0.008 0.002 0.092 3.195 0.001
Age 0.010 0.001 0.243 7.005 0.000
TG None
HDL-C None
LDL-C Age 0.008 0.001 0.227 7.943 0.000
DBP 0.005 0.002 0.064 2.263 0.024
BNLF
TC Age 0.006 0.002 0.154 3.536 0.000
Genotype -0.210 0.083 -0.105 -2.527 0.012
Sex 0.214 0.088 0.104 2.446 0.015
DBP 0.010 0.004 0.112 2.542 0.011
TG Sex 0.065 0.027 0.127 2.428 0.016
Genotype -0.039 0.020 -0.078 -1.975 0.049
HDL-C None
LDL-C Age 0.010 0.002 0.271 5.131 0.000
Sex 0.358 0.090 0.202 3.979 0.000
DBP 0.008 0.003 0.108 2.475 0.014
PLF
TC Genotype -0.354 0.078 -0.182 -4.515 0.000
Age 0.010 0.002 0.264 6.453 0.000
TG PP 0.002 0.001 0.175 3.389 0.001
Age -0.002 0.001 -0.150 -2.553 0.011
HDL-C Age 0.004 0.001 0.239 5.528 0.000
LDL-C Age 0.008 0.001 0.242 5.748 0.000
Genotype -0.320 0.069 -0.193 -4.621 0.000 PNLF
TC Age 0.008 0.002 0.168 3.435 0.001
TG Sex -0.094 0.025 -0.164 -3.720 0.000
DBP 0.003 0.001 0.144 3.144 0.002
HDL-C Age 0.005 0.001 0.247 5.031 0.000
[image:7.629.98.379.105.545.2]of some disorders. For instance, Almeida and colleagues did not reveal any impact of this variant on lipid levels in Brazilian perimeno-pausal women [30]. Patients with chronic renal disorders who carried COMT 158Met present-ed lowerpresent-ed LDL-C level [19]. Schizophrenia suf-ferers complicated with metabolic syndrome (MS) who harbored COMT 158Met documented an elevated TG and homocysteine (Hcy) level in females but not in males [17]. This modulation of TG and Hcy was believed to be the outcome of the interactions between COMT 158Met and MTHFR 677C/T, a common variant on methy-lene tetrahydrofolate reductase (MTHFR) gene [31]. Works from other research group had also shown that COMT might involve in the metabo-lism of Hcy in that COMT activity positively cor-related with serum Hcy level while COMT inhibi-tor lowered Hcy level [32]. In addition, COMT might affect human appetite and eating behav-ior via dopaminergic pathway, entailing pre-school children a predilection to palatable oily food and resultant hyperlipidemia and obesity
[33]. To our knowledge, this is the first
family-based study to evaluate the association of
COMT Val158Met and lipid profiles in the gen -eral population and long-lived subjects, unrav-eling overall a reverse correlation between COMT Val158Met and TC and LDL-C. This cor-relation, however, might be affected by family and gender in that it no longer remained in BLF
through family and gender stratification, indi -cating a limited impact, if any, of COMT Val158Met on lipid modulation in long-lived families. The relatively higher lipid levels in BLF might be attributed to its higher proportion of the oldest olds who had less molar teeth and
preferred myofiber-free fatty pork [11].
In sum, although presented more frequently in Bama area, COMT 158Met mainly modulate blood pressure and lipid levels in general fami-lies rather than long-lived famifami-lies. The limited impact of this polymorphism on blood pressure and lipid parameters may imply that there are other unveiled variants which might interplay with each other and shape the age-related traits and the survival status in Bama lon-gevous area. Its possible links with other phe-notypes (e.g. cognition) and contributions to the longevity in Bama region deserve further exploration.
Acknowledgements
This work was supported by the National Na- tural Science Foundation of China (No. 311-
60209, 81360066) and the Natural Science Foundation of Guangxi (2013GXNSFAA019180, 2013GXNSFBB053002). We thank all
partici-pants for their sample donation. We specifically
appreciate Dr. Jian-Hua Huang (Fengshan People Hospital), Dr. Hong-Bo Liang (Donglan People’s Hospital) and Dr. Wen Shi (Pingguo Bureau of Health) for the organization for
sam-pling and field studies.
Disclosure of conflict of interest
None.
Address correspondence to: Dr. Jun-Hua Peng, Department of Pathophysiology, Guangxi Medical University, 22 Shuangyong Rd, Nanning 530021, Guangxi, China. Tel: +86-771-5358292; E-mail: [email protected]
References
[1] Bertocci B, Miggiano V, Da Prada M, Dembic Z, Lahm HW, Malherbe P. Human catechol-O-methyltransferase: cloning and expression of the membrane-associated form. Proc Natl Acad Sci U S A 1991; 88: 1416-20.
[2] Tunbridge EM, Bannerman DM, Sharp T, Harrison PJ. Catechol-o-methyltransferase inhi-bition improves set-shifting performance and elevates stimulated dopamine release in the rat prefrontal cortex. J Neurosci 2004; 24: 5331-5.
[3] Enoch MA, Waheed JF, Harris CR, Albaugh B, Goldman D. COMT Val158Met and cognition: main effects and interaction with educational attainment. Genes Brain Behav 2009; 8: 36-42.
[4] Backman L, Nyberg L, Lindenberger U, Li SC, Farde L. The correlative triad among aging, do-pamine, and cognition: current status and fu-ture prospects.Neurosci Biobehav Rev 2006; 30: 791-807.
[5] Reinvang I, Deary IJ, Fjell AM, Steen VM, Espeseth T, Parasuraman R. Neurogenetic ef-fects on cognition in aging brains: a window of opportunity for intervention? Front Aging Neurosci 2010; 2: 143.
[6] Chen J, Lipska BK, Halim N, Ma QD, Matsumoto M, Melhem S, Kolachana BS, Hyde TM, Herman MM, Apud J, Egan MF, Kleinman JE, Weinberger DR. Functional analysis of gene- tic variation in catechol-O-methyltransferase (COMT): effects on mRNA, protein, and enzyme activity in postmortem human brain. Am J Hum Genet 2004; 75: 807-21.
Met genotype on frontal lobe function and risk for schizophrenia. Proc Natl Acad Sci U S A 2001; 98: 6917-22.
[8] Martínez MF, Martín XE, Alcelay LG, Flores JC, Valiente JM, Juanbeltz BI, Beldarraín MA, López JM, Gonzalez-Fernández MC, Salazar AM, Gandarias RB, Borda SI, Marqués NO, Amillano MB, Zabaleta MC, de Pancorbo MM. The COMT Val158 Met polymorphism as an as-sociated risk factor for Alzheimer disease and mild cognitive impairment in APOE 4 carriers. BMC Neurosci 2009; 10: 125.
[9] Klebe S, Golmard JL, Nalls MA, Saad M, Singleton AB, Bras JM, Hardy J, Simon-Sanchez
J, Heutink P, Kuhlenbäumer G, Charfi R, Klein
C, Hagenah J, Gasser T, Wurster I, Lesage S, Lorenz D, Deuschl G, Durif F, Pollak P, Damier P, Tison F, Durr A, Amouyel P, Lambert JC, Tzourio C, Maubaret C, Charbonnier-Beaupel F, Tahiri K, Vidailhet M, Martinez M, Brice A, Corvol JC; French Parkinson’s Disease Genetics Study Group; International Parkin- son’s Disease Genomics Consortium (IPDGC). The Val158Met COMT polymorphism is a
mod-ifier of the age at onset in Parkinson’s disease
with a sexual dimorphism. J Neurol Neurosurg Psychiatry 2013; 84: 666-73.
[10] Apud JA, Mattay V, Chen J, Kolachana BS, Callicott JH, Rasetti R, Alce G, Iudicello JE, Akbar N, Egan MF, Goldberg TE, Weinberger DR. Tolcapone improves cognition and cortical information processing in normal human sub-jects. Neuropsychopharmacology 2007; 32: 1011-20.
[11] Pan SL, Luo XQ, Lu ZP, Lu SH, Luo H, Liu CW, Hu CY, Yang M, Du LL, Song Z, Pang GF, Wu HY, Huang JB, Peng JH, Yin RX. Microsomal triglyc-eride transfer protein gene -493G/T polymor-phism and its association with serum lipid lev-els in Bama Zhuang long-living families in China. Lipids Health Dis 2012; 11: 177. [12] Lv Z, Zheng C, Yang Z, Liang J, Hu C, Li X, Han
B, Yang X, Chen J, Pang G. Cognitive Function and Activity of Daily Living of the Old Elderly of Zhuung Nationality in Bama County. Chinese Mental Health Journal 2003; 17: 98-100. [13] Ruixing Y, Jiaqiang D, Dezhai Y, Weixiong L,
Shangling P, Jinzhen W, Jiandong H, Xiuyan L. Effects of demographic characteristics, health related behaviors and lifestyle factors on the prevalence of hypertension for the middle-aged and elderly in the Guangxi Hei Yi Zhuang and Han populations. Kidney Blood Press Res 2006; 29: 312-20.
[14] Zhou B; Cooperative Meta-analysis Group of China Obesity Task Force. Predictive values of body mass index and waist circumference to risk factors of related diseases in Chinese adult population. Zhonghua Liu Xing Bing Xue Za Zhi 2002; 23: 5-10.
[15] Ruixing Y, Yuming C, Shangling P, Fengbing H, Tangwei L, Dezhai Y, Jinzhen W, Limei Y, Weixiong L, Rongshan L, Jiandong H. Effects of demographic, dietary, and other lifestyle fac-tors on the prevalence of hyperlipidemia in Guangxi Hei Yi Zhuang and Han populations. Eur J Cardiovasc Prev Rehabil 2006; 13: 977-84.
[16] Lachman HM, Papolos DF, Saito T, Yu YM, Szumlanski CL, Weinshilboum RM. Human catechol-O-methyltransferase pharmacogenet-ics: description of a functional polymorphism and its potential application to neuropsychiat-ric disorders. Pharmacogenetics 1996; 6: 243-50.
[17] Zhang Y, Chen M, Chen J, Wu Z, Yu S, Fang Y, Zhang C. Metabolic syndrome in patients
tak-ing clozapine: prevalence and influence of cat -echol-O-methyltransferase genotype. Psycho- pharmacology (Berl) 2014; 231: 2211-8. [18] Wang Q, Li H, Tao P, Wang YP, Yuan P, Yang CX,
Li JY, Yang F, Lee H, Huang Y. Soy Isoflavones,
CYP1A1, CYP1B1, and COMT Polymorphisms, and Breast Cancer: a case-control study in southwestern China. DNA Cell Biol 2011; 30: 585-95.
[19] Yoshida T, Kato K, Yokoi K, Oguri M, Watanabe S, Metoki N, Yoshida H, Satoh K, Aoyagi Y, Nishigaki Y, Nozawa Y, Yamada Y. Association of genetic variants with chronic kidney disease
in individuals with different lipid profiles. Int J
Mol Med 2009; 24: 233-46.
[20] Ittiwut R, Listman JB, Ittiwut C, Cubells JF, Weiss RD, Brady K, Oslin D, Farrer LA, Kranzler HR, Gelernter J. Association between polymor-phisms in catechol-O-methyltransferase (CO- MT) and cocaine-induced paranoia in Eur- opean-American and African-American po- pulations. Am J Med Genet B Neuropsychiatr Genet 2011; 156B: 651-60.
[21] Witte AV, Jansen S, Schirmacher A, Young P, Flöel A. COMT Val158Met Polymorphism Modulates Cognitive Effects of Dietary Inter- vention. Front Aging Neurosci 2010; 2: 146. [22] Huffman DM, Deelen J, Ye K, Bergman A, Slag-
boom EP, Barzilai N, Atzmon G. Distinguishing Between Longevity and Buffered-Deleterious Genotypes for Exceptional Human Longevity: the case of the MTP Gene. J Gerontol A Biol Sci Med Sci 2012; 67: 1153-60.
[23] Worda C, Sator MO, Schneeberger C, Jantschev
T, Ferlitsch K, Huber JC. Influence of the cate -chol-O-methyltransferase (COMT) codon 158 polymorphism on estrogen levels in women. Hum Reprod 2003; 18: 262-6.
hypertension: interaction with dietary energy intake.Am J Hypertens 2011; 24: 1022-6. [25] Okuda T, Sumiya T, Iwai N, Miyata T. Pyridoxine
5’-phosphate oxidase is a candidate gene re-sponsible for hypertension in Dahl-S rats. Biochem Biophys Res Commun 2004; 313: 647-53.
[26] Helkamaa T, Männistö PT, Rauhala P, Cheng ZJ, Finckenberg P, Huotari M, Gogos JA, Karayiorgou M, Mervaala EM. Resistance to salt-induced hypertension in catechol-O-meth-yltransferase-gene-disrupted mice. J Hypertens 2003; 21: 2365-74.
[27] Hagen K, Pettersen E, Stovner LJ, Skorpen F, Holmen J, Zwart JA. High systolic blood pres-sure is associated with Val/Val genotype in the catechol-o-methyltransferase gene. The Nord-Trondelag Health Study (HUNT). Am J Hypertens 2007; 20: 21-6.
[28] Annerbrink K, Westberg L, Nilsson S, Rosmond R, Holm G, Eriksson E. Catechol O-methy- ltransferase val158-met polymorphism is as-sociated with abdominal obesity and blood pressure in men. Metabolism 2008; 57: 708-11.
[29] Jordan J, Lipp A, Tank J, Schröder C, Stoffels M, Franke G, Diedrich A, Arnold G, Goldstein DS, Sharma AM, Luft FC. Catechol-o-methyltran- sferase and blood pressure in humans. Cir- culation 2002; 106: 460-5.
[30] Almeida S, Zandoná MR, Franken N, Callegari-Jacques SM, Osório-Wender MC, Hutz MH. Estrogen-metabolizing gene polymorphisms and lipid levels in women with different hor-monal status. Pharmacogenomics J 2005; 5: 346-51.
[31] Burghardt KJ, Pilsner JR, Bly MJ, Ellingrod VL. DNA methylation in schizophrenia subjects: gender and MTHFR 677C/T genotype differ-ences. Epigenomics 2012; 4: 261-8.
[32] Lamberti P, Zoccolella S, Iliceto G, Armenise E, Fraddosio A, de Mari M, Livrea P. Effects of le-vodopa and COMT inhibitors on plasma homo-cysteine in Parkinson’s disease patients. Mov Disord 2005; 20: 69-72.