Received 13 May 2015|Accepted 25 Jun 2015|Published 11 Aug 2015
Whole-central nervous system functional imaging
in larval
Drosophila
William C. Lemon
1,*, Stefan R. Pulver
1,*, Burkhard Ho
¨ckendorf
1, Katie McDole
1, Kristin Branson
1, Jeremy Freeman
1& Philipp J. Keller
1Understanding how the brain works in tight concert with the rest of the central nervous system (CNS) hinges upon knowledge of coordinated activity patterns across the whole CNS. We present a method for measuring activity in an entire, non-transparent CNS with high spatiotemporal resolution. We combine a light-sheet microscope capable of simultaneous multi-view imaging at volumetric speeds 25-fold faster than the state-of-the-art, a whole-CNS imaging assay for the isolated Drosophila larval CNS and a computational framework for analysing multi-view, whole-CNS calcium imaging data. We image both brain and ventral nerve cord, covering the entire CNS at 2 or 5 Hz with two- or one-photon excitation, respectively. By mapping network activity during fictive behaviours and quantitatively comparing high-resolution whole-CNS activity maps across individuals, we predict functional connections between CNS regions and reveal neurons in the brain that identify type and temporal state of motor programs executed in the ventral nerve cord.
DOI: 10.1038/ncomms8924 OPEN
I
n recent years, advances in neurogenetics and live imaging technology have reshaped the way neurobiologists approach long-standing questions. A new generation of geneticallyencoded calcium indicators1,2 in conjunction with sophisticated
systems for targeted expression of transgenes allow for non-invasive recording of activity across large populations of
neurons3–5. In parallel, development of advanced imaging
technology such as light-sheet microscopy and light-field microscopy have facilitated high-speed, high-resolution
three-dimensional (3D) imaging of large neural tissue volumes6–13.
Together, these technologies bring into reach the possibility of recording from every part of a nervous system during behaviours.
Not only would the ability to simultaneously record
activity everywhere within an entire central nervous system (CNS) enable measurements of large-scale network dynamics and provide a way to discover and map functional connections
between remote CNS regions14; whole-CNS functional imaging,
that is, simultaneous imaging of both brain and nerve cord, would also afford researchers with opportunities to comprehensively record from motor circuitry while simultaneously imaging activity across the brain. Such a method would thus make it possible to systematically study how brain and nerve cord interact to generate behaviour.
Owing to fundamental technical challenges15, however, it has
so far not been possible to perform whole-CNS functional
imaging in a nervous system larger than that of Caenorhabditis
elegans11. Even in fairly transparent specimens, such as the larval zebrafish, large-scale functional imaging has been limited
to the brain7,8,16. There are three major challenges to overcome
these limitations: development of imaging technology that tracks activity at physiologically relevant timescales while also maximizing physical coverage and spatial resolution throughout the CNS; development of preparations that allow imaging of neural activity in all parts of the CNS during behaviours; and development of computational methods for interpreting complex patterns of activity at the whole-CNS level and for comparing results across individuals.
The larval fruit flyDrosophila melanogasteroffers an attractive
opportunity for realizing functional imaging of an entire, complex CNS. The larval fruit fly is a genetically tractable model with a
sophisticated toolkit for controlling transgene expression5,17–19
and a CNS that retains the ability to produce locomotor patterns
in isolation from sensory input20,21. However, similar to most
model organisms used for functional imaging studies,Drosophila
larvae also have a fairly opaque nervous system that represents a fundamental problem for comprehensive imaging with light microscopy.
The objective of this paper is to address the three central
challenges outlined above and introduce a complete
methodological framework—from sample preparation and
functional imaging to image analysis—for discovering and
analysing functional relationships throughout the entire,
non-transparent CNS of larval Drosophila. Our methodological
framework combines three novel components, each of which is designed to overcome one of the three limitations.
First, we present a light-sheet microscope that enables high-speed multi-view functional imaging with one- or two-photon excitation. Multi-view imaging is essential for optimizing physical
coverage of non-transparent specimens22–25, but state-of-the-art
technology22,23,26is by one to two orders of magnitude too slow
to resolve the sub-second timescales relevant for functional imaging with calcium indicators. In order to advance imaging performance beyond this critical threshold, we developed a new multi-view imaging technique, termed high-speed simultaneous multi-view (hs-SiMView) microscopy, that improves temporal
resolution inDrosophila-sized samples by 25-fold.
Second, we integrated these capabilities with a sample preparation strategy and imaging assay for the isolated larval CNS, and demonstrate, for the first time, to our knowledge, functional imaging of neural activity in the entire, non-transparent CNS of a higher invertebrate. We used this assay to image coordinated motor activity patterns throughout the CNS for up to an hour, acquiring 20,000 volumes per sample at a sustained volumetric imaging speed of 5 Hz.
Third, we developed a computational framework for processing and analysing multi-view calcium imaging data produced by hs-SiMView microscopy at a rate of several terabytes per experiment. This framework facilitates mapping functional relationships across the CNS during fictive behaviours and allows quantitative comparison of high-resolution, 3D neural activity maps across multiple nervous systems.
We use our combined system to characterize large-scale patterns of brain activity associated with different locomotor states in the nerve cord, predict functional connections between disparate CNS regions and identify neurons with activity patterns that are representative of the types and temporal states of different motor programs.
Results
Light-sheet microscopy for whole-CNS functional imaging.
Light-sheet-based functional imaging has proven to
be highly effective for observing activity in large populations of neurons. Existing microscopes offer single-view imaging capability suitable for monitoring neural activity in the brain
of transparent zebrafish larvae7–9 or in surface regions of
mammalian neural tissues6,10,13. In a non-transparent, highly
light-scattering CNS, such as that of D. melanogaster, this
approach can only partially penetrate the specimen for fluorescence excitation and detection. Single-view imaging thus gives access to only a small fraction—approximately one
quarter—of the Drosophila CNS, and coverage of the entire
CNS critically requires multi-view imaging capability with at least four complementary views (Supplementary Fig. 1). However, state-of-the-art microscopes with such multi-view imaging capability, such as SiMView light-sheet microscopy, were
designed for imaging applications in developmental
biology22,23,26, and are by at least one to two orders of
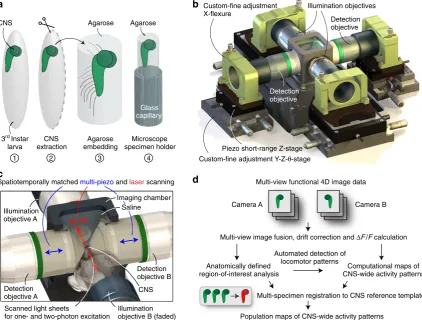
magnitude too slow for system-level functional imaging. Here we advance SiMView microscopy and present a light-sheet microscope capable of simultaneous multi-view imaging at the speed required for calcium imaging (Fig. 1). This hs-SiMView microscope offers functional imaging with both one-and two-photon excitation, one-and is the result of four advances spanning microscope design, microscope control and real-time data handling. These concepts are briefly summarized in the following and described in detail in the Methods section (‘Light-sheet microscope for multi-view functional imaging’ and Supplementary Fig. 2).
First, we redesigned the SiMView microscope (Fig. 1b, Supplementary Fig. 2 and Supplementary Data 1). Conventional SiMView light-sheet imaging relies on maintaining a stationary optical arrangement and moving the specimen through the light sheets with motorized samples, which fundamentally
limits volumetric imaging speed22. In hs-SiMView, light sheets
and detection focal planes are moved in synchrony relative to the stationary specimen location for 3D optical sectioning, that is, objective positions are continuously adjusted via piezo
positioners7, light sheets are rapidly translated with galvanometer
introduces several challenges for multi-view imaging. High-speed piezo positioning requires the use of high-stiffness piezos with
short travel range on the order of no more than 100–250mm.
Thus, positions and orientations of the 3D fields-of-view associated with each of the four optical arms must be precisely matched to maximize the overall size of the specimen volume accessible by all arms. At the same time, the translational and rotational degrees of freedom required for this purpose must be implemented through a design that minimizes the mechanical footprint and added load on the piezo positioners. These
requirements rule out commercially available multi-axis
positioning technology, as the relatively large mass of such components would significantly impact piezo performance and thereby slow down the imaging process. We therefore developed custom four-axis stage and flexure systems for the key mechanical positioning tasks in the microscope (Fig. 1b and Supplementary
Fig. 2), ensuring robust 3D volume matching with micrometre precision without compromising piezo performance. To enable the reproduction of the imaging technology described here, we provide detailed technical drawings of these critical custom parts of the hs-SiMView microscope (Supplementary Data 1).
Second, we developed a control/acquisition software frame-work for high-speed piezo-based multi-view imaging. This framework also eliminates previous limitations in raw image
acquisition speed7,22, thereby enabling acquisition of up to
10 terabytes of image data at a sustained rate of 1 GB per second. Third, we developed a strategy for multi-view microscope alignment that improves spatial overlap of the four focal planes and light sheets throughout the specimen volume. In order to reduce degradation of image quality resulting from spatially varying shifts between focal planes and light sheets (resulting from non-planar optical interfaces along the light path and a
Custom-fine adjustment Y-Z-θ-stage
Piezo short-range Z-stage Custom-fine adjustment X-flexure
Illumination objectives
Detection objective
Detection objective
3rd Instar
larva
CNS extraction
Agarose embedding
Agarose
Microscope specimen holder
1 2 3 4
Agarose
Illumination objective A c
d b
Detection objective A
Detection objective B
Spatiotemporally matched multi-piezoand laser scanning
CNS
Illumination objective B (faded) Scanned light sheets
for one- and two-photon excitation
Glass capillary
Multi-view functional 4D image data
Camera A Camera B
Multi-view image fusion, drift correction and ΔF/F calculation
Automated detection of locomotor patterns Anatomically defined
region-of-interest analysis
Computational maps of CNS-wide activity patterns
Population maps of CNS-wide activity patterns
Multi-specimen registration to CNS reference template CNS
Imaging chamber Saline
f i d ift
Multi view functio
A Ca
ti dΔF
[image:3.595.86.509.52.372.2]C nal 4D image d
Figure 1 | Light-sheet microscopy and computational tools for whole-CNS functional imaging.(a) For optimal optical access, the CNS of aDrosophila
third (3rd) instar larva is extracted by surgery and embedded in a soft, transparent agarose cylinder supported by a glass capillary for mounting in the hs-SiMView light-sheet microscope. (b) The CNS explant is then transferred to the microscope’s specimen chamber filled with physiological saline. The illustration shows the hs-SiMView microscope core for SiMView functional imaging, including the central specimen chamber, two illumination objectives for bi-directional fluorescence excitation with scanned laser light sheets and two opposing detection objectives mounted on high-speed piezo stages. The 3D volumes covered by the two piezo-operated detection objectives are matched with a precision of a few micrometres using custom Y-Z-y
fine adjustment stages and objective X-flexures. (c) In conventional multi-view light-sheet microscopy, the specimen is physically moved through the light sheet for volumetric imaging, which fundamentally constrains imaging speed. In contrast, high-speed multi-view volumetric imaging in hs-SiMView is achieved by keeping the specimen stationary and instead co-translating the focal planes of the two opposing detection systems using piezos.
heterogeneous optical sample properties), hs-SiMView adjusts relative positions of light sheets and detection focal planes, respectively, across the specimen volume on the basis of manual measurements at the onset of the imaging experiment.
Fourth, we developed a multi-view functional imaging assay using two-photon excitation that complements the high-speed imaging mode using one-photon excitation and provides an improved signal-to-background ratio at a reduced imaging speed (180 frames per second with two-photon hs-SiMView versus 370 frames per second with one-photon hs-SiMView).
As a result of the improvements outlined above, hs-SiMView is capable of multi-view functional imaging of a third instar
larval CNS-sized volume of 500200200mm3 at 5 Hz with
one-photon excitation (Supplementary Movies 1 and 2) and at 2 Hz with two-photon excitation (Supplementary Movies 3–5), that is, 25-fold faster than volumetric imaging of similar-sized
specimens in previous multi-view light-sheet microscopes22,23
(see Methods section and Supplementary Methods).
Estimating spatial resolution across the CNS of larvalDrosophila. We systematically estimated spatial resolution as a function of location within CNS preparations (see ‘Spatial resolution analysis’ in Supplementary Methods section). This analysis takes advantage of fluorescent markers expressed in the nuclei of all cells and provides detailed 3D maps of spatial resolution for various devel-opmental stages (Supplementary Figs 3–6 and Supplementary Movies 6–8). These maps show that our light-sheet-based imaging method achieves cellular or even subcellular resolution throughout non-neuropil regions of the isolated first and second instar larval CNS (Supplementary Figs 4 and 5, and Supplementary Movies 6 and 7), and for a large fraction of non-neuropil regions of the isolated third instar larval CNS (Supplementary Fig. 6 and Supplementary Movie 8). We found that, at a regional level, average resolution is highest in the ventral nerve cord (VNC), whereas in the brain (brain lobes and suboesophageal ganglion, SOG) relative resolution is reduced as a result of the longer average illumination and detection path lengths: in first and second instar stages, lateral and axial resolution are on average 22 and 8%, respectively, better in VNC versus brain; and in the third instar stage, lateral and axial resolution are on average 14 and 44%, respectively, better in VNC versus brain. Our estimates of average lateral/axial resolution
throughout non-neuropil regions are 1.0/2.5mm for the first instar
stage, 1.1/3.2mm for the second instar stage and 1.6/5.9mm for the
third instar stage (for detailed statistics, please see ‘Spatial resolution analysis’ in Supplementary Methods section).
Functional imaging of the isolated Drosophila CNS. We expressed the genetically encoded calcium indicator GCaMP6s
panneuronally in third instar larvae1 and imaged fluorescence
changes associated with neural activity in the isolated CNS using hs-SiMView microscopy with one-photon excitation (Fig. 2 and Supplementary Movies 1 and 2) or two-photon excitation (Supplementary Movies 3–5), respectively. Before imaging, CNS explants were embedded in low-melting-point agarose and immersed in physiological saline (Fig. 1a–c). These embedded preparations produced a range of segmentally coordinated activity patterns including waves of anterior progressing and posterior progressing activity in the VNC for up to an hour (Figs 2 and 3, and Supplementary Movies 1–5). These waves represent fictive forward and backward crawling motor patterns,
respectively20,21,27.
We compared frequency and duration of forward and back-ward waves in embedded preparations to those in agarose-free controls (Fig. 3c–h). In embedded preparations, wave durations
were 9.3±3.7 and 4.7±1.1 s, and wave frequencies were 9.5±4.1
and 15.5±9.0 mHz for forward and backward waves, respectively
(mean±s.d., n¼6 preparations). In agarose-free preparations,
wave durations were 10.0±2.7 and 5.0±0.3 s, and wave
frequencies were 10.3±4.6 and 12.4±5.9 mHz for forward and
backward waves, respectively (mean±s.d., n¼5 preparations).
Overall, no significant differences in wave frequency or duration were observed between embedded and agarose-free preparations
(PZ0.53 for all comparisons, unpaired t-test), suggesting that
sample physiology was well preserved.
Imaging activity in the entire volume of the third instar larval CNS generated large and information-rich data sets. We sampled the volume of the larval CNS using 25–50 million voxels and typically acquired 10 volumes per second (5 volumes per second per camera, 370 images per second), which produced sustained data streams of 500–1,000 MB per second for typically 1 h. For
each CNS with an estimated 12,000–15,000 neurons28, we thus
recorded and analysed several terabytes of multi-view functional image data (see Methods section and Supplementary Methods).
Computational methods for whole-CNS image analysis. To address the wide spectrum of data processing and data analysis needs arising from our multi-view, whole-CNS functional ima-ging experiments, we developed a computational framework for hs-SiMView image data (see Fig. 1d, Methods section and Supplementary Data 2). This framework covers all essential image processing and data analysis tasks, including high-throughput lossless compression of the automatically detected image ground, multi-view registration and fusion of the image fore-ground, local and global compensation of specimen drift across
the time-lapse experiment, computation of aDF/Frepresentation
of the functional image data, automated detection and classifi-cation of fictive behaviours, and high-resolution mapping of activity timing relationships across the CNS during fictive beha-viours. The latter two data analysis methods are explained in more detail in the context of the respective biological analyses presented in the following sections. Further details are provided in the Methods section.
We furthermore implemented a strategy for quantitative comparison of whole-CNS activity timing maps across multiple nervous systems. This method takes advantage of existing
nonlinear image registration techniques for neural tissues29,30
to create a reference template of the Drosophila larval nervous
system. Using this template, we spatially registered and compared whole-CNS activity maps obtained from different specimens.
For efficient large-scale hs-SiMView data management, our framework automatically determines the geometry of the nervous system from multi-view image data and stores only voxels located in the image foreground containing the specimen, using our custom block-based KLB file format for lossless data
compression. These algorithms reduce data size410-fold.
All of our software modules are highly memory efficient and were designed for processing multi-terabyte data sets in a high-throughput setting. As a result of these design goals, all computations can be rapidly performed on a single computer workstation. The open source code and documentation of all software modules are provided in Supplementary Data 2.
Drosophilalarvae. Specifically, we wanted to determine whether we could identify regions or individual cells in higher-order centres that exhibit distinct and robust activity signatures for specific types of locomotor behaviours or during specific phases of a motor programme.
The larval CNS produced multiple types of segmentally coordinated motor activity. We decided to focus on forward and backward fictive crawling as they have the clearest relation to larval behaviour. To automatically detect and distinguish forward
and backward waves, we used principal component analysis
(PCA) for dimensionality reduction of DF/F signals extracted
from abdominal neuropil regions (Fig. 3i). Based on features of these trajectories through PCA space, we systematically extracted event times for forward and backward waves in each experiment (see Fig. 3j, Methods section and Supplementary Data 2). By generating manual ground truth annotations for two complete data sets, we determined that our computational module for detecting and classifying motor activity produced, on average, Lateral view
Dorsal view
3.8
0.4
t0(0 s) t139(27.8 s) t143(28.6 s) t146(29.2 s) t151(30.2 s) t316(63.2 s)
BL
SOG
ABD TH
BL
SOG
ABD TH a
Anatomy
b
ROI 4
ROI 3
ROI 2 ROI 1
4.0 0.7
2.1 0.2 2
3
4
t7
t18
t64
t117 t355
t1 t95 t176 t330
t304
t286
t184 t286 t319 t385
t203 t46 t81 t127 t179
2.4 0.3
t70 t77 t80 t89 t95 t127 t138 t145 t151 t175
1.8 0.6 1
Δ
F
/
F
[image:5.595.89.514.51.519.2]ΔF/F only
Figure 2 | Whole-CNS functional imaging of the isolatedDrosophilalarval nervous system.(a) Whole-CNS functional imaging at 5 Hz of aDrosophila
third instar larval CNS expressing 57C10-GAL4,UAS-GCaMP6s, using hs-SiMView light-sheet microscopy. Imaging was performed with one-photon excitation at 488 nm, maintaining a constant imaging speed of 370 frames per second (491 MB per second) for a period of 1 h. Image panels show maximum-intensity projections ofDF/F(colour look-up-table) and CNS anatomy (grey, gamma-corrected GCaMP6s baseline fluorescence) from dorsal (top) and lateral (bottom) views, for six time points during a backward locomotor sequence. Outline indicates CNS boundary. Longer image
94.5% correctly classified hits and 5.5% false alarms (n¼152; see Methods section). We then used these event times as triggers and computed a mapping of activity timing to locations in the entire CNS for all data sets (see Methods section). This analysis uses machine learning to compute, on a voxel-by-voxel basis, the improvement in fit of a time-locked activity model over a flat response model during network events (Fig. 4a and Supplementary Data 2). On an intuitive level, this method provides a measure, per voxel, of when and to what extent activity increases in the locomotor event window. Such voxel-level information represents a useful complement to analyses based on annotated and segmented structures (presented in the next
section), especially when manually vetted annotation is difficult owing to the scale or complexity of the data, and when neuronal response properties need to be mapped across diverse neuronal morphologies.
We used this activity timing analysis to first examine how activity propagates through the entire volume of the larval CNS during forward and backward fictive crawling. By plotting only the timing information provided by this analysis, activity progression can be charted and easily followed through the larval CNS through a large dynamic range of local changes in activity (Fig. 4b,c). Previous anatomical work has determined that dorsal regions of the larval VNC contain primarily motor neurons and
Forward waves PC1
PC2
A2 A3
A4 A5
A6 A7
A8 A1
Backward waves j i
a
A1
Left Right
A8 b
10 s
30% ΔF/F
30% ΔF/F
Forward wave Backward wave
Backward Backward
Linear fit
Amp
Phase
Forward
Amp
Phase
Start
Backward Backward Forward
Backward embedded Backward not embedded
f
d
e
A1
A8 c
A1
A8
Forward not embedded
Forward embedded
A1
A8
A1
A8
5 s
h Backward waves
Wave frequency (Hz)
0.03
0.02
0.01
0 Wave duration (s) 15
12
9
6
3
0
NE E NE E
Forward waves g
Wave frequency (Hz)
0.03
0.02
0.01
0 Wave duration (s) 15
12
9
6
3
0
[image:6.595.116.479.50.457.2]NE E NE E
Figure 3 | Fictive locomotion in theDrosophilalarval CNS.(a) Neural activity in all VNC hemisegments was captured using 16 3D ROIs. Segments are
premotor circuitry, whereas ventral regions of the VNC contain primarily sensory terminals and interneurons involved in
sensory processing31,32. Given this anatomical organization, we
predicted that waves of activity would be most prominent and wave propagation would be fastest in the dorsal regions of the larval VNC. Indeed, wave propagation during both forward and backward waves was faster in dorsal regions versus ventral regions (Fig. 4b and Supplementary Movies 9 and 10): during forward waves, propagation of peak activity from segments 8 to 3 was 29% faster dorsally versus ventrally (speed measured from
median activity timing ofn¼30 waves); during backward waves,
propagation of peak activity from abdominal segments 1 to 6 was
60% faster dorsally versus ventrally (n¼70 waves). Moreover,
during forward waves, peaks in dorsal regions significantly preceded those in ventral regions in all abdominal segments
(Po105, sign test, n¼30 per segment); during backward
waves, peaks in dorsal regions significantly preceded those in
ventral regions in abdominal segments 8 through 3 (Po1013
for all segments, sign test, n¼70 per segment), whereas activity
timing for the first two segments was indistinguishable in dorsal and ventral regions. Increase in activity in dorsal regions was
higher than in VNC regions by a factor of 3.9±1.1 during
forward waves (mean±s.d.,n¼227) and by a factor of 3.1±1.2
during backward waves (mean±s.d.,n¼495).
Interestingly, as activity propagated forward through the VNC, activity also propagated from the SOG to the dorsal-most regions of the brain (Fig. 4b,c, left panels; Supplementary Movie 9). Statistical comparison of activity peak times confirmed that peaks in SOG regions significantly preceded those in ventro–caudal
brain lobe regions (Po0.001, sign test, n¼30), which in turn
significantly preceded those in dorsal brain lobe regions (Po0.001, sign test,n¼30).
Our timing analysis also revealed local hot spots with distinct activity patterns, in particular, in the thorax and SOG (Fig. 4c and Supplementary Movies 9 and 10). In order to resolve the fine temporal structure of activity in these regions of interest (ROIs), we extracted fluorescence traces from 24 ROIs within the thorax, SOG and brain lobes that corresponded to boundaries and distinct regions in the activity timing maps (Fig. 4d,e). Peak activity in ROIs corresponded to average timing assignments in the voxel map with a precision exceeding the temporal sampling
of the image data (0.15±0.14 s, mean±s.d.,n¼47), confirming
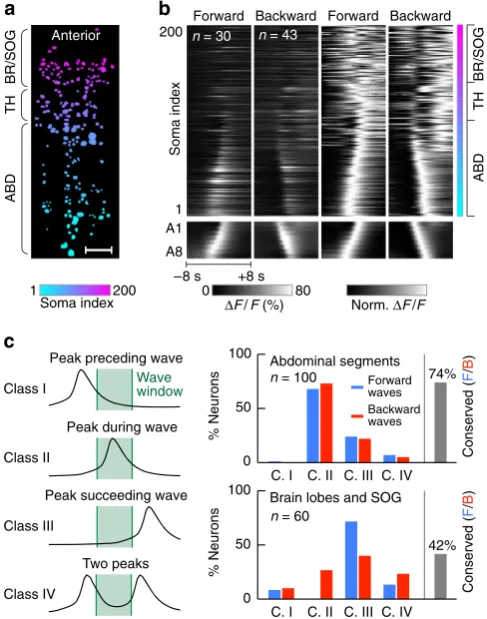
that our activity timing maps provided accurate information on relative timing of events in different parts of the larval CNS not only at the voxel level but also at a regional level. Across our set of ROI annotations, we found bilaterally symmetric sites with activity peaks occurring during initiation (before peak in leading abdominal segment), execution (between A1 and A8 peaks) and/ or termination (after peak in final abdominal segment) phases of locomotor waves. Activity in SOG ROIs 1–5 (L/R) peaked during the execution phase of forward waves and was maximally suppressed during the execution phase of backward waves. Activity in thoracic ROIs 6–7 (L/R) was bimodal during backward waves, with peaks occurring during initiation and termination phases. Activity in thoracic ROIs 8–10 (L/R) peaked during execution phases of both forward and backward waves. Activity in brain ROIs 11–12 (L/R) was strikingly different during forward and backward waves: activity peaked during the termination phase of forward waves, whereas bimodal activity with peaks during initiation and termination phases was observed for backward waves (Fig. 4e).
Large-scale profiling of single-neuron activity during behaviours. After mapping information flow through the CNS during forward and backward waves at a coarse level, we examined activity patterns
at the level of individual neurons during these two fictive behaviours. We identified and annotated cell body locations in two preparations imaged with one-photon hs-SiMView (Fig. 5) and two-photon hs-SiMView (Supplementary Fig. 7), respectively.
During forward waves (Fig. 5b,c), most annotated cells in the VNC reached peak activity during wave propagation (defined as the time interval marked by peak activity in abdominal segments 1 and 8): 73% of neurons reached peak activity during wave propagation, whereas 22% reached peak activity after the end of
wave propagation (n¼100). A small fraction (5%) of neurons
showed two activity peaks separated by a period of quiescence as forward waves propagated through abdominal segments. In the SOG and brain lobes, activity patterns were more diverse, with a large number of cells becoming active at various phases of the motor programme: 10% of neurons reached peak activity before the start of wave propagation, 27% during wave propagation and 40% after the end of wave propagation
(n¼60). Interestingly, a relatively large fraction of annotated
neurons in SOG and brain lobes (23%) showed two activity peaks separated by a period of quiescence as forward waves propagated through abdominal segments.
During backward waves (Fig. 5b,c), neurons in the VNC were largely active with locomotor waves in phase relationships similar to those observed for forward waves: 68% of neurons reached peak activity during wave propagation, 24% after the end of wave propagation and 7% showed two activity peaks separated by a period of quiescence during wave propagation
(n¼100). In contrast, in the SOG and brain lobes, activity
patterns were quite distinct from those observed during forward waves: the vast majority of cells (72%) were active after the end of the backward wave propagation, and 8% of cells were active
before the initiation of the backward wave (n¼60). Thirteen per
cent of neurons showed two activity peaks separated by a period of quiescence as the backward wave propagated through abdominal segments.
A comparison of the classification of peak activity in each neuron during forward and backward waves (Fig. 5c) revealed conserved activity signatures for in total 74% of annotated
neurons in abdominal segments (n¼100) and 42% of annotated
neurons in the brain lobes and SOG (n¼60).
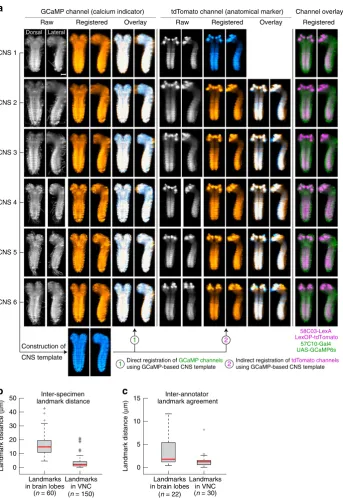
Neurons in the brain identify type and state of motor programs. Our initial mapping of activity timing throughout the CNS identified small regions within the SOG that showed activity that was strongly synchronized with activity in distant abdominal regions. Closer examination revealed that these regions were often identifiable as cell bodies. However, variations in CNS orientation and shape across preparations made it difficult to assay whether the locations of cell bodies were conserved from animal to animal. To address this problem, we constructed a global CNS anatomy template using GCaMP image data obtained from six nervous systems, following the symmetric group-wise normalization
approach (SyGN)30, and registered all image data and activity
timing maps to this template using B-spline diffeomorphic
registration32(see Fig. 6a and Methods section). We used several
orthogonal approaches to determine registration accuracy (see Methods section). The average volume overlap between registered, individual nervous systems and global template was
95.2±1.1 % (mean±s.d., n¼6). The average distance between
corresponding, manually annotated landmarks in the registered
nervous systems was 4.5±5.9mm (mean±s.d., n¼150) for
landmarks in the VNC and 16.3±8.6mm (mean±s.d., n¼60)
for landmarks in the brain (Fig. 6b,c).
In three spatially registered nervous systems that each yielded
identified four neurons located ventro-laterally on either side of the SOG with interesting features; across the three preparations, these neurons had highly conserved cell body positions (with
an average pairwise distance of 13.8±5.8mm across preparations,
mean±s.d., n¼24 cell pairs; Fig. 7a–c), strong bilateral
symmetry and distinct patterns of activity timing (Fig. 7d–f). Type 1 neurons were located in the posterior SOG (Fig. 7d). During forward waves, their activity slowly ramped up over a period of several seconds then peaked shortly after the wave had passed the first abdominal segment, marking the end of forward
wave propagation (Po107, sign test,n¼60). During backward
waves, activity in these cells slowly ramped up, at a rate similar to their initial behaviour during forward waves, but activity then
remained elevated forB5 s following the termination of the wave
(Fig. 7e).
Activity in type 2 and 3 neurons during forward waves was similar to that observed in type 1 neurons; however, during backward waves, activity slowly decreased over a period of several seconds, then rebounded after the locomotor wave had passed the
first three abdominal segments (Po1011, sign test, n¼264;
Fig. 7e).
Activity in type 4 neurons during forward waves ramped up and peaked when the wave reached abdominal segment A6
(Po105, sign test, n¼60), then quickly decreased and
rebounded when the wave had passed the first abdominal
segment (Po1012, sign test, n¼60). During backward waves,
activity in type 4 neurons largely tracked activity observed in abdominal segment A8 (Fig. 7e).
Similar results were obtained in corresponding cell body pairs during forward waves in two other preparations (Fig. 7f). Each cell showed robust, reproducible responses over multiple trials and was information-rich in that the dynamics of activity within each cell reflected both the direction and progression of locomotor waves through the VNC (Fig. 7e,f).
Discussion
The imaging framework described here represents the first method capable of recording neural activity at near cellular resolution throughout the CNS of a higher invertebrate. By
applying this framework to theDrosophilalarval CNS, we found
that representations of fictive locomotor activity are present in presumed higher-order centres at both a regional level and at the level of individual neurons, and that these representations change depending on the mode of fictive locomotion.
At the foundation of our approach is our new hs-SiMView multi-view light-sheet microscope capable of high-speed func-tional imaging with one- or two-photon excitation. Whole-CNS
calcium imaging in a nervous system as large as that of
Drosophila critically required the design of a microscope with substantially improved temporal resolution, from tens of seconds offered by state-of-the-art multi-view light-sheet microscopy to a few tenths of seconds achieved in hs-SiMView. To enable the reproduction of the imaging technology presented here, we provide detailed technical drawings for all critical custom parts of the hs-SiMView microscope (Supplementary Data 1). From a technical perspective, we found that multi-view imaging at high spatiotemporal resolution is crucial to capture the propagation of
activity through the entireDrosophilaCNS and to systematically
identify individual neurons with distinct activity patterns during fictive behaviours. At the same time, the low light exposure and long-term imaging capability provided by our method are essential to collect enough data from a single specimen to build statistically meaningful whole-CNS activity maps. When comparing whole-CNS functional imaging with one-photon and two-photon excitation, we found that the former approach offers superior imaging speed and experiment length (Supplementary Fig. 8), whereas the latter offers superior signal-to-background levels and thereby simplifies large-scale identification of cell bodies (Supplementary Fig. 7).
In order to use this imaging technique to study neural network dynamics at the scale of the entire CNS, we developed a suite of computational tools. In previous work, we and others devised tools for the analysis of large-scale functional imaging data7,8,16,33–35. Here, we explored several new directions essential to tackle the challenges encountered when analysing multi-view calcium imaging data in general and motor activity at the scale of an entire CNS in particular. We present approaches for processing and management of multi-view calcium imaging data recorded with hs-SiMView microscopy, automated detection of coordinated motor activity and high-resolution mapping of functional relationships across the CNS during fictive motor behaviours. The methods facilitate efficient processing and analysis of multi-terabyte hs-SiMView image data sets on a single computer workstation. At the same time, many of our tools are also capable of leveraging the strengths of computer clusters, for example, for rapid exploration, screening and comparison of different data processing strategies. Our software modules, including open source code and a software user guide, are provided as Supplementary Data 2.
The overall strength of our combined experimental/
computational approach is that it enables the simultaneous, unbiased examination of activity relationships among disparate but functionally connected CNS regions. Thereby, whole-CNS activity patterns are mapped in a single preparation, providing information on multiple fictive behaviours and with cellular
resolution for a large fraction of the CNS. In order to identify anatomical regions and individual neurons with conserved activity patterns from these whole-CNS activity maps, we furthermore took advantage of methods for spatial registration
of neural tissues30,32. By combining nonlinear image registration
techniques with independent genetic expression systems in
Drosophila, we implemented and validated a strategy for the quantitative comparison of whole-CNS activity maps across multiple nervous systems. This approach is robust even in the face of relatively large disparities in tissue size, orientation and topology, and may therefore present a useful strategy that could be applied to other animal models as well.
Ventral Dorsal
Forward waves Backward waves Forward waves Backward waves
1 s 10%
Δ
F
/
F
1 s 20%
1 s
30%
1 s
5%
1 s
50%
1L 1R 2L 3L
4L 2R
3R
4R 5L 5R
6L 6R 7L 7R
8L 9L 8R9R
10L 10R 11L 11R
12L/R
2L 3L
4L 5L 6L
7L
8L
A1 A2
... A8 1L
A3 A4 9L 10L
11L 12L
2R 3R
4R 5R 6R
7R
8R
A1 A2
... A8 1R
A3 A4 9R 10R
11R 12R d
e
Brain/SOG
Brain lobes
TH
ABD
SOG BL
Forward waves Backward waves
Left SOG BL
TH ABD
Right1 2 3 4 5 6
7
1 2 3 4 5 6 7
5 4 3 2 1
5 4 3 1 2
Δ
F
/
F
(%)
0 40 80 120
Time relative to wave detection (s)
–6 –4 –2 0 2 4 6
Time (s)
–10 +10
n = 30 n = 66 n = 30 n = 66 Time (s)
–10 +10
Time (s) –6 +2
Brain/SOG Brain lobes
Ventral Dorsal
Forward waves Backward waves
b a
c
Individual traces Fit given time Mean Flat fit
We used our method to chart activity within the entire
Drosophilalarval CNS during multiple fictive behaviours. At the regional scale, as activity progressed from abdominal to lateral thoracic regions during forward waves, activity also progressed from the SOG to the dorsal-most brain regions. These results suggest that at a regional level, spatiotemporal gradients of activity correlated with directional motor patterns may be present
in the larval brain. To our knowledge, no previous studies have demonstrated this phenomenon in the CNS of an invertebrate.
Large areas of the larval SOG appear to be active during the initiation phase of forward waves. In contrast, dorsal areas of the brain become active during the termination phase of forward waves. This raises the possibility that the SOG as a region may play a role in the initiation or monitoring of forward locomotion, whereas dorsal brain regions may play a role in its termination. At a coarse spatial level, activity in the SOG did appear to have distinct overall timing relationships relative to other CNS regions. It is important to note, however, that local regions within the SOG showed very strong but heterogeneous activity patterns during motor programs; likewise, thoracic regions also contained several such ‘hot spots’. Based on their distinct timing relationship with the motor programs, some of these regions could be involved in the initiation, termination and/or
monitoring of motor activity36,37. Interestingly, these results
also make specific predictions about long-range coarse
connectivity between CNS regions. Two testable hypotheses for future study are that strong functional connections exist between the larval SOG and posterior abdominal segments and between dorsal regions of the brain and lateral thoracic regions.
Our analyses were also able to identify single neurons within the SOG exhibiting patterns of activity that, to varying degrees, were representative of the type and temporal state of motor programs. Neurons that encode features of motor behaviours (that is, velocity and acceleration of limbs, as well as activation of muscles) have been identified in motor control centres of the
vertebrate brain38. Descending neurons in the SOG of the leech,
Hirudo medicinalis, also exhibit patterns of activity that reflect distinct behavioural states (for example, crawling). When stimulated, these neurons trigger changes in body posture and
behavioural state39; however, behavioural choice in the leech
appears to result from both dynamics of neuronal populations and the actions of a select few neurons that can strongly influence
decision making40. The variety of candidate neurons, SOG
regions and brain lobe areas with network state-related activity profiles discovered in our systematic search may thus provide a foundation for future functional studies aimed at understanding how the larval CNS generates and selects between distinct motor patterns.
InDrosophilalarvae, a coordinated effort aimed at constructing
a complete connectome is currently underway41, and the exciting
prospect of coupling imaging-based identification of candidate neurons, and whole-CNS imaging in general, to connectomics data is thus on the immediate horizon. Integrating the circuit maps resulting from this work with the functional
imaging assay presented here may allow for detailed
examination of how behaviour is produced as a function of both neural network architecture and dynamics of activity within interconnected neurons.
Two complementary directions for further research are centred on technology development. On the one hand, further improvement of spatial resolution will generally be desirable, in particular, in applications that require comprehensive single-cell coverage throughout the third instar larval CNS. Possible strategies to this end include the integration of wide-field
adaptive optics in the microscope’s detection arms42, and
automated, adaptive rotation and translation of light sheets to compensate for local specimen-induced light refraction in the
illumination process43. Moreover, dual use of the microscope’s
four optical arms for light-sheet illumination as well as fluorescence detection may present a very effective approach to
improve axial resolution44, and could even enable the
development of large-scale functional imaging assays with isotropic spatial resolution in the future. On the other hand, to
ABD
BR/SOG
TH
a Forward Backward Forward Backward
Soma index
A1
A8 200
1
ΔF/F (%) 0
Norm. ΔF/F
–8 s +8 s
ABD
b
80
n = 43
n = 30
TH
BR/SOG
Anterior
Soma index200
1
Peak preceding wave
Peak during wave
Peak succeeding wave
Two peaks Class I
Class II
Class III
Class IV
Wave window
Abdominal segments
Brain lobes and SOG
C. I C. II C. III C. IV
C. I C. II C. III C. IV
% Neurons
%
Neurons
100
50
0
100
50
0
Conserved (
F
/
B
)
Conserved (
F
/
B
)
Forward waves Backward waves
74%
42% c
n = 100
[image:10.595.45.289.52.362.2]n = 60
Figure 5 | Large-scale profiling of single-neuron activity traces during
locomotor behaviours.(a) Projection of manually annotated 3D somatic
ROIs across the CNS used for extracting signals at the single-neuron level (n¼200). (b) Neuronal activity, averaged across all detected wave time windows. From left to right: rawDF/Ffor forward waves, rawDF/Ffor backward waves, normalized (Norm.)DF/Ffor forward waves, normalized
57C10-Gal4 UAS-GCaMP6s
58C03-LexA LexOP-tdTomato
CNS template CNS 1
CNS 2
CNS 3
CNS 4
CNS 5
CNS 6
Construction of
Direct registration ofGCaMP channels using GCaMP-based CNS template a
Dorsal Lateral
1 2
Indirect registration oftdTomato channels
using GCaMP-based CNS template 2
1
Landmark distance (
μ
m)
Landmark distance (
μ
m)
50 40 30
0
Landmarks in brain lobes
(n = 60) (n = 150) (n = 22) (n = 30) 20
10
Landmarks in VNC
15 10 5 0
Landmarks in brain lobes
Landmarks in VNC
b Inter-annotator landmark agreement
c
Inter-specimen landmark distance
[image:11.595.127.471.48.547.2]GCaMP channel (calcium indicator) tdTomato channel (anatomical marker) Channel overlay Raw Registered Overlay Raw Registered Overlay Registered
Figure 6 | Spatial registration of nervous systems.(a) All CNS explants used for functional imaging expressed GCaMP panneuronally
(57C10-GAL4,UAS-GCaMP6s) and tdTomato in anatomically defined regions within the larval CNS (58B03-LexA,LexOP-tdTomato; expression in mushroom bodies and neuropil regions). Columns 1–3 show maximum-intensity projections of unregistered GCaMP images (column 1), spatially registered GCaMP images (column 2) and respective overlays (column 3) for six differentDrosophilathird instar larval CNS explants. To register nervous systems, we first constructed a CNS template (shown at the bottom of column 2) from GCaMP reference image stacks representing each of the six independent time-lapse experiments (see Methods section). We then registered image data from each experiment to the CNS reference template using nonlinear spatial registration techniques (see Methods section). Overlays of registered image stacks (orange) and CNS reference template (blue) in column 3 show good anatomical
3b
3a
2a 2b
1b 1a
4a 4b
1b 2a 2b 3a 3b 4a 4b A1 A2 ... A8 1a
Forward waves (CNS 1) Backward waves (CNS 1)
A1
A2
A3
A4
A5 A6
A7
1 s
10%
1 s
50%
n = 66
n = 30
CNS 1
A8
2a,b 4a,b
A8 1a,b 3a,b
1 s 20%
Δ
F
/
F
1 s
50%
1 s 10%
Δ
F/F
1 s
50%
Forward waves (CNS 2)
n = 105
Forward waves (CNS 3)
n = 44
1 s
10%
1 s 10%
Δ
F
/
F
A3
... A1 Contrast-enhanced activity timing map
Whole-CNS activity timing map
CNS 1
CNS 2
CNS 3
Registered brain segmentation maps
Lateral (xz)
Multi-CNS segmentation overlay
Norm. time
CNS 1 CNS 2
CNS 3
1b 1a
3b 3a
2a 2b
4a 4b
a b c
f CNS 1
Dorsal Lateral Dorsal Lateral
Dorsal
Dorsal (xy)
n = 30
n = 105
n = 44
n = 30
SOG
SOG
BL
[image:12.595.92.505.49.562.2]e d
make the most of this new technology, it will be important to also develop strategies for imaging activity in large neural networks simultaneously with optogenetic manipulation. Thereby, the functional role of individual neurons could be investigated in the network context. Moreover, functional imaging assays could be further enriched by taking advantage of advances in voltage
indicators45, availability of multiple independent genetic
expression systems46–49 and the wealth of cell-type specific
driver lines that are becoming available forDrosophila18,19.
The method presented here for the isolated larval CNS can be readily adapted to other developmental stages, including
Drosophila pupae and adults, and may also be suitable for
in vivo whole-animal functional imaging ofDrosophilaembryos and first instar larvae. We note that this latter approach introduces new challenges in the domain of image processing and data analysis, and will greatly benefit from the development of spatial registration techniques for moving specimens and specimens with dynamically changing topologies. Our hs-SiMView microscope and computational image analysis framework should also be suitable for the study of other biological model organisms. Possible models include not only other invertebrates with a compact CNS but also vertebrates, such as zebrafish embryos and larvae, that benefit greatly from
multi-view imaging with light-sheet microscopy25, as well as partial
CNS explants of animal models with larger nervous systems. The main limitation of our imaging technique concerns sample size, which is constrained by the travel range of the piezo stages and the need for optical access to the sample from multiple directions.
The maximum volume accessible with the microscope
configuration presented here is 800800250mm3. Larger
volumes can be covered by simply switching to different detection objectives and piezo stages with longer travel range;
for example, using C-Apochromat 10/0.45 objectives (Carl
Zeiss) in combination with P-629.1CD Hera piezo stages (Physik Instrumente, Karlsruhe) the multi-view imaging volume can be
increased to 1,3001,3001,500mm3. The considerably larger
field-of-view of this modified microscope design comes at the expense of imaging speed, which is reduced as a result of the lower stiffness of the piezo stages.
It is becoming increasingly clear that to understand how neuronal networks function, it is important to measure neuronal
network activity at the system level14,33. Our method enables, for
the first time, the imaging of activity within the entire CNS of a widely used genetically tractable model organism as it generates multiple fictive behaviours. This work not only opens the door to
large-scale circuit analyses in Drosophila in particular but also
lays the foundation for a wider set of future studies by providing an integrated strategy for large-scale functional imaging and analysis of neural activity.
Methods
Genetic constructs and transgenic lines.In live imaging experiments for spatial resolution estimation, a genetic construct in which the histone-2Av gene was fused to the gene encoding enhanced green fluorescent protein was used to fluorescently label the nuclei of all larval cells. In all calcium imaging experiments, the GAL4-UAS system48was used to drive expression of the genetically encoded calcium
indicator1GCaMP6s. In previous work, a fragment of the promoter for the gene
encoding the synaptic protein synaptobrevin was used to create a GAL4 line with panneuronal expression18. This GAL4 line (57C10-GAL4) was used to drive expression of GCaMP6s. The LexA-LexOP system49was used to independently
drive expression of the red fluorophore tdTomato in anatomically defined regions within the larval CNS. The LexA line (58B03) drove expression in the larval mushroom bodies as well as neuropil regions in the larval CNS.
Animal care and sample preparation.Fly larvae were raised on standard corn-meal-based food. First, second and third instar animals were selected for use in live imaging experiments for spatial resolution estimation. Feeding third instar animals were used for all calcium imaging experiments. In all experiments, individual larvae
were dissected in physiological saline containing (in mM) NaCl (135), KCl (5), CaCl2(2), MgCl2 (4), TES (5) and sucrose (36). After being pinned dorsal side up
in Sylgard-lined Petri dishes, a dorsal incision was made along the larval body with fine scissors. The body wall was pinned flat and internal organs were removed. The isolatedDrosophilaCNS was then dissected away and embedded in 1% low-melting temperature agarose in physiological saline at 36°C. The agarose containing the CNS was drawn into a glass capillary with 1.4 mm inner diameter and 2.0 mm outer diameter, where the agarose quickly cooled to room temperature, forming a soft gel. The agarose cylinder was extruded from the capillary so that the CNS was optically accessible outside of the glass.
Wide-field fluorescence imaging.Using wide-field fluorescence microscopy, activity patterns in isolated nervous systems embedded in agarose and physiological saline were compared with activity patterns in isolated nervous systems exposed only to physiological saline. Preparations were imaged on an Olympus BX51wi upright compound microscope (Olympus, Center Valley, PA) equipped with an OptoLED light source (Cairn Research, Kent, UK) and an Andor DU897 EMCCD camera (Andor Technologies, Belfast, UK). Images were captured at 10 Hz using Andor IQ software and analysed using custom scripts in Matlab (MathWorks, Natick, MA).
Light-sheet microscope for multi-view functional imaging.We used the con-ceptual optical arrangement underlying SiMView light-sheet microscopy22as a starting point for designing our high-speed microscope for multi-view functional imaging with one-photon and two-photon excitation (Supplementary Fig. 2). The realization of whole-CNS multi-view functional imaging experiments at up to 5 Hz (capturing 10 sample volumes per second, with up to 40 images per volume) is the result of four essential advances of the overall design, hardware and software of this earlier microscope, which was capable of multi-view imaging only at up to 0.04 Hz (capturing 0.16 sample volumes per second, with up to 100 images per volume).
First, and in contrast to single-view functional imaging7, multi-view volumetric
imaging using piezo positioning of the microscope’s detection objectives requires a finely adjustable (micrometre precision) and highly robust (multi-day operation of the imaging system) mechanical solution for relative position and orientation alignment of the detection piezos as well as for optimally matching piezo scan ranges to maximize the microscope’s shared multi-view volumetric imaging range. We developed a custom two-part mechanical objective positioning system that serves (1) as an adjustable adapter between detection objectives and the piezo stages and (2) as an adjustable base for mounting piezo stages on the optical table (Fig. 1b,c and Supplementary Fig. 2). Technical drawings of these custom parts are provided as Supplementary Data 1. Our custom positioning and rotation adjustment system provides micrometre precision for four key degrees of freedom:
x-y-z-translation of the detection objective and rotation of the piezo base around
the normal vector to the optical table. The custom flexures are manufactured from aluminium and designed to minimize mass and maximize stiffness resulting in minimal added load on the piezo stage (thus optimizing speed). They-translation,
z-translation and rotation degrees of freedom are incorporated in a highly dimensionally stable stainless steel base and are facilitated by low-friction jewel-bearing guides. Precise movement is achieved through (1) two differentially adjustable sapphire-tipped micrometres opposing a ruby-tipped spring mechanism fory-translation and rotation adjustment, and (2) a micrometre-positioned low-friction ceramic wedge forz-translation. Thex-translation degree of freedom is incorporated in the flexure using a precision adjustment screw opposing both gravity and a spring preload, and a highly robust one-piece aluminium frame manufactured by wire electrical discharge machining designed to minimize tilt of the optical axis resulting from the objective’s weight distribution. Together, these parts allow fine-tuning of the relative position and orientation of the microscope’s four objectives with micrometre precision. The ability to perfectly match the limited scan range (250mm) of fast piezo stages with high stiffness is furthermore crucial to maximize the sample volume that can be simultaneously imaged in both detection systems. High-speed imaging with these piezo-stage detection arrangements also requires an imaging chamber design that supports fast synchronized movements of multiple detection objectives while maintaining integrity of the water seal at all objective ports. To this end, we designed a specimen chamber with high-precision custom-moulded silicone rubber seals. These silicone seals are sufficiently thin and flexible to allow unimpeded rapid objective movement across the 250-mm piezo travel range while protecting the objective ports from leakage of the physiological saline.
Second, and in contrast to imaging experiments with transparent samples7,
associated with a unique set of core alignment parameters (specifically, offsets of the two light sheets and positions of the two detection piezos) such that focal shifts resulting from the sample’s refractive index distribution and light-sheet refraction resulting from refractive index mismatches at the buffer-to-agarose and agarose-to-sample interfaces are mitigated through a locally adaptive microscope alignment. The microscope’s electronics framework has furthermore been extended to compensate for the differences in piezo response behaviour in a high-speed imaging setting at the limit of the piezos’ operating regime. In this high-speed regime, position-versus-voltage vectors vary from one piezo to the next and are furthermore affected by each unit’s individual tuning (for achieving maximum speed while minimizing positional fluctuations and time-consuming over-/ undershoots at the end points of the volumetric scan range). These differences in response behaviour were measured using an oscilloscope, and compensatory adjustments of each unit’s voltage wave forms were introduced through the microscope’s control framework.
Third, we improved the electronics framework and developed a new microscope control software and image acquisition workflow for piezo-based multi-view imaging, enabling high-speed data acquisition at sustained rates of 370 images per second and data streams of up to 1,000 MB per second. Image data are furthermore streamed in a header-less binary format to a high-performance RAID system. These improvements, together with the changes outlined above, lead to an increase of volumetric imaging speed from 0.8 to 5 Hz, while additionally providing twice as many view angles of the sample. These advances are crucial to match imaging speed to the timescales of activity inDrosophilalarval motor circuits and to achieve good physical coverage of the strongly light-scatteringDrosophilaCNS at the same time.
Fourth, we developed a multi-view functional imaging assay using two-photon excitation, which complements the high-speed imaging mode using one-photon excitation. In this two-photon mode, the microscope offers a maximum volumetric imaging speed of 2 Hz for the entireDrosophilaCNS at high signal-to-noise ratio (Supplementary Movies 3–5), although higher speeds are in principle possible (up to 5 Hz) if the respective reduction in signal-to-noise ratio is acceptable. The primary advantages of the two-photon imaging mode are an improvement in signal-to-background ratio and the shift in illumination wavelength from 488 to 940 nm, at which biological tissues generally appear more transparent. In addition, two-photon excitation may be helpful in applications involving concurrent use of genetically encoded calcium indicators and optogenetic effectors.
For detailed information about the components of the hs-SiMView light-sheet microscopy, please see Supplementary Methods.
High-speed volumetric functional imaging.For volumetric calcium imaging of
theD. melanogasterlarval CNS with light-sheet microscopy, the agarose-embedded
larval CNS was transferred to the saline-filled imaging chamber and positioned and oriented using a four-axis mechanical stage that held the specimen stationary in front of the four objectives (Supplementary Fig. 2). The detection arms of the multi-view light-sheet microscope were configured with Nikon16/0.8 numerical aperture (NA) water immersion objectives with a working distance of 3 mm. The objectives were positioned with PI Hera piezoelectric nano-positioners with a 250-mm travel range (Physik Instrumente). For one-photon excitation, the specimen was illuminated with two scanned light sheets at 488 nm, focused by Olympus4/0.28 NA air illumination objectives through custom-designed curved glass windows on the sides of the specimen chamber. At the waist of the light sheet, its thickness was set to 1.5mm, and the thickness diverged to 3.0mm in the most remote locations of the field-of-view corresponding to the lateral edges of the specimen (Supplementary Fig. 3). For two-photon excitation, the specimen was illuminated with scanned light sheets at 940 nm, using Nikon 10/0.3 NA water-dipping illumination objectives. The light sheets were aligned with the focal planes of the two detection objectives, allowing the two sCMOS cameras to simultaneously obtain images of the illuminated plane of the specimen.
For detailed information about hs-SiMView light-sheet microscope configuration and operation for all high-speed volumetric functional imaging experiments, please see Supplementary Methods.
Spatial resolution analysis.To quantitatively assess spatial resolution as a function of the spatial location within the specimen, we imaged nervous systems of first, second and third instar animals with a ubiquitous nuclear label (w; His2Av-enhanced green fluorescent protein; þ), using the same microscope configuration as for imaging the GCaMP6s expressing nervous systems. By labelling all cell nuclei in the animal, the nuclear marker effectively provided blob-like targets suitable for lateral and axial resolution measurements throughout all non-neuropil regions of the CNS, and thus allowed us to estimate spatial resolutionin situunder relevant experimental conditions. Volumetric imaging was performed with an axial step size of 2.0mm. Three-dimensional spatial resolution maps were then computationally reconstructed from the volumetric images using the automated procedure descri-bed in the Supplementary Methods.
Multi-view fusion, processing of calcium imaging data and hs-SiMView data management.We developed a computational pipeline for efficient processing and management of large-scale hs-SiMView image data sets using Matlab (MathWorks, Inc.). All software modules follow a memory-efficient design and take full
advantage of multi-core processing architectures, so that typical terabyte-scale hs-SiMView data sets can be rapidly processed on a single computer workstation. By modelling the 3D geometry of the specimen from raw images, image data were first separated into foreground and background voxels. In order to maximize processing performance throughout the computational framework and reduce data size410-fold, background voxels were discarded and foreground voxels were compressed using our custom block-based lossless compression file format. Multi-view fusion of functional imaging data recorded with the hs-SiMView microscope’s two sCMOS cameras was performed by (1) aligning image fore-ground in multi-view image stacks using a rigid transformation (to correct for physical mismatch of the two cameras22), and (2) blending the image content by using the geometrical model of the specimen to determine which camera view provided the, respectively, shortest detection path length for each voxel. This procedure ensured that the final image stacks contained the highest-quality image content from each camera view. The image stacks of each time-lapse experiment were subsequently spatially registered to the image stack acquired at the midpoint of the respective time-lapse recording to correct for specimen drift during the recording. 25-percentile (one-photon imaging) and 10-percentile
(two-photon imaging) intensity levels were computed in a 70-time point sliding window throughout each time-lapse data set. The resulting reference stacks were used as a baseline for calculatingDF/Ffor every voxel in the time-lapse data set. All of our software, including source code for high-speed lossless hs-SiMView data compression, multi-view image registration, multi-view image fusion, spatial registration of time-lapse image data andDF/Fcalculation are provided as Supplementary Data 2. This archive also contains a user guide with detailed instructions for using the Matlab code.
Wave detection from ROI time series.To extract basic features of segmentally coordinated activity in isolated preparations, we measured changes in fluorescence within 16 3D ROIs placed within regions that corresponded to abdominal hemisegments (eight left and eight right). Changes in fluorescence (asDF/F) were extracted through spatial averaging within each ROI.
Activity typically alternated between periods of minimal responsiveness, and ‘bouts’ including waves of calcium responses either forward (posterior to anterior) or backward (anterior to posterior). These waves could be identified by examining either movies of activity (Fig. 2 and Supplementary Movies 1–5) or segment traces (for example, Fig. 3a,b). We developed an automated procedure to detect the timing and direction of these waves in a standardized fashion across multiple data sets.
First, the following preprocessing steps were applied to the 16 segment time series. The first 120 s of data were ignored to avoid response non-stationarities at the beginning of the recording. Each time series wasz-scored (subtracting the mean and dividing by the s.d.). The average response across all segments was subtracted from each of the individual time series. This step normalizes for the overall increase in activity across all segments that occurs during waves, and instead highlights relative changes across the different segments. Finally, to focus on symmetric patterns, signals from left and right hemisegments were averaged, yielding eight preprocessed time series.
The detection of waves proceeds in two steps. First, we embed the 8D time series in a 2D space using the singular value decomposition (or PCA). Then, we detect simple features indicative of waves in the resulting 2D space.
More specifically, given a matrixXthat is 8T, whereTis the number of time points, we compute the singular value decomposition as:
USV¼X; ð1Þ
whereUandVare orthogonal matrices containing the left and right singular vectors andSis a diagonal matrix with the singular values. The first two columns of
V,v1andv2, areT1 vectors containing a 2D basis for the data. In the resulting
2D space, we found that waves correspond to rotations away from and back toward the origin; forward and backward waves correspond to rotations in different directions (Fig. 3i,j). Thus, it was natural to use amplitude and phase within this 2D space as a means for detecting the presence and direction of waves. Specifically, we computed the amplitude and phase as:
r¼
ffiffiffiffiffiffiffiffiffiffiffiffiffiffi v2
1þv22
q
ð2Þ
t¼tan1v 2;v1
ð Þ ð3Þ
We detected candidate local peaks in the vectorr(where a local peak is defined as a time point with an amplitude larger than that of its two neighbours, larger than a provided threshold, and separated by at least 3 s). For each candidate peak, we computed the slope of the (unwrapped) phase vectortwithin a window of 2 s. Forward waves were defined as candidate peaks where the slope was positive and greater than a threshold, and backward waves were defined as peaks where the slope was negative and less than a threshold. There are thus only two primary parameters underlying the procedure: a threshold on amplitude, and a threshold on phase slope. Thresholds of 0.04 and 0.125 were found to produce reasonable results across all data sets, and changing these slightly did not qualitatively affect the detection results.