University of Warwick institutional repository: http://go.warwick.ac.uk/wrap
A Thesis Submitted for the Degree of PhD at the University of Warwick
http://go.warwick.ac.uk/wrap/66665
This thesis is made available online and is protected by original copyright. Please scroll down to view the document itself.
Petrol Engine Development Strategy
Executive Summary
Submitted Towards the Award of Doctor of Engineering
A.J.Robinson
.~
March
wJfo"f
Ii~+s
(i
VRAR8U ;
\~
~
Petrol Engine Development Strategy
Synopsis
The automotive industry is becoming more global and cosmopolitan, while the markets are becoming fragmented and differentiated because of the sophistication of the customer. This requires the automotive manufacturers to have a product well suited to these factors more quickly and cheaply, which necessitates the accurate definition of the product. Two European automotive manufacturers NPI processes were studied and this showed that poor performance in the product definition phase was deemed to be a major reason for sub-optimal performance in both companies, even though the approaches were very different. It was therefore decided to develop and apply tools to assist in the development of petrol engines to overcome these deficiencies.
When these shortcomings are considered in the context of petrol engine development it can be seen through examination of the literature and industry that:
• There is no method for the translation of the values of the company or product into tangible engineering terms and in the context of this project, with focus on vehicle and engine performance. This can result in the poor positioning of a vehicle in the market due to inappropriate characteristics
• Having defined the required vehicle performance, it is not possible to demonstrate the feel of the vehicle until the hardware is physically available. This means that often there is a long lead-time between the setting of a target and the concept ratification through driving the new vehicle. This often results in a point of no (or very costly) return very early during the programme.
• Fuel economy is becoming an increasingly significant issue with the introduction of fiscal penalties for poor fuel consumption vehicles. There are currently no processes available for the calculation of steady state or drive cycle fuel economy which allow for the accurate modelling to include combustion, pumping and friction losses, and the control of the engine with the engine management system
To overcome these limitations three main groups of innovative tools/techniques have been developed and applied on new engine and vehicle programmes.
• Marque engineering: a proposal to translate the brand objectives into engineering terms has been developed to a level where the engine torque output can be linked to the product position
• Engine and vehicle performance simulation: a vehicle has been built to demonstrate how a new vehicle/engine will feel to drive by controlling the original engine performance to allow the simulation of the concept engine performance in the concept vehicle. This means it is possible to demonstrate and ratify a given engine/vehicle performance based on experience of the simulated product and to conduct sensitivity studies to discreet aspects of the performance feel of the vehicle • Steady state and drive cycle fuel economy: simulation programs have been written that take the
basic engine efficiency relationships and through manipulation it is possible to determine the exact operating point of the engine, steady state or transient, and then determine the fuel economy. In order to determine the exact operating point it is necessary to consider detailed component data and key calibration data. Therefore it is possible to understand the effects of small changes to engine geometry, components or calibration on the fuel used.
These developed techniques have been compared with traditional methods to determine the benefits in the concept confirmation phase of a new programme. This investigation showed that the reductions in phase duration, resource requirements and cost could be achieved in the order of 49, 27 and 17% respectively. This is coupled with the ability to obtain a more accurate product positioning through the capacity precisely to predict the product attributes.
Acknowledgements
The author would like to acknowledge the assistance from Mr. George Houghton and
Mr. John Houldcroft of Rover Group, and Dr. Ali Veshagh and Dr. Kevin Neailey of
the University of Warwick for their support and guidance throughout this project,
along with a multitude of others from Rover and BMW who provided assistance,
information, guidance and advice.
I also wish to acknowledge the support, help and encouragement from my wife Tara,
and the welcome distraction provided by my children James and Matthew.
Declaration
The contents of this document have not been presented for a previous degree except
Table of Contents
1 INTRODUCTION ...•... 6
2 NEW PRODUCT INTRODUCTION PROCESS ...•... 8
2.1 Product development as a rehearsal for consumption ... 8
2.2 Business impact of NPI ... 10
2.3 NPI in-practice in the automotive industry ... 12
3
IMPORTANCE OF PRODUCT DEFINITION ...13
3.1 Customer attitudes to their cars engine ... 15
4
TRANSLATION OF SUBJECTIVE RATINGS INTO OBJECTIVE ENGINEERING TERMS ••••••••...••••..••••..••••••.•..•..•••.•...••••.•••••••.••••.•.••.••••••..••••.• 174.1 Marque Engineering •••••••••••••••••.••.•.•••••...•••.••••••.•••..•••••••••••••••••.••••.••••••.••••..••.••.••••.••••.••••••••• 18
4.2 Links between vehicle concept and systems: Macro attributes ... 19
4.3 Links systems and components: Micro attributes ... 21
4.4 Kano model .•••••••....••.•••••••••••••••.•.••....•...•••....•.•••••...•.•••••...•••...••••...•...•..•...••..•••••..•. 22
4.5 Application of the results from a Kano model ... 24
4.6 SUlDDIBry ••••••••••••••••••••••••••••••••••••••••••••••••••••••••••••••••••••••••••••••••••••••••••••••••••••••••••••••••••••••••••••••• 26 5 DEMONSTRATION OF ENGINE PERFORMANCE ... 30
5.1 Development of the performance simulation vehicle ... 30
5.2 Validation of the performance delivery simulation vehicle ... 35
5.3 Application of performance delivery simulation vehicle ... 40
6 FUEL ECONOMY ••.•••••.•••••••.••••••••.•••••••••••••••.•••••••••.••••••••.•••.••••.•••••••••••••• 41 6.1 Background ... 41
6.2 Shortcomings of existing tools for fuel economy prediction ... 43
6.3 New techniques for fuel economy prediction ... 44
8 CONCLUSiONS ....•...•... 54
1
Introduction
The automotive market has become more global and cosmopolitan. However, this global market has become more fragmented and differentiated because of the sophistication of the consumer. The result is that manufacturers are now competing on a product basis rather than within the traditional geographical boundaries, which compounds this fragmentation and globalisation. Thus the ability to have a product well suited to these complex factors with shorter programme times and lower programme costs is paramount to a company's success.
This need to shorten lead times, reduce programme costs and create a more differentiated product, is made at the same time as the engine is becoming increasingly complex to meet the needs of the customer and the legislator. The ability to conduct numerous designlbuild iterations is removed, as the shear task of integrating the entire system is so intricate. Tools and techniques that can be applied to assess large numbers of concepts without the need to produce physical parts would give major benefits to the new product introduction process.
Currently no tools and techniques are available that can:
• Determine the required engine performance for a particular vehicle based on the manufacturers required market position and values
• Demonstrate how the car will feel to drive before any hardware is actually available
• Calculate steady state and drive cycle fuel economy taking into account engine efficiency, component friction and control system calibration
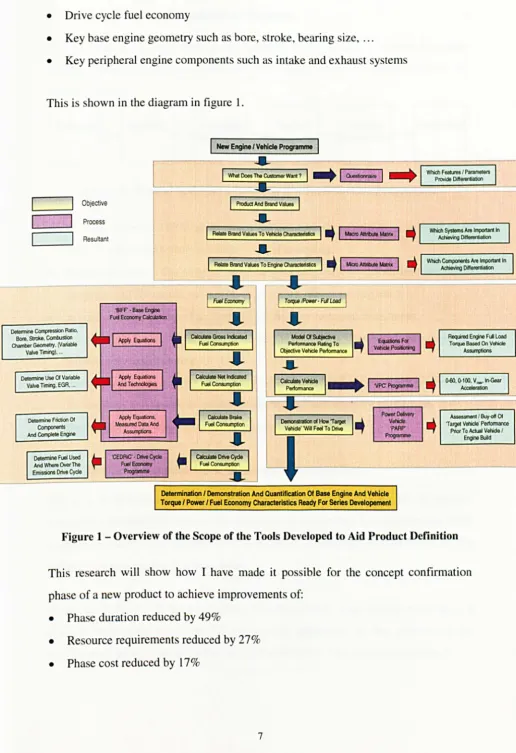
This project has developed and applied tools that will meet these requirements. This will aid the petrol engine designer/developer during the concept confirmation phase of a new engine/vehicle programme with the following aspects:
• The engine power and torque
• The vehicle performance with a given engine
• Drive cycle fuel economy
• Key base engine geometry such as bore, stroke, bearing size, ...
• Key peripheral engine components such as intake and exhaust systems
This i shown in the diagram in figure 1.
Objective
I
New Engine I Vehicle ProgrII1III'III
, What 000. n.. CuSlomerWarl? 1
-+
,
~ 1 . . .•
I P!oc1Jc:t
..
And Bland Values 1WhicI1 Features I Parametera 1
Provide OiHel9lllia1ion
I
RelateBNdVusToVehicleChatacleristicaI
..
'
UIcro~MIIrix
I
..
I
~~,,:!::In
. . L -_ _ ~ _ _ _ _ ~ Process
Resu~ant
Relate BIWld Values To Engine CharacteriSlics 1 . . , lob) AnrIIuII MIIrix I . . WhicI1 ~~~~:.,11ant In
~---~~~
.
-
~
~
~~~~
~~~
Determine Compression Ratio,
Bore, Strtll<e, Combustion
Chamber Geometry, (Variable
Valve TlI11ing), ...
Determine Use Of Variable Valve Timing, EGR, ••.
Determine Frictioo Of Components And Complete Engine
Delennine Fuel Used
And Where Over The Emis900s Drive Cycle
...---:-1 TM:pelPowttI· FIA LDad~
•
'
~E~
I
I
~r:=ed
l
•
Pefformanoo Rating ModeIOI~ ToObjectiv. Vehicle Perlormance .. I
v,::n~
I ..I
~~
I
I
~~~
I
•
I
CelaAate Vehicle. Perlormance
•
..
, 'JPC PmpMIe 1
Poww Detivtry Va/icIe,
'PARI'" I'rogrIImme
Determination I Demonltnltion And Ouantiflcltion Of Bat Engine And Vehicle
Torque I Power I Fuel Economy Characteristics Ready For Series Oeveiopement
..
..
Reqcired E"Iine FIJI Load
Torque Based On Vehicle ASSlJIT4lIions
~,~100, V .. ' In-Gear
Aa:eieratioo
Assessment I BYy-of1 Of 'Target Vehicle' Perlormance
Prior To Act.., VaNde I
[image:8.568.21.537.34.787.2]EnOne BLild
Figure 1 - Overview of the Scope of the Tools Developed to Aid Product Definition
This research will show how I have made it pos ible for the concept confirmation
phase of a new product to achieve improvements of:
• Phase duration reduced by 49%
• Resource requirements reduced by 27%
2
New Product Introduction Process
The purpose of the New Product Introduction (NPI) process is to take a product concept through to volume production. The typical stages of an NPI process are shown in figure 2.
Concept Planning Advanced Product Process Production
~ ~ Engineering ~ Engineering
H
Engineering ~Figure 2 • Typical Stages in a New Product Introduction Programme
• Product concept - The stage at which the concept of the product is defined after initial market assessment and initial concept screening.
• Product planning - The stage at which the product concept is formalised and plans are generated (financial, marketing, engineering, manufacturing etc.)
• Advanced Engineering - The stage for preliminary technical assessment.
• Product Engineering - The stage at which the concept is engineered into a product suitable for manufacturing.
• Process engineering - The stage often called manufacturing engineering at which the facilities and processes are developed and defined ready for production.
• Production - The stage at which the product is produced.
2.1 Product development as a rehearsal for consumption
The role of this process is to increase the level of understanding of the product throughout the stages to increase the suitability of the product for consumption. Each stage adds value to the product as it is becomes increasingly refined based on the information generated and actions taken.
This concept shows the known and accepted linear NPI process of figure 2 but drawn
in a different manner, illustrating how the development stages are trying to predict
what the actual use or application of the product or process will be. Thus, showing
how the product definition should match what the customer will actually want or
aspire to, and equally how the other planning and development stages are merely
preparation for the final application.
Product
I
Concept
T
S imula tion of Production
-Consumption Process
Potential Customers
Reputation.
Word of Mouth. etc.
Existi ng Customers
Note: Marketing inputs are omitted for Simplicity
c=J
Information CreatedProd oct IRvclopmmt Proress
•
I
ProductI
Plan
T
Cons wnpl ion
Process
-+
Information Creation / Transmission Process~
Desi nT
T
[image:10.565.12.553.32.783.2]Production Process
Figure 3 - Product Development Being A Rehearsal For Consumption [1]
The other important factors to consider are the different aspects of the product
definition, the objective and subjective. As these factors describe the attributes which
Objective What it does:
What it is:
Subjective Who it is for
What it represents
Performance/technical specification
Outline package and key definitions
The target customers
The character and values embodied within it
Failure to address all of these items as is often the case will lead to a lack of
competitiveness as the concept will be weak. But successful products have been
shown to consider all of the items [1, 2, 3]
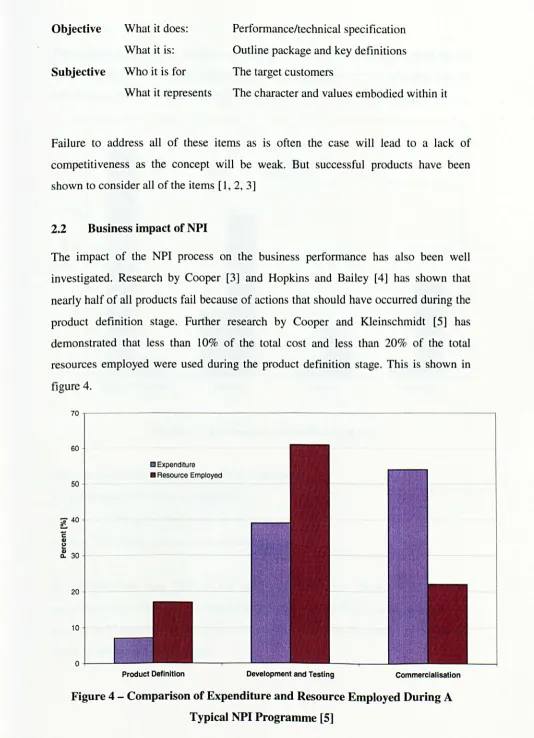
2.2 Business impact of NPI
The impact of the NPI process on the business performance has also been well
investigated. Research by Cooper [3] and Hopkins and Bailey [4] has shown that
nearly half of all products fail because of actions that should have occurred during the
product definition stage. Further research by Cooper and Kleinschmidt [5] has
demonstrated that less than 10% of the total cost and less than 20% of the total
[image:11.564.19.553.23.761.2]resources employed were used during the product definition stage. This is shown in
figure 4.
70~---.
60
50
~ 40
~ C
<II U ~ 30
20
10
0+-- -
---a Expenditure • Resource Employed
Product Definition Development and Testing Commercialisation
Figure 4 - Comparison of Expenditure and Resource Employed During A
This complements earlier findings of Munro [6] who determined the impact on the
actual product cost of the product definition stage. This shows that this has an
influence on 70% of the cost yet only accounts for 5%. This is shown in figure 5.
80. ---.
70
Influence to Cost • Actual Cost 60
50
30
20
10
o
[image:12.564.25.551.37.634.2]Product Definition Material Labour Overheads
Figure 5 - The Impact on Product Cost [6]
Thus the product definition stage of the programme:
• Influences 70% of the product cost
• Incurs 5-7% of the total expenditure
• Has 17% of the total resource employed
In summary less than 20% of the manpower that costs about 6% of the total
programme cost influences the actual cost by around 70%. Thus if more resource were
appropriately employed either in terms of people or facilities the quality of the product
2.3
NPI in-practice in the automotive industry
I then conducted further research through the benchmarking of two European Automotive manufacturers. This can be seen in submission 1 chapter 4. This research was conducted to understand what are the shortcomings of the NPI process in practice.
To determine this, a questionnaire was used followed by an interview with the managers for each project. The projects selected were recent engine programmes involving complete or near complete re-design where it was possible to obtain a detailed understanding and independent verification of the responses.
The results showed that even though the culture, development philosophy and financial condition of the companies were very different, both companies had similar problems in obtaining and keeping a well-defined product. This fact was considered to be one of the key reasons for sub-optimal performance by both organisations. The other significant difference was a reliance on market research in one company to determine 'what the customer wants' - but then ignoring the results, which contrasts with almost total reliance on the brand values, the values that the product embodies which differentiate one product from another, with the other organisation. However there was still no way of linking the product definition with either the customer or the brand requirements.
This translation of the brand requirements, into product definition objectives, the tangible elements of the product, within the context of new engine and vehicle development means the ability to:
• Predict the product position based on the product concept
• Develop detailed targets that link to the product objectives / concept
3
Importance of Product Definition
Research by Cooper [3] has shown that successful products have on average 75%
more man hours spent on activities before the start of series development than
unsuccessful products. With around 20% of new products failing to reach their
predicted sales volume because of poor product definition during the pre-development
stages of a programme. This is further justification of the need to employ more
resource in the product definition stage where major benefits can be attained.
Further examination of two major European manufacturers (to be known as
manufacturer A and B) was conducted in the area of engine selection for the vehicle.
This has showed that quite different approaches are used. 'Manufacturer A' had a very
detailed plan that folJowed a text book [2, 3, 4] approach of a structured plan of ever
increasing detail. This started with the plans for the vehicle, leading through to the
engine (or other major components), then onto the manufacturing and development
facilities. There was a tangible link throughout the hierarchy, and a link to the internal
and external forces that are acting upon the development environment. This is shown
in figure 6.
Vehicle Long Range Plan
Engine Long Range Plan
Manufacturing Long Range
~---~~--
--
---
----
~
~
[image:14.564.21.553.24.770.2]Development Facility Long Range Plan
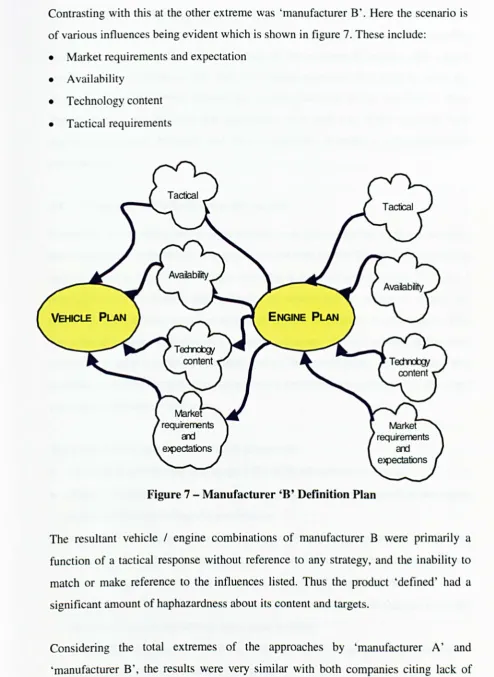
Contrasting with this at the other extreme was 'manufacturer B'. Here the scenario is
of various influences being evident which is shown in figure 7. These include:
• Market requirements and expectation
• Availability
• Technology content
[image:15.565.23.517.40.717.2]• Tactical requirements
Figure 7 - Manufacturer
'B'
Definition PlanThe resultant vehicle / engine combinations of manufacturer B were primarily a
function of a tactical response without reference to any strategy, and the inability to
match or make reference to the influences listed. Thus the product 'defined' had a
significant amount of haphazardness about its content and targets.
Considering the total extremes of the approaches by 'manufacturer A' and
'manufacturer B', the results were very similar with both companies citing lack of
structured approach taking too long from the 'signing off of the product until the start of production, this resulted in late modifications through the change of operating environment and lack of early integration of the component systems that caused conflicts. This contrasts to the 'lack of strategy approach' that fails to meet the customer expectation/needs because the product launched is not matched to these requirements. It can be stated that approaches, from each end of the spectrum, lack appropriate product definition and have caused the shortfall in released product performance.
3.1
Customer attitudes to their cars engine
Customers are becoming increasingly sophisticated and are tending to choose products that complement their actual or aspired lifestyle and values. The ability to match a product to these values and lifestyle will give a competitive advantage [3, 7, 8]. I conducted an investigation that is shown in submission 2 chapter 4, to test the sensitivity of customers to various stimuli about their preferences to a car engine. This was achieved using a questionnaire to target customers of a new product and general customers to give a comparison/control group. The investigation showed that it was possible to identify attributes that are generally preferred and attributes that the target customer in this case would prefer.
The general observations of the control group were:
• The typical split of road type usage is 25/25/50 urbanlrural/motorway
• There is a general trend towards wanting positive auditory feedback of the engine behaviour during starting and acceleration.
• Around 65% of the entire sample required their engine to start within 1-3 seconds, with only 20% requiring a faster start. This time is far longer than can be achieved. However, the desire for a consistent start is very high at around 85%.
• Cold idle speed is an area of indifference, however around 70% consider a low hot idle speed to be of importance and it must be quiet.
• The throttle progression should be between linear and sharp during acceleration, with a tendency towards linearity for cruising
• The brochure figures are considered important but an understanding of what they mean is generally low.
• Fuel economy is considered the single biggest issue when considering a vehicle choice for over 50% of the sample, however 0-60 acceleration time was also considered important but by 20% less.
The areas in which the separate group of target customers for a new lower executive car showed a preference and where the behaviour differed include:
• The target customer travelled around 40% more than the average, but the split of road usage was very similar. However, the amount of single occupancy of the vehicle was 20% higher.
• The target customer was on average around 15% more in favour of auditory feedback, particularly during hard acceleration.
• The desire to stay in a high gear was greater, requiring more torque • Fuel economy does not have a significant effect on the driving style
• The single biggest reason for purchase of nearly 50% of the target customer sample considered was the 0-60 time vehicle choice, however fuel economy was also considered important in this comparison at 35% ..
In summary, the investigation showed that the target group in this case wanted things just a little bit better than average with respect to the vehicle power train. This can be seen in the increased desire to maintain a higher gear, the importance of 0-60 acceleration times and the neglect of fuel economy. However it has shown it is possible to differentiate for a target customer by the engine and vehicle characteristics.
4
Translation of Subjective Ratings into Objective Engineering
Terms
One of the problems that faces the engine development engineer in the product definition stage of the programme is how to translate the ratings that are given during vehicle assessments into objective engineering terms such torque, gear ratio, throttle progression etc. The inability to make this connection will mean there is:
• A huge missing link between what the customer wants and what is engineered, due to the lack of information and the inability to justify many decisions
• Impossibility to test and demonstrate the sensitivity of parameters to customer satisfaction
Two techniques to fulfil these requirements have been considered:
• Quality Function Deployment (QFD)
• Marque Engineering
QFD is the traditional method of associating customer requirements with feature content. This was developed by Mitsubishi in 1972 and taken to America by Ford and Xerox in 1986 [9]. The considered major shortcoming of this technique is that although it provides the link between customer requirements and design features, the high reliance on the customer is considered dangerous. The use of the customer as the centre of the design process means that the resultant product will be heavily normalised to the requirements/opinions of a variety of people and will reflect the views at the point of asking and not when the product will be launched. This may be acceptable for:
• Very high volume manufacturers like Toyota for vehicle manufacture
• Products with short lead-times, for example low end consumer electronics such as personal hi-fi
However, it is believed to be not necessarily applicable for products such as engines
and vehicles where it has been identified a high level of product differentiation is
required.
4.1
Marque Engineering
An alternative method is marque engineering, in which the first and unique stage links
the attributes that a product with its unique history can embody, with ratings on the
importance of individual values to a particular product. Having linked the high level
attributes (termed macro attributes which are essentially the behavioural
characteristics experienced by the end user) to the brand values that determine the
importance of each macro attribute, the results can be ranked and the most important
macro attributes in the fulfilment of these values can be identified. Thereafter the
system or component variables (termed micro attributes which are the tangible
parameters that allow the experience of the macro attribute) can be related to the
macro attributes to show the importance and relationship of a detailed component to
the fulfilment of a brand value. The association of the brand values to the product
attributes results in a differentiated and matched result to the target customer. Rather
than trying to be all things to all men. This is discussed in more detail in section 4.2
onwards. The basic technique was proposed by Ali [10] and as part of this project it
has been further developed to give a required engine torque, applied to a new vehicle
programme and validated from basic vehicle dynamics. The process further developed
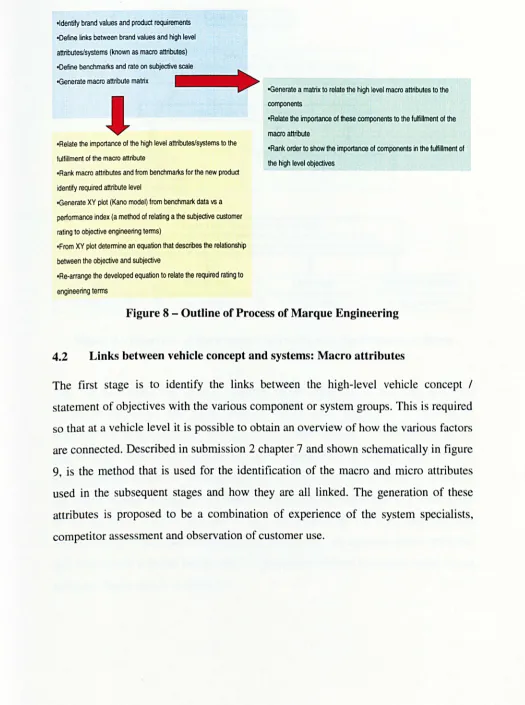
-Identify brand values and product requirements
-Define links between brand values and high level
attributes/systems (known as macro attributes)
-Define benchmarks and rate on subjective scale
-Generate macro attribute matrix
~
~ -Generate a matrix to relate the high level macro attributes to the
I
-Relate the importance of the high level attributes/systems to the fulfillment of the macro attribute
-Rank macro attributes and from benchmarks for the new product
identify required attribute level
-Generate XV plot (Kano model) from benchmark data vs a
performance index (a method of relating a the subjective customer
rating to objective engineering terms)
-From XV plot determine an equation that describes the relationship between the objective and subjective
-Re-arrange the developed equation to relate the required rating to engineering terms
components
-Relate the importance of these components to the fuHillment of the
macro attribute
-Rank order to show the importance of components in the fuHillment of
[image:20.564.21.546.36.741.2]the high level objectives
Figure 8 - Outline of Process of Marque Engineering 4.2 Links between vehicle concept and systems: Macro attributes
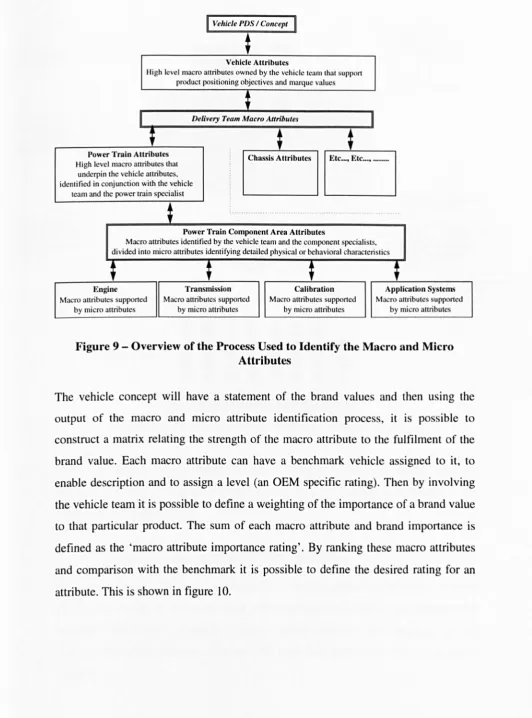
The first stage is to identify the links between the high-level vehicle concept /
statement of objectives with the various component or system groups. This is required
so that at a vehicle level it is possible to obtain an overview of how the various factors
are connected. Described in submission 2 chapter 7 and shown schematically in figure
9, is the method that is used for the identification of the macro and micro attributes
used in the subsequent stages and how they are all linked. The generation of these
attributes is proposed to be a combination of experience of the system specialists,
I
Vehicle PDS / Concept~
Vehicle Attributes
High level macro attributes owned by the vehicle team that support
product positioning objectives and marque values
;
Delivery Team Macro Attributes
;
;
;
Power Train Attributes
Chassis Attributes Etc ... , Etc. .. , ...
High level macro attributes that underpin the vehicle attributes. identified in conjunction with the vehicle
team and the power train specialist
*
. ...•....
Power Train Component Area Attributes
Macro attributes identified by the vehicle team and the component specialists.
divided into micro attributes identifying detailed physical or behavioral characteristics
;
;
;
Engine Transmission Calihration Application Systems
Macro attributes supported Macro attributes supported Macro attributes supported Macro attributes supported
[image:21.565.20.552.31.749.2]by micro attributes by micro attributes by micro attributes by micro attributes
Figure 9 - Overview of the Process Used to Identify the Macro and Micro Attributes
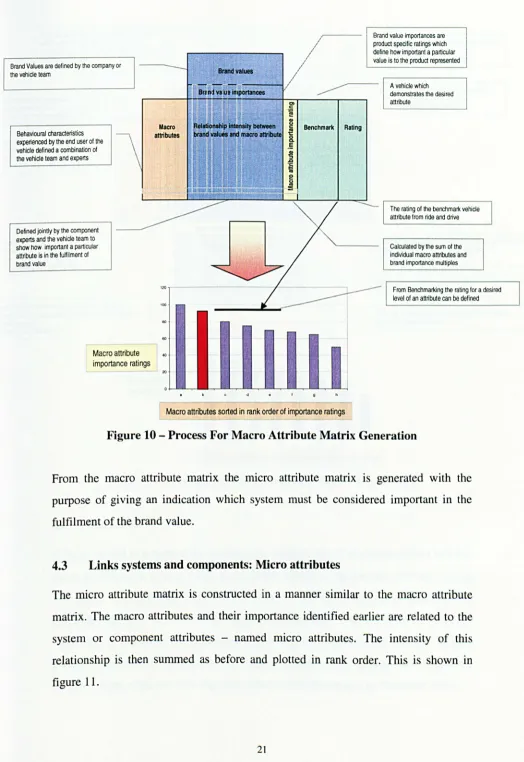
The vehicle concept will have a statement of the brand values and then using the
output of the macro and micro attribute identification process, it is possible to
construct a matrix relating the strength of the macro attribute to the fulfilment of the
brand value. Each macro attribute can have a benchmark vehicle assigned to it, to
enable description and to assign a level (an OEM specific rating). Then by involving
the vehicle team it is possible to define a weighting of the importance of a brand value
to that particular product. The sum of each macro attribute and brand importance is
defined as the 'macro attribute importance rating'.
By
ranking these macro attributesBrand Values are defined by the company or the vehicle team
Behavioural characteristics experienced by the end user of the vehicle defined a combination of the vehicle team and experts
Defined jointly by the component experts and the vehicle team to show how important a particular attnbute is in the fulfilment of brand value
Macro attribute
importance ratings
Macro attributes
Rating
,~,---~---,
'00
60
Macro attributes sorted in rank order of importance ratings
Brand value importances are product specific ratings which define how importanl a particular value is to the product represented
A vehicle which demonstrates the desired attribute
The rating of the benchmar1< vehicle attribute from ride and drive
Calculated by the sum of the individual macro attributes and brand importance multiples
[image:22.564.24.548.25.787.2]From Benchmar1<ing the rating for a desired level of an attribute can be defined
Figure 10 - Process For Macro Attribute Matrix Generation
From the macro attribute matrix the micro attribute matrix IS generated with the
purpose of giving an indication which system must be considered important in the
fulfilment of the brand value.
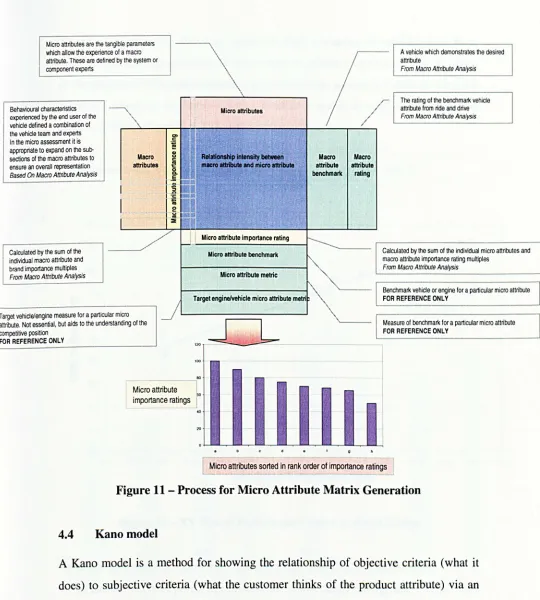
4.3 Links systems and components: Micro attributes
The micro attribute matrix is constructed in a manner similar to the macro attribute
matrix. The macro attributes and their importance identified earlier are related to the
system or component attributes - named micro attributes. The intensity of this
relationship is then summed as before and plotted in rank order. This is shown in
Micro attributes are the tangible parameters wIlich allow the experience of a macro attribute. These are defined by the system or component experts
Behavioural characteristics experienced by the end user of the vehicle defined a combination of the vehide team and experts In the micro assessment it is appropriate to expand on the sub-sections of the macro attributes to ensure an overall representation
Based On Macro Attribute AnalysiS
Calculated by the sum of the individual macro attribute and brand importance multiples
From Macro Attribute Analysis
Macro atbibutes
Target vehidelengine measure for a particular micro attribute. Not essential, but aids to the understanding of the competitive position
FOR REFERENCE ONLY
Micro attributes
Uicro attribute benchmark
Micro attribute metric
Target engineivehicle micro attribute metri
'20- - -
-'00
1
Micro attribute importance ratings 20 0 Macro attribute benchmark-A vehicle which demonstrates the desired attribute
From Macro Attribute Anatysis
/
The rating of the benchmark vehicle attribute from ride and drive
From Macro Attribute Analysis
'---Macro attribute
rating
Calculated by Ihe sum of the individual micro attributes and macro attribute importance rating multiples
From Macro Attribute Analysis
Benchmark vehicle or engine for a particular micro attribute FOR REFERENCE ONLY
[image:23.569.17.557.16.616.2]Measure of benchmark for a particular micro attribute FOR REFERENCE ONLY
Figure 11 - Process for Micro Attribute Matrix Generation
4.4 Kano model
A Kano model is a method for showing the relationship of objective criteria (what it
does) to subjective criteria (what the customer thinks of the product attribute) via an
XY graph. The subjective inputs to the graph are the customer ratings from product
appraisals using an arbitrary scale, usually a rating from 0 to 10. With an objective
value that is related to the behaviour that is being ·considered, for example vehicle
performance being a function of the engine torque, engine speed, vehicle gearing,
An example of this is shown in figure 12. Here a number of vehicles have been
assessed during a ride and drive for the criteria of vehicle performance. The Y values
of the diagram are the customer ratings for each vehicle, and the X values are from the
calculated objective performance index used to describe in engineering terms the
criteria vehicle performance. This is shown in equation 1.
Performance index
=
torque (in a given speed range) x gear ratio EQ. I vehicle weight10.0
9.0
8.0
7.0
---0
.,... I
6.0 0
...
en
c 5.0 ;:
cu
a:
::
4.0•
UJ
0
3.0
2.0
1.0
0.0
8.0 8.5 9.0 9.5 10.0 10.5 11.0 11.5 12.0 12.5 13.0 13.5 14.0 14.5 15.0
[image:24.569.10.556.24.629.2]Low Speed Performance Index
Figure 12 - XY Plot of Performance Index vs OEM Rating
From the equation that relates the subjective to the objective it is possible to:
• Relate the required product position to the brand values through use of macro and micro attribute matrices.
• Relate and test the sensitivity of the engineering attributes required to meet the required customer rating. For example for the case of mjd-range vehicle
performance: the overall level of torque in a speed range, the vehicle gearing and
tn
t:
:;:: C'CI
a: CI) > :0=
u
CI) 'i!i
::l
en
:lE w
0
10
9
8
7
6
5
4
• Derive the performance indices and from the known fixed points/working
assumptions, the unknown terms can be calculated.
• Predict how the product will behave without having to actually build any parts.
4.5 Application of the results from a Kano model
Having achieved a good correlation it is possible to test the effect of the variables on
the target engine / vehicle compared with the competition. This is shown in Figure 13
where a new vehicle original position is compared with three scenarios:
• 150kg lower vehicle weight
• 2 mph! 1 000 rpm reduction in gearing
• lONm increase in torque
150kg lower vehicle weight
Vehicle Team Target Ratin
-2 mph/1000rpm in gear ratio
10Nm more torque across speed range
3
2
1
0
Omega 2.5 Omega 2.5 Vectra V6 New Vehicle New Vehicle New Vehicle Audi A4 Ford
[image:25.561.6.544.32.705.2]V6 CDX V6 Base Mondeo V6
Figure 13 - Comparison of Vehicle Positioning
In this example the vehicle team had set a target rating of 8.5, but the new vehicle
could only achieve 7.3. The three cases considered showed that the target positioning
The reduction in gearing would have a fuel economy penalty which means that a serious task on vehicle weight was required.
Another use of the different performance indices is to define the average torque required from the engine based on a given set of vehicle configuration data: weight, gearing etc. In this example the performance index defined in equation 1 relates the customer perception to the relationship of engine output, gearing and vehicle weight. Through rearrangement of this equation it is possible to determine the torque required in a given speed range. This is shown in equation 2.
Torque Nm (in a given speed range) = Performance index x Vehicle weight x Gearing
EQ.2
180. - - - -- - - -- - - ,
170
160
150
E
140~
G) 130
;::,
c-o
.- 120110
100
90
-Lower
- Medium -Upper
Low Speed Performance Mid Range or Cruise Performance Overtaking Performance
80~--~----~---r----~----~--~----~----~----~----~----~--~
1000 1500 2000 2500 3000 3500 4000 4500 5000 5500 6000 6500
[image:27.570.27.553.28.772.2]Engine Speed [revs/min]
Figure 14 - Development of Engine Torque Curves to Give a Required Customer
Rating for Different Vehicle Specifications
4.6 Summary
In summary it has been shown it is possible to link the high-level vehicle values and
required customer rating, through a series of matrices (macro and micro) and
equations (performance indices) to give a required engine torque in a speed range.
This can then be used with more traditional tools to define the detailed characteristic.
This overall process is shown in figure 15.
It should also be noted that although the development has occurred entirely on the
aspect of engine performance the same techniques are proposed for use with different
attributes.
IMAGING SERVICES NORTH
Boston Spa, Wetherby West Yorkshire, LS23 7BO www.bl.uk
PAGE MISSING IN
Macro Attribute Relationship Matrix
-.
--...--
,
---.
_
...
tIao..,.~ . . . .
---'
...
Micro Attribute Relationship Matrix
From benchmarking the rating for a desired fevel of attribute can be determined
- - .
Macro Attribute Importance Gr
..
!
1i ,
~ 5
,.
.
'"
.E ,
~
Kano Model
R~ed r.ting lot an .t1Jibote
Linea, feglessiOn 110m
Y8l'lousvet-kiM
,
•
l
Reqt*6d obfectIve valUe'
Jor.natbOOtB
,.
~
Pet1'Of'mtlflC. Ind •• based on obt-ctlvoe crhw"Equations for performance index such as:
performance index = torgue (x-v rpm) x n gear ratio
vehicle weight [kg]
can be manipulated to give the required level of a variable based on assumptions, such as the average engine torque in a given speed range:
torque [x-y rpm) = Illlrformance index x vehicle weight
n gear ratio
,I.
,
t
u. - - -- -
-.., - .
~
~
1
..
,/
lIS
/
~
j
I
'"
,...f~
/
"-..
,..
..
- - - -~--.-.--. ._..; - --- - ---..
I
,--
-,.,..-~-..
-
-
-
I..
"'" "" "'" ...,
...
....
-
"'" ..,. ...,...
....
"'" '"
_ ... 1 - !
Micro Attribute Importance Graph order 1. An indication in order to provide the of whiclh systems/components must given brand value be considered in whiclh
[image:29.804.0.804.37.548.2]2. Reflection of the importance of the variables in the equations for the performance index
This technique has been verified through calculations based on the vehicle dynamics and practically on a new vehicle and engine programme in the area of full throttle performance of the engine and vehicle. The technique was also used for prediction of the product position and allowed the demonstration of the improvements that could be achieved through optimisation by the component design groups. This is described in submission 2 chapter 6.
To conclude the technique of marque engineering has been applied with relative ease to a lower volume manufacturer. This application is made easy, as the values that the lower volume companies have tend to be very specific and directed at discreet areas of the population. It is believed that the technique could also be used for higher volume manufacturers through selection of the appropriate values for these products. This is because the values higher volume manufacturers have should just apply to a wider customer base and therefore the product must embody attributes that add to these values. Hence, the techniques developed are believed to be
5
Demonstration of Engine Performance
It has been shown that it is possible to identify the detailed attributes that are important in
emphasising the brand values. One of the most important attributes identified was that of power
delivery and the techniques discussed will allow the prediction of the required full load
performance to fulfil a product positioning relative to the competition. However, what is
difficult is the subsequent evaluation or demonstration of the identified, aspired or resultant
performance.
This section will discuss how I developed, validated and applied a vehicle known as the
performance simulation vehicle to enable the simulation of a new engine/vehicle before real
hardware is available. This tool is necessary:
• To allow the driver-feel to be evaluated before any 'real' hardware is available. This allows a
continued focus within the project team on design rather than manufacture and build.
• To enable the overall product concept with respect to the engine-in-vehicle performance to
be 'bought-off at the earliest possible stage of the programme. This allows for many
iterations to be considered at the time in the programme when it is still time and financially
viable. This allows focus on delivery rather than on numerous hardware iterations.
• To enable the what-if studies to be considered and evaluated.
• To add extra correlation data to the models created and to provide a medium for easily
generating new models due to the extra degrees of freedom available.
5.1 Development of the performance simulation vehicle
The concept is based on the manipulation of a donor engine output (an engine whose output is
greater than that to be simulated) to match what a target or predicted engine would achieve. This
manipulation is achieved by controlling the output of the donor engine through the limiting of
the airflow into the engine using the throttle, but maintaining or controlling to a defined throttle
progression. The vehicle will drive as if powered by the 'new' engine and enable the objectives
~Or---'
200
180
160
140
E
~ 120
ell
:::J C-tOO
~
80
60
40
20
Basis torque from donor engine
---.
,
...
--
-Progression curve can be simply scaled
by the ratio of the maximum torques
or by altering the rate of change of torque
per degree throttle movement to give a
range of responses from relaxed through
10 linear
Maximum torque from donor engine
O+-~--~~--~----~~----~----~----~----~---~----~----~----~
o 0.1 0.2 0.3 0.4 0.5 0.6 0.7 0.8 0.9 t.t
[image:32.561.8.550.29.788.2]Relative Pedal Movement [-]
Figure 16 - Modification of donor engine output to match target engine
As the application of this tool was to be on a new engine programme with a capacity range of
1.6 - 2.01, a donor engine of 2.51 was chosen. This engine was fitted to an engine dynamometer
where a detailed map, over 1000 datapoints, of engine output was measured. This gave the
240r---~
220
200
E 140
~
~ 120
e-{2 100
80
60
40
20
O+---~--_+--~=---r_--+_--~--_+--~----r_--+_--_r~~--~
750 1250 2000 3000 4000 5000 6000
[image:33.558.18.533.25.386.2]Engine Speed [revs/min]
Figure 17 - Output from Engine on Test Bed
- - 0 - -5
10
- -15 - -20
- -25
- -30 --35
- -40 - -45 50 60
- 70
- 80
- 90
A simulator vehicle was built with the 2.51 engine and with an additional control module to
regulate the throttle action to simulate the target engine. It was decided that either a separate
'drive-by-wire' module needed to be integrated into an existing engine management system or
another unit was to be used so that all the existing elements of the calibration could be carried
over and as such give good driveability. The former solution was favoured but not allowed due
to internal constraints, so a secondary control unit solution was sort through a third party.
This system shown in figure 18, uses a fixed link to a dummy throttle body where a
potentiometer measures the driver demand. The driver demand is then inputted into a controller
which maps driver demand against output throttle angle which has been calculated to simulate
the new engine, and will be described later. The output throttle angle is converted to a voltage
Bowden Cable To Dummy Throttle Body
Accelerator Pedal
1-- - -
-I
I
aD
GD
Dummy Throttle Body
Mounted To Vehicle
Bulk Head
Dummy Throttle
Potentiometer
-Measuring Driver Demand
Controller From Omitec
Map
Dri ver Output Throille Demand Angle Duty Ratio
Engine Speed
Pacific Scientific
Servo Motor Controller
Bowden able To
Throttle Body On Engine
Pacific Scientific
[image:34.558.16.547.18.477.2]Servo Motor
Figure 18 - Overview of Control System
Throttle Body On Engine
88
Using a program I wrote named PARP (PerformAnce deliveRy demonstRation Program), the
calculation for the required throttle position to give a target level of torque is made. This is
detailed in submission 2 chapter 8. The target level of torque is a function of the required full
load torque, the throttle progression chosen and vehicle information such as target weight,
gearing and aerodynamic drag. This is shown in figure 19. The output from this calculation i
used as the map for the main throttle controller. From this information it is possible to simulate a
Vehicle
Base Target
Vehicle Vehicle
= (Target Vehicle rolling resistance + aerodynamic) + (Base Vehicle rolling resistance +
Mass [kg] 1336 1336
Cd[-] 0.32 0.32
Frontal Area [m1 1.67 1.67
,.' gear [mph/1000 rpm] 6.5 6.5 2"" gear [mph/1 000 rpm] 9.5 9.5
3rd gear [mph/1000 rpm] 13.4 13.4
4111 gear [mph/I 000 rpm] 18.8 18.8
5111 gear [mph/I 000 rpm] 22.8 22.8
Engine Inputs:
Required Full Load Torque
= 1 - Base vehicle weight X Required full load torque
.
n
/ full load torque X" Resistances X Vehicle weight effect on
Speed [rpm] 1000 2000 3000 4000 5000 6000 7000
Torque [Nm] 110 140 155 165 150 134 110
Required Throttle
r-To~q~i;~
TargetV~=-
Corrected required full loadtor~e
X Throttle progression factor X RelativeJ
n
Look up throttle angle of donor
engine
n
eo
~r,---,
L
""
o I =-===r =+==---I
lCQI) . . . ,
E . . ... I. . - - -I
-, " - os
-,.
50 10
~
i:
o~I----__________________ ~ ______ - -__ - -- -__ ,. .. so
. . . . Jt ... ,....~l
Throttle Progression Factor = Required Throttle Progression
Relative Torque = Torque at throttle angle
Input
[image:35.806.0.776.31.540.2]5.2 Validation of the performance delivery simulation vehicle
Having defined the concept, built the vehicle and developed the simulation methodology the
next stage was to check that the vehicle with a target engine profile behaved in a manner similar
to the predictions (prediction in this context is the vehicle performance predictions determined
by two independent calculation programs). This was achieved through a validation process on a
chassis dynamometer and on the test track. The objectives of the validation were to determine
answers to the following:
• At a constant engine speed is the torque at a given throttle angle what it should be
• At a constant input throttle angle is the torque at a variety of engine speed what it should be
• During traditional vehicle performance tests does the vehicle behave as predicted
The first two stages of the validation are conducted using a chassis dynamometer. The test
[image:36.562.28.537.45.738.2]vehicle fitted to the dynamometer is shown in figure 20.
Figure 20 - Vehicle During Test on Chassis Dynamometer
The first stage of the validation process was to verify the ability of the system accurately to
this was throttle angle sweeps (from closed to fully open and back to closed) at 4 different
engine speeds with 3 different target engine profiles loaded in the controller.
The results were very promising and showed on constant speed operation the correlation of
target to measured values was within ±3% from a range of predicted/target outputs in all cases.
An example of the results is included in figure 21.
The next stage of the test was at a constant target throttle angle and with varying speed. The
condition chosen was to simulate a full throttle power test. Again 3 different engine profiles
were loaded and the results presented are typical of all the tests. Figure 22 shows that with the
exception of a single engine speed the results fall within the required tolerance of ±3% .
160
140
120
_ 100 E
z
...
C1I 80 :l C"...
0 I- 60 40 20 0.-
--
---
--
---.
6
I
Off·idle
I
:
..
I
I
ITransition
:4---t..;---'Steady State'
-Target
- Measured
- Difference TargetMeasured
~
5
4
3 ~
2...
2 't:J
C1I
...
:l
III
ca 0 ::E: C1I
--1 C1I CI
...
-2 ~
-3 C1I CJ
c:
C1I
-4
...
C1I:t:
-5 0
-6 -7
+---~----~----~----~----~----~----~----~----+ -8
0 10 20 30 40 50 60 70 80 90
[image:37.558.25.538.12.801.2]Throttle Angle [degs]
18o.---r---~----_r l0
[image:38.558.15.541.22.766.2]170 8
...
160 6 ~
E
150 -Targetz
...
-~ 140
tT
- Measured 2 ~
...
~
~
Difference130
120
110
o ~
c
~
-2 ~ C
-4
100 ~
1 000 1500 2000 2500 3000 3500 4000 4500 5000 5500 6000
Engine Speed [revs/min]
Figure 22 - Example of Constant Target Throttle Validation Test
The third section of the validation was on the test track. This was to simulate the driving
conditions of normal drivers and the typical brochure in-gear acceleration tests that are quoted
70 5th Gear 90
7
•
•
50 5th Gear * 70
6
•
•
50 4th Gear 70
5
•
•
,...
I
...
"- 30
4th Gear * 50
GI
.c
•
•
E 4
:::I
Stan End
Z 20 40
GI 4th Gear Speed Gear Speed
..
•
•
iii 3
•
•
..
III30 3rd Gear 50
GI
l-•
•
2
20 3rd Gear 40
•
•
0
0 500 1000 1500 2000 2500 3000 3500 4000 4500 5000 5500 6000
[image:39.558.19.543.53.734.2]Engine Speed [revs/min]
Figure 23 - Test Sites Considered For Vehicle Evaluation
The track assessment is the most difficult on which to obtain accurate results because of the
extra degrees of freedom that exist when testing on track and with the vehicle open to
atmosphere. Three different vehicle profiles were considered at each of the test sites detailed
above and the results are shown in figure 24 and 25. The tests show that in terms of percentage
the spread is in the range of -8 to +7%, although the mean is around ±4%. When this is
considered in absolute terms a spread of -1.3 to +0.5 seconds is seen, with a mean ±O.3 seconds.
This is believed to be acceptable for the demonstration of a target engine in a vehicle during the
product definition stage of a programme. This is because the changes considered are normally
relative, with comparisons between options being the norm and because it takes a skilled vehicle
8
6
;e
4 L-
IIICl
~ 2
E
e
-III 0
U
c:: !
£
-2i5
III
Cl
:! -4
c::
III
~
III
a. -6
-8
-10
0.8
0.6
0.4 Iii
u
!
0.2Qj
~ 0
ca ~
E
e
-0.2-
II)U
; -0.4
~
is -0.6
S
~
g
-0.8.c
"'
-1-1.2
-1.4
•
.A
~ Simulated 1.61 engine
•
Simulated 1.81 engine.A
Simulated 2.0\ engine
1 '/
20- P(3) 30, ~(3) 20-~(4) 30- P(4) 50-tJ(4) 50- 0(5) 70-tJ(5)
1
II ,~
,,.
I~
I.
II
I
[image:40.558.15.543.17.783.2]Test Site
Figure 24 - Track Test: Percentage Error
Simu ate d I. 61 eng me
Simulated 1.81 engine
Simulated 2.01 engine ~
I~ 1 ~
' /
'I'
I-
,20-~(3) 30 ~(3) 20-P(4) 30- 0(4) 50- 0(4) 50- R(5) 70- 0(5)
~ ~ At. ,
I-~ ~ Test Site
5.3 Application of performance delivery simulation vehicle
Having built and validated the vehicle, it was then used with a new product team to show the effects of including different technologies on engine output and vehicle performance. Using this vehicle it was possible to assess, in realistic conditions, a range of performance options, and thus make a decision on the driver feel of the vehicle, not just on statistics on paper. This meant that once the commercial team had a view as to how the vehicle should feel it was easier to define and justify base engine design decisions. This is the exact purpose for which the vehicle was developed.
6
Fuel Economy
The previous sections have demonstrated a technique for the translation of the subjective customer ratings into objective engineering terms, and applied this to engine and vehicle full load performance. Another very important area of development is that of fuel economy. This is becoming increasingly significant with the threat of fiscal penalties for vehicles with poor economy and the increase of Government taxation on fuel [11] which means the customer is very likely to start to view fuel economy as a differentiating factor through economics if not
ethics.
As fuel economy is becoming a serious issue for automotive manufacturers the ability to predict steady state and drive cycle fuel economy is essential. In order for the prediction of fuel
economy to be of use it must:
• Be based on sound assumptions
• Be appropriately accurate
• Allow for detail changes to be made and enables an understanding of the end result
The level needed in this case is relative not absolute, as during the product definition stage the ability to understand the effects of individual small changes is more important than absolute accuracy. The sound assumptions are required to enable simulation of what is really occurring to the engine and not as is often the case generalised overall correction. With the ability for detailed changes to be understood being fundamental during the product definition stage. It is at this stage of a engine/vehicle programme that the basic engine configuration needs to be established and targets set for the various systems that will determine the actual fuel economy of the
product.
6.1
Background
The prediction of fuel economy is based on the ability to calculate the elements that will effect the steady state and in-vehicle conditions and the subsequent engine behaviour, taking into account factors of the following three discreet areas:
•
Combustion and thermodynamic:dissociation
in-complete combustion
heat transfer to the cylinder walls
exhaust valve opening before BDC
pumping loss
• Friction Losses
losses due to component friction and electrical loading of alternator
• CaLibration (controL of engine fueL and ignition) effects
modification of engine operating point based on warm-up
fuelling and ignition corrections based on operating point
The amount of fuel used to create useful work output and its resultant energy balance can be
characterised for a typical engine in figure 26 [12]. This is shown at a steady state speed and a
load-operating condition representative of the European drive cycle. This shows the useful work
and the losses that occur in the transfer from fuel energy, also shown are the various efficiencies
that are often quoted. Note that due to the dynamic influence of the calibration, this is not
considered in this steady state comparison.
100% 90% 80%
"5 70%
Co .E
> 60%
en
Qj
c:;
w 50%
'0 Gl en 40% co Gi u I> 30% c. 20% 10% 0% Cycle
• Limit of Compression ratio and
relationship of specific heats • Variable specific heats
o
DiSSOCiation.In·complete combustion
o Heat transfer / Loss at cylinder walls
• Combustion not at constant volume
o
Exhaust valve opens before BDC• Pumping
• Friction
[image:43.558.19.541.21.795.2]• Useful Work
These factors can be grouped based on their sources of information, these being:
• Through calculation
• Assumed constant
• Use of benchmark data
The graph in figure 26 can be replotted with different colours to represent the information
source. This is shown in figure 27.
100%
90%
80%
-
:::l 70%c.
.E
Theoretical Cycle
>- 60% CI
...
GI
c:
UJ
-
50%0
GI
CI
40%
IC Gross Indicated
-
GIEfficiency u
...
Net IndicatedGI 30%
c..
Efficiency
20% Brake Thermal
10%
0%
• Limit of Compression ratio and relationship of specific heats
• Variable specific heats
• Dissociation
• In-complete combustion
• Heat transfer / Loss at cylinder walls
• Combustion not at constant volume
• Exhaust valve opens before BDC
o
Pumpingo
Friction• Useful Work
_ Assumed constant _ calculatable
I
Calculate or use [image:44.558.13.542.36.796.2]~----lbenChmark data .
Figure 27 - Typical Engine Energy Balance Showing Information Source [12]
Therefore it can be seen that over 80% of the energy balance can be determined through
calculation or through the use of benchmark data, with just less than 20% having to be
considered as constant.
6.2 Shortcomings of existing tools for fuel economy prediction
I undertook research in two European Automotive manufacturers. This showed that the
processes used to determine the steady state and emissions drive cycle fuel economy were not
robust as the predictions were based on:
• Best case results not representative of full operating range
• Friction improvements always considered, but the effects of engine geometry changes ignored
• Incorrectly modelled warm-up with the high dependence of friction on oil temperature not considered
• Calibration terms such as idle speed setpoint, warm-up fuelling, etc. were not considered.
In addition to the above it was not possible to determine the effects of detail component changes on the cumulative fuel economy, making it is impossible to understand contributions and conduct detailed analyses.
Other calculation programs were considered from various major European consultant engineers but none of them approached the subject any differently from the two manufacturers considered. However, Watson and Liu [13] suggested a method based on the use of indicated rather than brake data in the calculation process to remove the influence of friction. This provided the spark that prompted the development of a suite programs that had:
• Base data mapped against speed and load - This overcame the problems associated with a limited number of datapoints
• Engine warm-up being considered - The actual engine operating point IS represented throughout the drive cycle as the engine warms up.
• Base fuel economy presented in indicated values with further maps of friction and pumping loss - This separated the effects of friction and pumping
• Calibration effects considered that modify the engine operating point of the fuel used - The actual engine operating point in terms of load is effected by calibration as this will alter the idle setpoint, and the fuel and ignition used.
6.3
New techniques for fuel economy prediction
I have developed two programs for fuel economy prediction, BIFF: Base engine Friction and
Fuel economy and CEDRiC: Component based fuel Economy Drive cycle under Realistic
Condition. These programs have the same structure based on figure 27 where the actual engine
![Figure 3 - Product Development Being A Rehearsal For Consumption [1]](https://thumb-us.123doks.com/thumbv2/123dok_us/9829418.484215/10.565.12.553.32.783/figure-product-development-rehearsal-consumption.webp)
![Figure 5 - The Impact on Product Cost [6]](https://thumb-us.123doks.com/thumbv2/123dok_us/9829418.484215/12.564.25.551.37.634/figure-impact-product-cost.webp)