An approach to measure pronunciation similarity in second
language learning using radial basis function kernel
Christos Koniaris
University of Gothenburg, Centre for Language Technology Department of Philosophy, Linguistics and Theory of Science
Dialogue Technology Lab, Gothenburg, Sweden
ABSTRACT
This paper shows a method to diagnose potential mispronunciations in second language learning by studying the characteristics of the speech produced by a group of native speakers and the speech produced by various non-native groups of speakers from diverse language backgrounds. The method compares the native auditory perception and the non-native spectral representation on the phoneme level using similarity measures that are based on the radial basis function kernel. A list of ordered problematic phonemes is found for each non-native group of speakers and the results are analyzed based on a relevant linguistic survey found in the literature. The experimental results indicate an agreement with linguistic findings of up to 80.8% for vowels and 80.3% for consonants.
KEYWORDS:
pronunciation error detection, similarity measure, radial basis function kernel,phoneme, second language learning.
Christos Koniaris 2014. An approach to measure pronunciation similarity in second language learning using radial basis function kernel. Proceedings of the third workshop on NLP for computer-assisted language learning.
1
Introduction
Second language (L2) speakers are generally having trouble with certain phonemes of the target language that do not exist in the sound system of their native language (Flege, 1995; Guion et al., 2000). It is therefore common practice to include speech sounds from their first language (L1) or ignore unfamiliar ones (Piske et al., 2001) while practicing a new language. Within
a computer-assisted language learning (CALL) program, the task of automaticpronunciation
error detection(PED) is to find effective techniques to diagnose and detect mispronunciations in order to assist L2 learners to improve their oral capabilities.
In (Neumeyer et al., 1996; Franco et al., 1997; Neumeyer et al., 2000) a system used for performing automatic speech recognition (ASR) is turned into an automatic pronunciation scoring system, in which several different scores, e.g., hidden Markov models (HMM) phone log-likelihood, are compared to human listeners’ evaluation. The experiments show that certain scores, such as the log-posterior and the normalized duration correlate well with human ratings. Scoring is also the main characteristic of the goodness of pronunciation (GOP) proposed in (Witt and Young, 2000), which measures the quality of pronunciations of non-native speakers. The idea is to score each phone of an utterance depending on how close the pronunciation of the non-native speaker is to that of native speakers. A method that combines knowledge from acoustic-phonetic, linguistic, and from expert listeners is presented in (Park and Rhee, 2004), in which the analysis of the results is done by finding the correlation of human listeners and machine-based rating. In (Truong et al., 2005), a set of classification approaches based on linear discriminant analysis (LDA) and decision trees is presented. These classifiers are used to analyze the mispronunciations of second language learners of Dutch. In (Tepperman and Narayanan, 2008), the research is oriented in introducing articulatory information in PED by reformulating the hidden-articulator Markov models (HAMM) (Tepperman and Narayanan, 2005) and deriving new articulatory-based features for classification. In (Strik et al., 2009), four different classification systems are examined: a GOP-based, one combining cepstral coefficients and LDA, a method based on the work described in (Weigelt et al., 1990), which is an algorithm that discriminates voiceless fricatives from voiceless plosives, and an LDA-acoustic-phonetic feature classifier. It is found that the two LDA-based classification systems perform better in mispronunciation detection. In (Wei et al., 2009), the authors use support vector machines (SVM) to model phones with several parallel acoustic models that represent the variation in pronunciation at various proficiency levels. This approach seems to achieve better results in comparison to more traditional posterior probability based methods.
In this paper, a PED method based on psychoacoustic knowledge from a spectral auditory model (van de Par et al., 2002) is presented that models the native perception to evaluate non-native pronunciations based on acoustic and auditory processing of the speech sounds. The fundamental assumption is based on the ability of the human auditory system to distinguish speech sounds of various type. The method compares the acoustic and auditory-perceptual characteristics of uttered phones on a frame-by-frame basis. In doing so, it utilizes a similarity measure based on radial basis function kernel or RBF kernel, which is compared with a Euclidean distance measure that was used in (Koniaris and Engwall, 2011; Koniaris et al., 2013). The motivation for this arrives from the fact that the data become sparse in a high dimensional space and hence choosing RBF kernel seems a more suitable solution since it is considered more appropriate for such conditions (Braun et al., 2008). Roughly speaking, the method performs a comparison between speech sounds generated by a group of native speakers with the corresponding speech sounds generated by different L2 groups of speakers. This is done separately for each phoneme category and the uttered phones are transformed into their auditory representations for the native speech, and into their spectrum representations for the non-native speech. In each domain, a distortion measure based on the RBF kernel is computed for each speech frame and then the two distortion measures are explored – considering all the frames – to investigate, quantitatively, the similarities between the native and the non-native phones.
The paper is organized as follows. Section 2 presents the method and implementation issues, Section 3 discusses the experiments and the findings and finally Section 4 provides conclusions.
2
Method
The underlying idea behind the pronunciation error detection method that is described here is based on the auditory ability of a native speaker to discriminate the mispronounced phonemes produced by L2 speakers while hearing them speaking. The diagnostic evaluation of the pronunciation errors is done on the speech signal level by comparing the similarities between the auditory perceptual domain of the native speech and the power spectrum domain of the non-native speech. It is assumed that a non-native acoustic representation will have very similar characteristics to native provided that the non-native speech is produced without significant mispronunciation. On the other hand, if the non-native speech suffers from severe pronunciation errors then the two representations, of the L2 and L1 speakers, will differ a lot and thus the measured similarities will become minimal (Koniaris et al., 2013).
In short, the approach tries to measure the distortion in a set of phones that belong to a specific
phoneme, produced by a group of native speakersnand compare it to that of non-native
speakers of some specific language backgroundℓ. For this, it is assumed that some form of
acoustic representationxis extracted from the speech signalsof a phonepto evaluate the
distortion measureφin the corresponding transformed domain, whereφ:RN×RN →R+,
withR+denoting the non-negative real numbers andNindicating the dimensionality of the
vectorx. Then, the RBF kernel-based similarity measure is,
φ(si,ˆsi,j) = eγkx(si)−x(ˆsi,j)k
2
, (1)
wherei∈Zis the index of the considered speech frame,ˆsi,jis thej’th perturbation ofsithat
is used to compute distortion andγ=−21σ2. It is noted thatσwill determine the size of the
considered area aroundsi. An analogous measure is defined for the auditory perception domain
a RBF kernel-based distortion measure is computed in the auditory domainυ:RM×RM→R+,
whereMis the dimensionality of the internal representationy, as
υ(si,ˆsi,j) = eγky(si)−y(ˆsi,j)k
2
. (2)
The above distortion measures of Eqs. (1) and (2) are then compared using the following similarity measure
A = 1
I
X
i∈I
1
Ji
X
j∈Ji
υ(si,ˆsi,j)−φ(si,ˆsi,j)
2
, (3)
wherei∈ I and j∈ Jirepresent a finite frame sequence and a finite set of acoustic
perturba-tions, respectively. This measure is used to find mispronunciations as described in (Koniaris
et al., 2013), i.e., by computing the distortion measureυ(si,ˆsi,j)using only native speech
and the spectral distortion measureφ(si,ˆsi,j), calculated separately for non-native (and thus
computingAℓ) and native speech (and thus computingAn). Finally, thenative-perceptual
assessment degree (nPAD)is computed for every phoneme and L1 background as
nPAD=Aℓ An
, (4)
which is a normalized ratio that shows the degree of the similarity between the native perceptual outcome and the non-native speech signal representation, as compared to the native-only case. The higher the nPAD value is, the more problematic the L2 phoneme is.
2.1
Practical implementation
Consideringpto be a phone that a speaker has produced, the speech power spectrumx(p)can
be seen simply as a function ofpthat maps this phone onto the spectral domain. If additionally
is considered a small area aroundp, a local approximation is possible using the Taylor series
expansion, thus
x(ˆp)≈x(p) +Jx[ˆp−p], (5)
whereJx=∂x
(p)
∂ˆp
ˆ
p=p
andpˆis the perturbed phone. Assuming that the small distortion[ˆp−p]
remains the same independently of the language background of the speaker, Eq. (5) can be used
either for native speechxnor non-native speechxℓof a language backgroundℓ. This means
that is possible to find a linearized relation between these two and compute the speech power spectrum distortion in a non-native subspace into the native speech power spectrum domain. Thus,
xℓ(ˆp)≈xℓ(p) +Wℓ[xn(ˆp)−xn(p)], (6)
whereWℓ=Jxℓ[Jxn]−1. Eq. (6) implies that a differentWℓshould be calculated for each frame.
However, the duration of phones or silence mismatches between the native and non-native speech signal prevent such computation. In addition, the matrices are non-invertible. Therefore
the estimation ofWℓ is done by considering a common matrix for all framesiof a specific
L2 group of speakersℓ. In speech processing is often assumed that a speech signal follows a
Gaussian distribution. Thus, Eq. (6) can be expressed asN(µℓ,Σℓ)∼ N(Wℓµn,WℓΣn[Wℓ]T),
whereµℓ,µnare the mean vectors of the distortion in non-native and native speech signals,
Considering a matrix decomposition (e.g., eigendecomposition), the two covariance matrices can be expressed as
Σζ=VζSζ[Vζ]T, (7)
whereζ=nfor the native language group, andζ=ℓfor the non-native language group. Next,
assuming the following distributions
Z ∼ N([Vn]Tµn,[Vn]TΣnVn)
Q ∼ N([Sn]−
1 2µ
Z,[Sn]−
1 2Σ
Z[Sn]−
T 2),
K ∼ N([SL]
1
2µQ,[SL] 1 2ΣQ[SL]
T 2),
Ψ ∼ N(VLµK,VLΣK[VL]T), (8)
and performing a decomposition in each of them, it can be proved that matrixWℓis given by
Wℓ=Vℓ[Sℓ] 1 2[S
n]−
1 2[V
n]T. (9)
Then, the power spectrum distortion measure for the non-native speech signal is calculated as
φℓ(xℓi,ˆxℓi,j)
∼
=φℓ(xni,ˆxni,j;xℓi,ˆxℓi,j)≈[xni−ˆxni,j]
T[W
ℓ]TWℓ[xni−ˆxni,j], (10)
wherei∈ I,j∈ Ji.
As mentioned above, a small area is considered around each phone. In practice, this is done by allowing small perturbations, i.e., adding 30 dB SNR independent and identically distributed
(i.i.d.) Gaussian noise to eachxiand generate a set of 100 vectorsˆxi,jfor the native speech
datanas well as for non-native speech data of all language backgroundsℓ. All data from native
speech are used to calculate the perceptual distortion measure Eq. (2) on a frame by frame basis by exploiting auditory information from the psychoacoustic model presented in (van de Par
et al., 2002). Analogously, all data from non-native speech of each language groupℓare used to
compute Eq. (1) and, separately, all data from native speech, too. Next, the similarity measure
Aℓis calculated using the native perceptual distortion and the non-native spectral distortion
measures and also the corresponding similarity measure for the native speakersAnusing the
native perceptual and spectral measures. Then for each phoneme class, the RBF kernel-based
nPADΘr b fℓ is computed for every L2 background using Eq. (4). Finally, a Euclidean-based
nPADΘℓ, described in (Koniaris and Engwall, 2011; Koniaris et al., 2013), is calculated by
considering Euclidean distances in Eqs. (1) and (2), i.e.,φ(si,ˆsi,j) =kx(si)−x(ˆsi,j)k2and
υ(si,ˆsi,j) =kx(si)−x(ˆsi,j)k2, respectively.
3
Experiments
This section describes the experiments and discusses the findings of the RBF kernel-based approach in relation to the Euclidean-based approach and the theoretical linguistic survey presented in (Bannert, 1984).
3.1
Speech data
L1 bkgr. male/female utt. L1 bkgr. male/female utt. L1 bkgr. male/female utt.
Eng.(US) 1/1 318 Russian 1/3 583 Arabic 0/1 164
German 2/0 249 Greek 3/0 393 Chinese 2/3 832
French 3/0 347 Spanish 4/1 882 Persian 3/3 987
Polish 0/2 317 Turkish 4/0 604 Swedish 9/2 888
Table 1: Distribution of the total number of male and female speakers and the number of utterances (utt.) for each language background (L1 bkgr.).
students repeated a word or sentence after the virtual language tutor, the main character of the program. The procedure was simple; first, the animated agent produced an utterance – a pre-recorded natural speech produced by a native speaker – accompanied by a subtitle text and the student repeated afterwards.
The total number of participants was 37 of which 23 were male students and 14 female, from 11 different language backgrounds as it is shown in Table 1. The data recordings took place twice within one month’s time, before and after practicing at home. The duration of each recording session was approximately 30 minutes. In addition, 9 male and 2 female Swedish speakers without regional accent varieties were also recorded once each. Non-linguistic information, such as coughs, long pauses, repetitions or fillers was excluded from the final corpus used for experiments. Each speech file was accompanied by a text file, the content of which was adjusted to the actual utterance, thus any deletion or insertion that may have occurred was not considered into the text file. A phone-level transcription was then automatically generated from the speech signal and the text file, using an HMM-based aligner (Sjölander, 2003). These phone-level transcription files were used to separate the speech data into phoneme categories. The material contained all Swedish phonemes, but the two short and more open pre-r allophones
/æ/,/œ/and the retroflexes/ï/,/ã/, and/í/were not considered in the experiments because
the number of occurrences in the database was not sufficiently large.
For each language background, the speech data were divided into different phoneme categories according to the phone-level transcription files. The speech signal was first pre-emphasized and then windowed every 25 ms with an overlap of 10 ms using a Hamming window. A discrete Fourier transform of 512 points was applied to the windowed frame to compute the signal’s power spectrum.
3.2
Results
This section deals with the experiments and results of the described method. The goal is to identify a list of the most problematic phonemes for a given group of L2 speakers using previously recorded data. Hence, the experiments are done offline and the error detection was not made on an utterance basis but on the whole data for each phoneme category. The method is focusing on repeated mispronunciations made by the L2 speakers that deviate from the L1 speakers. Only the speech signal is considered without further linguistic or paralinguistic information. The list of problematic phonemes for each language group is then compared to a linguistic study (Bannert, 1984).
Table 2 lists the vowels identified by the PED algorithms as being problematic for the different groups of non-native speakers. For each L2 speaker group, the first line shows, in decreasing
L1 bkgr. nPAD ver. detected phonemes missed phonemes accord. to Bannert (1984)
English Θℓ æ:,E,y:,u:,U,œ:,E:,ø,8,ø:, (i:),A:, (@),e:,e,O,a,0: Y,o:
(US) Θr b f250ℓ e:,E:,æ:,A:,Y,ø:,E,a,0:, (i),y:, (@), (i:),O,8,U,o:,e u:,œ:,ø
Θr b f500ℓ æ:,E:,e:,A:,E,ø:,Y,a,0:, (i),y:, (@), (i:),e,œ:,O,8,U u:,o:,ø
Θr b fℓ 1000 æ:,E:,e:,E,A:,ø:,Y,a,0:,œ:,e, (i),ø, (@),y:, (i:),O,8 u:,o:,U
German Θℓ æ:, (E),y:,u:, (U),E:, (ø),œ:,ø:,i:,@,A: 0:,8,Y
Θr b f250ℓ æ:, (e:),Y,ø:,A:,0:,E:, (i),y:, (a),@,i: u:,8,œ:
Θr b f500ℓ æ:, (e:),Y,ø:,A:,E:,0:, (a), (i),y:,@,i: u:,8,œ:
Θr b fℓ 1000 æ:,ø:,Y, (e:),A:,E:, (a),0:, (i),œ:,y:,@ u:,8,i:
French Θℓ æ:,E,y:,u:,œ:, (U),E:, (ø),8,ø:,i:,@,A:,e:,e,O, (a) 0:,o:,Y
Θr b f250ℓ e:,E:,æ:,Y,ø:,A:,0:, (a), (i),y:,i:,@,E,O,o:, (U),8 u:,œ:,e
Θr b f500ℓ æ:,e:,E:,Y,ø:,A:, (a),0:,E, (i),y:,@,i:,œ:,O,e,o: u:,8
Θr b f1000
ℓ æ:,E:,e:,ø:,Y,A:,E, (a),œ:,0:, (i), (ø),e,y:,@,i:,O u:,8,o:
Polish Θℓ æ:, (E),y:,u:,œ:, (U),E:,ø,8,ø:,i:,A:,@,e:, (e), (O) 0:,Y,o:,a
Θr b f250ℓ e:,E:,æ:,A:,Y,ø:, (E),a,0:, (i),y:,i:,@, (O),o:,8 u:,ø,œ:
Θr b f500
ℓ æ:,E:,e:,A:, (E),ø:,Y,a,0:, (i),y:,@, (e),i:,œ:, (O) u:,8,o:,ø
Θr b fℓ 1000 æ:,E:, (E),e:,A:,ø:,Y,a,œ:,0:, (e), (i),ø,@,y:,i: u:,o:,8
Russian Θℓ E,y:,E:,ø,ø:,i:,A:,8,e:,e,0:,a, (O),Y, (@), (i),œ: u:,æ:,o:
Θr b f250ℓ Y,E:,0:,ø:,y:,e:,A:,i:,a,8, (O),æ:, (i), (@),œ:,e,u: ø,o:,E
Θr b f500ℓ Y,E:,0:,ø:,y:,e:,A:,a,œ:,i:,æ:,ø,8,e, (O), (i), (@) u:,o:,E
Θr b fℓ 1000 Y,E:,ø:,0:,œ:,ø,A:,e:,y:,a,i:,e,æ:,E,8, (O), (i) u:,o:
Greek Θℓ æ:, (E),y:,u:,œ:, (U),E:,ø,8,ø:,i:,A:,@,e:,e, (O) 0:,Y,o:
Θr b f250ℓ E:,e:,æ:,A:,Y,ø:, (E), (a),0:, (i),y:,i:,@, (O),8,o: u:,ø,œ:,e
Θr b f500ℓ æ:,E:,e:,A:, (E),Y,ø:, (a),0:, (i),y:,@,e,i:,œ:, (O) u:,8,o:,ø
Θr b fℓ 1000 æ:,E:, (E),e:,A:,ø:,Y, (a),œ:,e,0:, (i),ø,@,y:,i: u:,8,o:
Spanish Θℓ u:,æ:,E,ø,i:,8,e:,e,ø:, (a),0:,A:, (i),@,Y, (O),o: y:,E:,œ:
Θr b f250ℓ 0:,æ:,e:, (a),E:,i:,Y, (i),8,A:,ø:,@, (O),e,œ:,o:, (U) u:,y:,E,ø
Θr b f500ℓ 0:, (a),e:,Y,i:, (i),E:,A:,8,œ:,æ:,ø:,e,@, (O),E,ø u:,y:,o:
Θr b fℓ 1000 0:, (a),e:,Y, (i),i:,œ:,e,ø,ø:,E,8,A:,@,æ:,E:, (O) u:,y:,o:
Turkish Θℓ æ:, (E),y:, (E:), (ø),u:,8,U,ø:,i:,A:,e:, (@) e,0:,o:,œ:
Θr b f250ℓ e:, (E:), (Y),ø:,æ:, (a),0:, (i),A:,i:,y:, (O), (@) e,u:,U,8,o:,œ:
Θr b f500ℓ e:, (Y),æ:, (E:),ø:, (a),A:, (i),0:, (E),i:,y:, (O) e,u:,U,8,o:,œ:
Θr b fℓ 1000 e:,æ:, (Y), (E:),ø:, (a), (E),A:, (i),0:, (o),œ:,e u:,U,8,o:,y:,i:
Arabic Θℓ æ:,E,y:,u:,œ:, (U),E:,ø,8,ø:,i:,A:,@,e:,e, (O),a,0: Y,o:
Θr b f250ℓ e:,E:,æ:,A:,Y,ø:,E,a,0:, (i),y:,i:,@, (O),o:, (U),8,e u:,ø,œ:
Θr b f500ℓ æ:,e:,E:,A:,E,ø:,Y,a,0:, (i),y:,@,e,i:,œ:, (O), (U),8 u:,o:,ø
Θr b fℓ 1000 æ:, E:, e:,E,A:,ø:,Y,a,œ:,0:,e, (i),ø,@,y:,i:, (O),8 u:,o:
Chinese Θℓ 8,æ:,E,y:,u:,E:,ø,ø:,i:,A:,e:,e,O, (@),a,0:, (i),o: Y,œ:
Θr b f250ℓ 8,A:,0:,e:, (i),E:,ø:,æ:,i:,O,a,y:,o:, (@),u:,e, (U),œ: Y,ø,E
Θr b f500ℓ 8,A:,æ:,0:,E:,e:,ø:, (i),a,O,i:,y:,o:,œ:,e, (@),u:,E Y,ø
Θr b fℓ 1000 A:,æ:,E:,ø:,0:,e:, (i),a,œ:,O,e,i:,E,o:,y:,ø, (@),u: Y,8
Persian Θℓ 8,æ:,y:, (E),ø,ø:,Y, (i),0:,e:,a, (e), (A:),o:, (O) i:,u:,E:,œ:,@
Θr b f250ℓ 8,æ:, (e), (E),@,E:,a,ø:,e:,Y, (i),0:, (A:),u:,œ: i:,y:,o:,ø
Θr b f500ℓ æ:,8, (e), (E),ø:,@,E:,œ:,0:,ø,Y,e:,a, (i), (A:) i:,u:,y:,o:
[image:7.420.56.367.38.511.2]Θr b fℓ 1000 æ:,ø:,ø,œ:,E:, (e), (E),8,Y,0:, (i),@,e:, (A:),a i:,y:,o:,u:
Θℓ Θ r b f250
ℓ Θ
r b f500
ℓ Θ
r b f1000 ℓ
Better performance in no. of language groups 3 2 3 4
Mismatches with theory (total) 19.2% 22.0% 20.9% 19.2%
Seriously problematic phonemes missed (total) 21.3% 22.0% 26.0% 25.2%
Mismatches in top 5 phonemes 8 7 8 7
Seriously problematic captured in top 5 phonemes 34 35 34 34
Table 3: Summary of findings for vowels.
the second, third and fourth lines show the results of the RBF kernel-based nPADΘℓr b f for
σ2=0.002, 0.001 and 0.0005, respectively. These are shown in table asΘr b fℓ 250,Θℓr b f500and
Θℓr b f1000, respectively becauseγin Eqs. (1) and (2) becomes 250, 500 and 1000, respectively.
As ground truth is considered the linguistic survey described in (Bannert, 1984). False rejections according to (Bannert, 1984) are indicated in parentheses and false accepts according to (Bannert, 1984) are listed in the right-most column. Some phonemes are shown underscored. These are the seriously problematic phonemes according to (Bannert, 1984), i.e., they are totally mispronounced by the non-native speakers. Generally, the nPAD methods capture most of the common errors made by each language group when its members are trying to learn
Swedish. The Euclidean-based nPADΘℓis better for American English, Spanish and Turkish
speakers. The RBF kernel-based nPADΘℓr b f250is better for Polish,Θr b fℓ 500is better for French
and Chinese andΘr b fℓ 1000is better for Russian, Greek, Arabic and Persian speakers. For the
German speaking group bothΘℓr b f250andΘℓr b f500perform equally well.
Table 3 summarizes the findings of the approaches for vowels. The Euclidean-based measure achieves a lower percentage of mismatches with the theoretical linguistic findings and also misses less seriously mispronounced vowels compared to the RBF kernel-based measures. On
the other hand,Θℓr b f250captures the most seriously problematic vowels of all methods when
looking only at the top 5 vowels of the list of problematic ones and also has the least mismatches with Bannert, again when only the five most problematic phonemes according to the method
are considered.Θr b fℓ 500seems not achieving better performance compared to the rest of the
methods according to the table list and finally,Θr b fℓ 1000is generally performing better in more
groups of L2 speakers, has the least mismatches with theory (asΘℓdoes, too) and also has less
mismatches when only the top 5 most problematic vowels are considered (the same asΘℓr b f250).
The reported findings show clearly that for many groups of L2 speakers the open pre-r allophone
/æ:/is very problematic as it appears most of times at the top of the problematic vowels. Another
vowel that appears problematic is/E:/, which is often not pronounced with a long duration
as it is supposed but rather short, often being replaced by/E/. Generally, it is revealed that
most of the foreign speakers face difficulties when trying to produce the Swedish long vowels.
Hence,/0:/,/A:/and/e:/are vowels that both the tested methods and Bannert’s linguistic
survey diagnose as seriously problematic for most of the L2 groups.
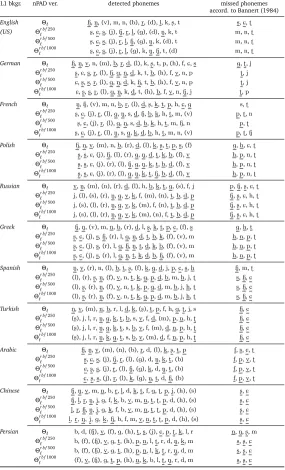
Table 4 lists the consonants that are diagnosed as being mispronounced by the L2 groups. As in Table 2, the first row shows, in decreasing order, the most deviating consonants according
to the Euclidean-based nPADΘℓand the following rows the three RBF kernel-based nPADs
Θℓr b f250,Θr b fℓ 500andΘr b fℓ 1000, respectively.Θℓis better for French, Greek, Spanish and Turkish
L1 bkgr. nPAD ver. detected phonemes missed phonemes accord. to Bannert (1984)
English Θℓ Ê,N, (v),m,n, (b),r, (d),l,k,ù,t s,C,ú
(US) Θℓr b f250 ù,C,s, (j),Ê,r,l, (g), (d),N,k,t m,n,ú
Θℓr b f500 ù,C,s, (j),r,l,Ê, (g),N,k, (d),t m,n,ú
Θℓr b f1000 ù,C,s, (j),r,l, (g),k,N,Ê,t, (d) m,n,ú
German Θℓ Ê,N,v,n, (m),b,r,d, (l),k,ù,t,p, (h),f,C,s g,ú,j
Θℓr b f250 ù,C,s,r, (l),Ê,g,N,d,k,t,b, (h),f,v,n,p ú,j
Θℓr b f500 C,ù,s,r, (l),g,N,d,k,Ê,t,b, (h),f,v,n,p ú,j
Θℓr b f1000 C,ù,s,r, (l),g,N,k,d,t, (h),b,f,v,n,Ê,j ú,p
French Θℓ N,Ê, (v),m,n,b,r, (l),d,ù,k,t,p,h,C,g s,ú
Θℓr b f250 ù,C, (j),r, (l),g,N,s,d,Ê,b,k,h,t,m, (v) p,ú,n
Θℓr b f500 ù,C, (j),r, (l),g,N,s,d,b,k,h,t,m,Ê,n p,ú
Θℓr b f1000 ù,C, (j),r, (l),N,s,g,k,d,b,h,t,m,n, (v) p,ú,Ê
Polish Θℓ Ê,N,v, (m),n,b, (r),d, (l),k,ù,t,p,s, (f) g,h,C,ú
Θℓr b f250 ù,s,C, (j),Ê, (l), (r),g,N,d,t,k,b, (f),v h,p,n,ú
Θr b f500
ℓ ù,s,C, (j), (r), (l),Ê,g,N,k,t,b,d, (f),v h,p,n,ú
Θℓr b f1000 ù,s,C, (j), (r), (l),g,N,k,t,Ê,b,d, (f),v h,p,n,ú
Russian Θℓ v,N, (m), (n), (r),d, (l),h,b,k,t,g, (s),f,j p,Ê,ù,C,ú
Θℓr b f250 j, (l), (s), (r),N,g,v,k,f, (m), (n),t,b,d,p Ê,ù,C,h,ú
Θℓr b f500 j, (s), (l), (r),N,g,v,k, (m),f, (n),t,b,d,p Ê,ù,C,h,ú
Θℓr b f1000 j, (s), (l), (r),N,g,v,k, (m), (n),f,t,b,d,p Ê,ù,C,h,ú
Greek Θℓ Ê,N, (v),m,n,b, (r),d,l,ù,k,t,p,C, (f),s g,h,t
Θℓr b f250 ù,C, (j),s,Ê, (r),l,g,N,d,t,b,k, (f), (v),m h,n,p,ú
Θℓr b f500 ù,C, (j),s, (r),l,g,Ê,N,t,d,k,b, (f), (v),m h,n,p,ú
Θℓr b f1000 ù,C, (j),s, (r),l,g,N,t,k,d,b,Ê, (f), (v),m h,n,p,ú
Spanish Θℓ N,v, (r),n, (l),b,t,ù, (f),k,g,d,j,p,C,s,h Ê,m,ú
Θℓr b f250 (l), (r),ù,N, (f),v,n,t,k,g,p,d,b,m,h,j,ú s,Ê,C
Θℓr b f500 (l),ù, (r),N, (f),v,n,t,k,p,g,d,m,b,j,h,ú s,Ê,C
Θℓr b f1000 (l),ù, (r),N, (f),v,n,t,k,g,p,d,m,b,j,h,ú s,Ê,C
Turkish Θℓ N,v, (m),n,b,r,l,d,k, (ù),t,p,f,h,g,ú,j,s Ê,C
Θℓr b f250 (ù),j,l,r,N,g,k,t,b,s,v,f,d, (m),p,n,h,ú Ê,C
Θℓr b f500 (ù),j,l,r,N,g,k,t,s,b,v,f, (m),d,n,p,h,ú Ê,C
Θℓr b f1000 (ù),j,l,r,N,k,g,t,s,b,v, (m),d,f,n,p,h,ú Ê,C
Arabic Θℓ Ê,N,v, (m), (n), (b),r,d, (l),k,ù,t,p f,s,C,ú
Θℓr b f250 ù,C,s, (j),Ê,r, (l), (g),d,N,k,t, (b) f,p,v,ú
Θℓr b f500 C,ù,s, (j),r, (l),Ê, (g),k,d,N,t, (b) f,p,v,ú
Θℓr b f1000 C, ù,s, (j),r, (l),k, (g),N,t,d,Ê, (b) f,p,v,ú
Chinese Θℓ Ê,N,v,m,n,b,r,l,d,k,t,f,g,ú,p,j, (h), (s) ù,C
Θℓr b f250 Ê,l,r,N,j,g,f,k,b,v,m,n,t,ú,p,d, (h), (s) ù,C
Θℓr b f500 l,r,Ê,N,j,g,k,f,b,v,m,n,t,ú,p,d, (h), (s) ù,C
Θℓr b f1000 l, r, N, j, g, k, Ê,b,f,m,v,n,t,ú,p,d, (h), (s) ù,C
Persian Θℓ b,d, (Ê),v, (f),g, (h),t,s, (j),C,p,ú,k,l,r n,N,ù,m
Θℓr b f250 b, (f), (Ê),v,g,t, (h),p,n,l,ú,r,d,N,k,m s,ù,C
Θℓr b f500 b, (f), (Ê),v,g,t, (h),p,n,l,k,ú,r,N,d,m s,ù,C
Θℓr b f1000 (f),v, (Ê),g,t,p, (h),n,k,b,l,ú,N,r,d,m s,ù,C
[image:9.420.72.357.45.515.2]Θℓ Θ r b f250
ℓ Θ
r b f500
ℓ Θ
r b f1000 ℓ
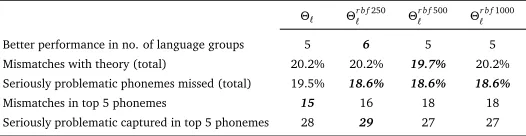
Better performance in no. of language groups 5 6 5 5 Mismatches with theory (total) 20.2% 20.2% 19.7% 20.2% Seriously problematic phonemes missed (total) 19.5% 18.6% 18.6% 18.6%
Mismatches in top 5 phonemes 15 16 18 18
[image:10.420.82.345.42.110.2]Seriously problematic captured in top 5 phonemes 28 29 27 27
Table 5: Summary of findings for consonants.
equally better for American English, German, Russian and Arabic speakers in comparison to the
Euclidean-based measure. Finally,ΘℓandΘℓr b f250are better for the Polish group andΘℓr b f250
andΘℓr b f500for the Chinese speakers.
Table 5 summarizes the findings of the Table 4. The Euclidean-based measure has less mis-matches with Bannert in the top five most problematic consonants as compared to the RBF
kernel-based approaches.Θr b fℓ 250is better in most language groups and can better capture the
seriously problematic consonants both when the focus is on the five most problematic ones, but also in terms of the total number of the seriously problematic consonants (although in the latter
case, all three RBF kernel-based approaches perform equally good). In addition,Θr b fℓ 500has
the least mismatches with the linguistic study.
The Swedish retroflex/ù/is very problematic according to the reported results and likewise
the unique "sje-sound"/Ê/, a rounded velar fricative that does not exist in other languages.
Moreover, many L2 speakers seem to have problems producing the velar nasal/N/, which is
commonly mispronounced as/Ng/. Another difficult consonant is the fricative/C/that is also
one of the most problematic sounds for second language speakers of Swedish.
In summary, RBF kernel generally seems to work better for consonants vis-à-vis vowels when compared with (Bannert, 1984) but also with the Euclidean distance measure. A small improve-ment in the percentage of the seriously problematic consonants is confirmed – accomplished by all three RBF-based measures – compared to the Euclidean measure. The figures remain better even in the case in which only the five most problematic consonants are taken into account. The results of the RBF kernel metrics are still in a better agreement with linguistic findings in comparison to the Euclidean-based one. On the other hand for the case of vowels, the two metrics perform nearly the same based on the criteria listed in Table 3. While for
instance,Θℓis better considering the total number of mismatches with theory and, in addition,
misses less seriously problematic vowels according to Bannert’s study,Θℓr b f250has a slightly
better performance when concentrating on the five most problematic vowels andΘℓr b f1000is
mainly preferable for more L2 groups compared to the rest of the metrics. Generally speaking, RBF-kernel may be considered to outperform to a small extent the Euclidean measure, though the two measures do not have major differences and they both seem to work well and achieve positive results as they regurarly agree with Bannert’s linguistic survey. It is noted that the intention of the research described in this paper was to investigate alternative measures for the perceptually-motivated PED approach and carry out experiments to explore their behavior. Moreover, the deviations from the theoretical findings that both distance measures have can,
for the most part, be explained by the nature of the two studies (theoretical linguisticvs.
analysis. The computational methods do not consider many linguistic aspects, such as context and influence from preceding or succeeding phonemes. In addition, the PED methods aim at diagnosing mispronunciations made by the examined learners and are not designed to be used for identifying general problems related to the L1 of a group of speakers as Bannert’s study was. It is noted that Bannert collected data from L2 speakers that were not influenced by repeating after a native speaker. The reason was that the study was aimed at making an inventory of mispronunciations for various groups of L2 students that would be used as a reference list for the teachers of Swedish as a second language. This may partly explain why some of the seriously problematic phonemes in Bannert’s study were not diagnosed likewise with the nPAD approaches.
4
Conclusions
References
Bannert, R. (1984). Problems in learning Swedish pronunciation and in understanding foreign
accent.Folia Linguistica, 18(1-2):193–222.
Braun, M. L., Buhmann, J. M., and Müller, K.-R. (2008). On relevant dimensions in kernel
feature spaces.J. Machine Learn. Research, 9:1875–1908.
Delmonte, R. (2000). SLIM prosodic automatic tools for self-learning instruction. Speech
Communication, 30(2-3):145–166.
Flege, J. E. (1995).Second-language speech learning: theory, findings, and problems. Strange,
W. (Ed.), Speech Perception and Linguistic Experience: Theoretical and Methodological Issues in Cross-Language Speech Research. Timonium, MD: York Press Inc.
Franco, H., Neumeyer, L., Kim, Y., and Ronen, O. (1997). Automatic pronunciation scoring for
language instruction. InIEEE Int. Conf. Acoust., Speech, Sig. Proc., Munich, Germany, pages
1471–1474.
Guion, S. G., Flege, J. E., Ahahane-Yamada, R., and Pruitt, J. C. (2000). An investigation of current models of second language speech perception: the case of japanese adults’ perception
of english consonants.J. Acoust. Soc. Am., 107(5):2711–2724.
Koniaris, C. and Engwall, O. (2011). Phoneme level non-native pronunciation analysis by
an auditory model-based native assessment scheme. InInterspeech, Florence, Italy, pages
1157–1160.
Koniaris, C., Salvi, G., and Engwall, O. (2013). On mispronunciation analysis of individual
foreign speakers using auditory periphery models.Speech Communication, 55(5):691–706.
Neumeyer, L., Franco, H., Digalakis, V., and Weintraub, M. (2000). Automatic scoring of
pronunciation quality.Speech Communication, 30:83–93.
Neumeyer, L., Franco, H., Weintraub, M., and Price, P. (1996). Automatic text-independent
pronunciation scoring of foreign language student speech. InInt. Conf. Spoken Lang. Proc.,
Philadelphia, PA , USA, pages 1457–1460.
Park, J. G. and Rhee, S. C. (2004). Development of the knowledge-based spoken english
evaluation system and its application. InISCA Interspeech, Jeju Island, South Korea, pages
1681–1684.
Piske, T., Flege, J., and MacKay, I. (2001). Factors affecting degree of foreign accent in an l2:
a review.J. Phonetics, 29(2):191–215.
Raux, A. and Kawahara, T. (2002). Automatic intelligibility assessment and diagnosis of critical
pronunciation errors for computer-assisted pronunciation learning. InInt. Conf. Spoken Lang.
Proc., Denver, CO, USA, pages 737–740.
Sjölander, K. (2003). An HMM-based system for automatic segmentation and alignment of
speech. InFonetik, pages 93–96.
Strik, H., Truong, K., de Wet, F., and Cucchiarini, C. (2009). Comparing different approaches
Tepperman, J. and Narayanan, S. (2005). Hidden-articulator markov models for pronunciation
evaluation. InProc. ASRU, San Juan, Puerto Rico, pages 174–179.
Tepperman, J. and Narayanan, S. (2008). Using articulatory representations to detect
segmen-tal errors in nonnative pronunciation.IEEE Tr. Audio, Speech, Lang. Proc., 16(1):8–22.
Truong, K. P., Neri, A., de Wet, F., Cucchiarini, C., and Strik, H. (2005). Automatic detection
of frequent pronunciation errors made by L2-learners. InISCA Interspeech, Lisbon, Portugal,
pages 1345–1348.
van de Par, S., Kohlrausch, A., Charestan, G., and Heusdens, R. (2002). A new psychoacoustical
masking model for audio coding applications. InIEEE Int. Conf. on Acoust., Speech, Sig. Proc.,
Orlando, FL, USA, volume 2, pages 1805–1808.
Wei, S., Hu, G., Hu, Y., and Wang, R.-H. (2009). A new method for mispronunciation detection
using support vector machine based on pronunciation space models.Speech Communication,
51(10):896–905.
Weigelt, L. F., Sadoff, S. J., and Miller, J. D. (1990). Plosive/fricative distinction: the voiceless
case.J. Acoust. Soc. Am., 87:2729–2737.
Wik, P. and Hjalmarsson, A. (2009). Embodied conversational agents in computer assisted
language learning.Speech Communication, 51(10):1024–1037.
Witt, S. M. and Young, S. (2000). Phone-level pronunciation scoring and assessment for
interactive language learning.Speech Communication, 30:95–108.
Xu, S., Jiang, J., Chen, Z., and Xu, B. (2009). Automatic pronunciation error detection based
on linguistic knowledge and pronunciation space. InIEEE Int. Conf. Acoust. Speech Sig. Proc.
(ICASSP), Taipei, Taiwan, pages 4841–4844.
Yamashita, Y., Kato, K., and Nozawa, K. (2005). Automatic scoring for prosodic proficiency
of english sentences spoken by japanese based on utterance comparison.IECE Trans. Inform.