the Best Value approach
Proposed process for developing and using performance
indicators for infrastructural projects approached with Best Value
ii
Performance indicators in
the Best Value approach
Proposed process for developing and using
performance indicators for infrastructural projects
iii
performance indicators for infrastructural projects approached with Best Value
Author A. (Allard) Horstman BSc
Student number s0149373
University University of Twente
Faculty of Engineering Technology
Drienerlolaan 5 7522 NB Enschede P.O. Box 217 7500 AE Enschede
Master programme Civil Engineering & Management
University supervisors dr. J.T. (Hans) Voordijk
dr. S.H.S. (Saad) Al-Jibouri
Organisation Rijkswaterstaat Major Projects and Maintenance
Rijkswaterstaat Grote Projecten en Onderhoud
Section Advice Procurement, Contract Management and Lead Auditing
Afdeling Inkoop, Contractmanagement en Leadauditing
Griffioenlaan 2 3526 LA Utrecht P.O. Box 24057 3502 MB Utrecht
Organisation supervisor drs. W. (Wiebe) Witteveen
Date 17 September 2013
Status Final version – public
Cover photo Zuid-Willemsvaart (Rijkswaterstaat, 2012a):
iv
The preparation of this graduation period started almost a year ago, when I contacted Wiebe Witteveen of Rijkswaterstaat and asked him about the opportunities to graduate on Best Value Procurement. Not long before, my supervisor at the university told me about Best Value. The innovative approach took my attention and eventually, Wiebe and I chose the subject of performance indicators in Best Value. This was an under researched topic in Best Value and it had the interest of the Best Value core team at Rijkswaterstaat. Now, at the end of my seven-month research, I can say that performance indicators are of increasing importance in Rijkswaterstaat’s Best Value projects. I believe that measuring is the key to successful learning and development in and over projects.
Of course, I would like to thank my organisation supervisor Wiebe for all his help during my graduation period and for giving me the opportunity to graduate at Rijkswaterstaat. From the beginning, you gave me confidence in this research and I enjoyed working with you. Good luck the coming years with your doctoral research! I would also like to thank the other members of the Best Value core team of Rijkswaterstaat. Johannes, Wouter, Jolanda, and Gül: thank you for your help, your critical but supporting comments, the numerous interesting discussions and the great working atmosphere. I thank my colleagues from the section IMG/AICL for the nice, though sometimes tough, graduation time and my university supervisors Hans Voordijk and Saad Al-Jibouri for their time to supervise this research, for their support and the fruitful discussions during my graduation.
For this graduation, I moved to Utrecht. My friends in Utrecht, Bart and Jeroen, were a great support during this time. Also other (study) friends who contributed to this research: thank you.
Of course, I would like to thank all the interviewees that contributed to this research, both from Rijkswaterstaat and market parties. Without your help, this research was not possible. Your willingness to participate in this research underlined the relevance of research on performance indicators in Best Value projects and is greatly appreciated.
After this research and my graduation, I will start as trainee at Rijkswaterstaat. During my graduation, I got fascinated of the work of Rijkswaterstaat and decided to apply for trainee. I would like to thank everyone who supported me in this process. I am looking forward to really start working at Rijkswaterstaat and to contribute to the civil engineering and landscape of the Netherlands.
Allard Horstman
v
method where the focus is not on lowest price, but on the best price-value ratio. It is a procurement, project management, and risk management approach, based on the concepts of win-win, less management, direction and control, and transparency. The approach consists of three phases: selection, clarification, and execution.
The goal of the selection phase is to select the expert contractor with a high value for a low price. While traditional procurement is based on comprehensive tenders, the Best Value approach requires suppliers to deliver three two-page submittals, namely a project capability submittal, risk assessment plan, and a value-added plan. After that, interviews are held with key personnel of the suppliers, to find out whether they can manage the project and identify risks upfront. In both the submittals and the interviews, suppliers can use verifiable performance information to support their claims in a short and clear way. Moreover, they can propose performance indicators for the execution phase, in order to show how they measure the claims during the project. The selection phase ends with a prioritised list of suppliers. The submittals and interviews count for 75% and the price for only 25%.
The best-prioritised supplier proceeds to the pre-award clarification phase. In this phase, the prospective contractor pre-plans the project, aligns the expectations with the client, develops risk mitigation measures for all project risks, and develops a set of performance indicators, if not done in the selection phase. When the clarification phase is run successfully by the prospective contractor, the contract is awarded.
During the execution phase, no management, direction and control has to be used by the client, since the selected contractor is the expert. To keep the client updated, the contractor has to send a Weekly Risk Report to the client each week. The performance indicators, as determined in the clarification phase and as measured by the contractor, are communicated by means of this report. If needed, risk mitigation measures have to be developed. The indicators provide transparency about the performance on project goals, about the allocation of risks, and they are the base of learning and improvement for both client and contractor. The performance information can be used by the contractor in a next tender. From the perspective of the Information Measurement Theory, the theory behind the Best Value approach, performance indicators are a form of so-called dominant information: they are non-disputable, verifiable, and accurate. They mitigate risk by transparency and enable experts to explain complex situations in a simple way to non-experts. From the perspective of New Institutional Economics, performance indicators in Best Value projects reduce uncertainty, take bounded rationality into account, and reduce the tendency to opportunistic behaviour.
vi
contractor of the goals of measuring causing a lack of motivation, (3) the lack of knowledge regarding the development and use, and (4) the availability of data and benchmarks. Furthermore, a quantitative analysis showed that more than 98% of risks in earlier Best Value projects are owned by the client, while most projects interviewed mainly measure the contractor. This research focuses on the lack of knowledge regarding the development and use, because most problems related to this subject.
First, theory on performance indicators in general, but especially in the construction sector is studied. This study shows that there is a wide range of performance indicators and characteristics for indicators. An analysis on these performance indicators and characteristics led to a set of characteristics for the development and use of performance indicators that is useful in Rijkswaterstaat’s Best Value projects.
Subsequently, the characteristics are put into a model. The model is developed by distributing the characteristics over six different steps. A draft version of the model is evaluated by project team members from both client and contractor of current Best Value projects. Based on the feedback of this evaluation, the model is refined and a final model is made. The steps in this final model include choosing the set of indicators, choosing indicators, development of indicators, incorporate in Weekly Risk Report, use during execution of the project, and evaluation. The model consists of 20 characteristics in total. The model is tested on two Best Value cases. In the first case, the model is used in a session with client and contractor during the clarification phase. During the session performance indicators are developed. After the session, the contractor further worked out these indicators. In the second case, the model is used as a checklist. Improvements are suggested by the client based on the model and subsequently the contractor further refined the indicators. In a set of five indicators, this led to 12 improvements that are directly related to the model.
vii
in het Nederlands ook wel prestatie-inkoop genoemd, is een opkomende methode waarbij de focus niet op laagste prijs is, maar op de beste prijs-kwaliteitsverhouding. Het is een aanbestedings-, projectmanagement- en risicomanagement-aanpak, gebaseerd op de concepten win-win, minder sturing en controle en meer transparantie. De aanpak bestaat uit drie fasen: selectie, onderbouwing en uitvoering.
Het doel van de selectiefase is om de inschrijver te selecteren die de ‘expert’ is en die een hoge waarde voor een lage prijs biedt. Waar traditionele aanbestedingen zijn gebaseerd op omvangrijke aanbiedingen, vraagt Best Value inschrijvers om drie plannen van elk twee pagina’s: een prestatie-onderbouwing, risicodossier opdrachtgever en een kansendossier. Vervolgens worden interviews gehouden met sleutelfunctionarissen van de mogelijk toekomstige projectteams van de opdrachtnemer, om zo erachter te komen of zij het project kunnen overzien en risico’s van tevoren kunnen identificeren. In zowel de plannen als de interviews kunnen inschrijvers verifieerbare prestatie-informatie gebruiken om hun claims op een korte en duidelijke wijze te onderbouwen. Bovendien kunnen zij hier al prestatie-indicatoren voorstellen welke in de uitvoering gemeten gaan worden, om zo de prestatie te meten van de gemaakte claims. De selectiefase eindigt met de beoordeling van de inschrijvers. De plannen en de interviews voor 75% meetellen en de prijs slechts voor 25%.
De best beoordeelde inschrijver gaat door naar de onderbouwingsfase, de fase voor de gunning. In deze fase plant de beoogd opdrachtnemer het gehele project, schakelt hij de verwachtingen met de opdrachtgever gelijk, maakt hij bij ieder risico een mitigerende maatregel en ontwikkelt hij een reeks prestatie-indicatoren, indien deze niet in de inschrijving vermeld waren. Als de onderbouwingsfase succesvol is afgerond door de beoogd opdrachtnemer volgt de gunning.
viii
Prestatie-indicatoren zijn niet gebruikt in de eerste projecten, maar opdrachtnemers zijn nu wel verplicht om ze te ontwikkelen en te gebruiken. Toch vinden Rijkswaterstaat en opdrachtnemers het lastig om prestatie-indicatoren te ontwikkelen en te gebruiken. Om te weten te komen tegen welke problemen zij aanlopen zijn interviews gehouden met projectteamleden van zowel Rijkswaterstaat als opdrachtnemers. De ervaren problemen hebben te maken met (1) de introductie van prestatie-indicatoren, (2) het besef van zowel opdrachtgever als opdrachtnemer van het doel van meten, waardoor er een gebrek aan motivatie ontstaat, (3) een gebrek aan kennis met betrekking tot de ontwikkeling en het gebruik van prestatie-indicatoren en (4) de beschikbaarheid van data en benchmarks. Bovendien laat een kwantitatieve analyse zien dat de opdrachtgever 98% van de risico’s bezet, terwijl de meeste geïnterviewde projecten voornamelijk de opdrachtgever meten. Dit onderzoek richt zich op het gebrek aan kennis met betrekking tot de ontwikkeling en het gebruik van prestatie-indicatoren, omdat de meeste problemen hieraan gerelateerd zijn.
Eerst is theorie op het gebied van prestatie-indicatoren in het algemeen, maar vooral in de bouwsector bestudeerd. Deze studie laat zien dat er een breed scala van prestatie-indicatoren en karakteristieken voor indicatoren bestaat. Een analyse op deze prestatie-indicatoren en karakteristieken heeft geleid tot een reeks karakteristieken voor de ontwikkeling en gebruik van prestatie-indicatoren welke bruikbaar is in Best Value-projecten.
Vervolgens zijn de karakteristieken verwerkt in een model. Het model is ontwikkeld door de karakteristieken te verdelen over zes verschillende stappen. Een conceptversie van het model is geëvalueerd door projectteamleden van Best Value projecten, van zowel opdrachtgevers- als opdrachtnemerszijde. Op basis van de terugkoppeling van deze evaluatie is het model verder verfijnd en een definitief model gemaakt. De stappen in het definitieve model zijn het kiezen van de reeks indicatoren, het kiezen van de indicatoren, het ontwikkelen van de indicatoren, het opnemen in de Wekelijkse Rapportage, het gebruik tijdens de uitvoering en het evalueren. Het model bestaat in totaal uit 20 karakteristieken. Het model is getest op twee Best Value-projecten. In het eerste project is het model gebruikt in een sessie met opdrachtgever en opdrachtnemer tijdens de onderbouwingsfase. Tijdens de sessie zijn prestatie-indicatoren ontwikkeld. Na de sessie heeft de opdrachtnemer deze prestatie-indicatoren verder uitgewerkt. In het tweede project is het model gebruikt als checklist. Er zijn suggesties voor verbeteren gedaan door de opdrachtgever gebaseerd op het model en vervolgens heeft de opdrachtnemer de indicatoren verder verfijnd. Op vijf indicatoren leverde dit 12 verbeteringen op die direct te zijn relateren aan het model.
prestatie-ix
x
1.3 Research objective ... 3
1.4 Research framework ... 3
1.5 Research questions ... 5
1.6 Research relevance ... 5
1.6.1 Scientific relevance ... 6
1.6.2 Practical relevance ... 6
1.7 Structure ... 6
B
EST
V
ALUE AND PERFORMANCE INDICATORS
... 8
2.1 Best Value approach ... 9
2.2 Best Value and performance indicators in practice... 9
2.2.1 Selection ... 10
2.2.2 Clarification ... 11
2.2.3 Execution ... 12
2.2.4 Conclusion ... 15
2.3 Best Value and performance indicators in theory ... 17
2.3.1 Information Measurement Theory ... 17
2.3.2 New Institutional Economics ... 20
2.4 Conclusion... 21
C
URRENT PROBLEMS WITH PERFORMANCE INDICATORS
... 24
3.1 Problems with performance indicators at Rijkswaterstaat’s Best Value projects ... 25
3.1.1 Research methodology ... 25
3.1.2 Results ... 26
3.1.3 Conclusion ... 28
3.2 Risks in previous projects ... 29
3.2.1 Research methodology ... 29
3.2.2 Case description ... 29
3.2.3 Results ... 30
3.2.4 Analysis ... 32
3.2.5 Conclusion ... 32
3.3 Conclusion... 33
P
ERFORMANCE INDICATORS IN THE CONSTRUCTION INDUSTRY
... 35
4.1 Applicability in the construction industry... 36
4.1.1 Performance indicators in general ... 36
4.1.2 Performance indicators in the construction industry ... 36
4.1.3 Types and examples of indicators ... 38
4.1.4 Impact of Best Value on these indicators ... 39
4.2 Problems with performance indicators ... 40
4.3 Characteristics from the literature ... 41
xi
5.2.1 Research methodology ... 51
5.2.2 Results ... 52
5.2.3 Analysis and conclusion ... 60
5.3 Final model ... 60
5.4 Tests in practice ... 63
5.5 Conclusion ... 63
C
ONCLUSION
,
DISCUSSION AND RECOMMENDATIONS
... 64
6.1 Conclusions ... 64
6.1.1 Answers to the research questions ... 64
6.1.2 Research goal ... 67
6.2 Discussion... 68
6.3 Recommendations to Rijkswaterstaat ... 69
6.3.1 Recommendations to Rijkswaterstaat ... 69
6.3.2 Recommendations for further research ... 71
xii
Table 3-2: risk owners of Spoedaanpak ... 30
Table 3-3: results of data analysis Spoedaanpak ... 31
Table 4-1: characteristics from the literature ... 41
Table 4-2: characteristics divided per reference ... 43
Table 4-3: applicable characteristics derived from the literature ... 48
Table 5-1: draft model ... 51
Table 5-2: word table, based on Yin (2009) ... 52
Table 5-3: evaluation step 1 ... 53
Table 5-4: evaluation step 2 ... 54
Table 5-5: evaluation step 3 ... 55
Table 5-6: evaluation step 4 ... 58
Table 5-7: evaluation step 5 ... 59
xiii
Figure 2-2: Best Value process (based on Kashiwagi (2013a)) ... 10
Figure 2-3: example of an unforeseen event in the Weekly Risk Report ... 13
Figure 2-4: example of milestones in the Weekly Risk Report ... 14
Figure 2-5: example of other performance indicators and data in the Weekly Risk Report ... 14
Figure 2-6: example of a Director's Report ... 15
Figure 2-7: unfiltered information from project to managing director at Rijkswaterstaat ... 15
Figure 2-8: current role of performance indicators in Best Value ... 16
Figure 2-9: proposed role of performance indicators in Best Value ... 17
Figure 2-10: silos in the supply chain (D. T. Kashiwagi, 2013b) ... 20
Figure 3-1: structure chapter 3 ... 24
Figure 3-2: further delimitation of this research ... 34
Figure 4-1: structure chapter 4 ... 35
Figure 4-2: example of benchmark on client satisfaction (retrieved from KPI Engine (CCI, 2010)) ... 38
Figure 4-3: performance management process (based on Bititci et al., 1997) ... 45
Figure 4-4: traffic light reporting ... 47
Figure 5-1: structure chapter 5 ... 50
Figure 5-2: final model ... 62
Figure 6-1: structure chapter 6 ... 64
Figure 6-2: current use of performance indicators in Best Value... 65
Page 1
INTRODUCTION
1.1
Motivation
The last decade, clients in the construction industry sought for new ways to contract the best market party, because the old method of selecting only on lowest price caused several industry problems, such as an adverse relation between client and contractor and low profitability for the contractor. At the same time, a changing society put pressure on cutting governmental expenses and thus forced Rijkswaterstaat (the executive arm of the Dutch Ministry of Infrastructure and the Environment) to change its role in developing and managing infrastructure networks (Rijkswaterstaat, 2011a). As a leading client, Rijkswaterstaat now increasingly cooperates with market parties (Rijkswaterstaat, 2011b).
An emerging procurement and project management method to approach a project is Best Value1. Key aspects of Best Value are a win-win situation for both client and contractor, a high value for a low price, less management, direction and control of the client, and giving contractors the space to show their expertise (D. T. Kashiwagi, 2013a). The approach originates from the United States, but is now used in over 160 projects in the Netherlands and is becoming increasingly popular in several countries, by both public and private parties. The use of Best Value at Rijkswaterstaat started in 2008, when more than half of the Spoedaanpak programme (i.e. 16 of 30 projects concerning resolving major bottlenecks on the Dutch highway network) was approached with Best Value. Because of the success of the approach in this programme, Rijkswaterstaat decided to test the approach in other pilot projects. These pilot projects were not only highway projects, but also included engineering services, water projects, and maintenance. Meanwhile, fifteen projects are finished, ten projects are in progress, and seven projects are in preparation (July 2013), which means Rijkswaterstaat is one of the worldwide leaders in using Best Value. At Rijkswaterstaat, the approach is no longer a pilot, but will now be further implemented in Rijkswaterstaat’s primary processes (Rijkswaterstaat Staf DG, 2013).
Over the years, the Best Value approach has evolved from only a procurement method towards a combination of procurement method, project management method, and risk management method. While the focus was first on the selection, by means of tenders with two-page submittals and holding interviews with the supplier’s key personnel, nowadays the focus is more on the phases after the selection, i.e. the so-called clarification phase and the execution of the project.
An aspect that is gaining increasing attention is the use of simplistic performance measurements in all phases of a project. With these measurements, the performance can be indicated by using a performance indicator. A performance indicator not only shows the measure, but also defines a baseline in order to indicate the performance, instead of only measuring it. During the selection, performance measurements
1 The Best Value approach is formerly known as BVP (Best Value Procurement) or PiPS (Performance information
Page 2
support the claims in a tender in a simple and non-disputable way and show the effectiveness of risk mitigations and value-added plans. During the clarification phase, and sometimes already in the selection phase, performance indicators are developed. During execution, they create transparency during execution by giving clear insight into the performance of client and contractor. Moreover, they stimulate continuous learning and improvement.
This research elaborates on the development and the use of performance indicators in the clarification and execution phase of Best Value projects. The problem is analysed and a step-by-step model is proposed for the development and use of performance indicators in Best Value projects, seen from both the perspective of client and contractor.
Research organisation
Rijkswaterstaat is the executive body of the Dutch Ministry of Infrastructure and the Environment. On behalf of the Minister and State Secretary, Rijkswaterstaat is responsible for the design, construction, management and maintenance of the main infrastructure facilities in the Netherlands (Rijkswaterstaat, 2011b).
This research is conducted at the Rijkswaterstaat Major Projects and Maintenance (Dutch: Grote Projecten en Onderhoud, GPO), which is one of Rijkswaterstaat’s seven central departments. GPO ensures that the networks are and will be available. They do that by executing large construction and maintenance projects. Since the research focuses on Best Value, the research is done at the Best Value core team of the section Advice Procurement, Contract Management, and Lead Auditing.
1.2
Problem analysis
The Best Value approach is based on the research of Dean Kashiwagi. His research group developed Best Value since the 1990s. Since 2008, Rijkswaterstaat uses Best Value, based on the philosophy of Kashiwagi. Several changes are made to comply with Dutch and European legislation, but the approach is kept as close to the original as possible (Rijt, van de, Witteveen, Vis, & Santema, 2011).
As stated earlier, Best Value is evolving due to new insights based on research and the growing number of pilot projects. Nowadays, increasing attention is given to the second and third phase, i.e. the clarification and execution phase, and the role of performance information in the process. As one of the organisations that use Best Value the most, Rijkswaterstaat is interested in following these developments. Therefore, they want to pay more attention to the clarification and execution phase and improve the use of performance indicators in their projects to increase transparency, communicate in an effective way, and learn and improve.
Page 3
phase and the need of performance indicators, but is less clear on how performance indicators should be embedded in these phases. Moreover, because Rijkswaterstaat is in an advanced stage of implementing Best Value compared to other parties, little case studies using performance indicators in Best Value projects exist.
Since 2012, Rijkswaterstaat obliges their contractors to develop performance indicators in the clarification and to use them during the execution of the project. In a Best Value project, the contractor is concerned to be the expert in its field and hence knows best what to measure. Therefore, the contractor is given freedom in how he develops and uses these indicators.
However, experiences from the first projects using performance indicators showed that it was hard to develop indicators and that the indicators were hardly used during execution. Performance measuring and communicating was a novelty for the contractors and so they encountered a lack of knowledge regarding the development and use of performance indicators. Rijkswaterstaat wants to reduce the lack of knowledge at the contractors side because in the end they also benefit from transparency, less and clearer communication, and learning and development of contractors. Moreover, they also want to know how they can improve their role in developing and using indicators.
1.3
Research objective
Concluding from the motivation and problem analysis in respectively section 1.1 and 1.2, both client and contractor require help with developing and using performance indicators in Best Value projects. Therefore, a step-by-step model will be developed to design and use indicators, which leads to the following research objective:
The objective of this research is to propose a step-by-step model for contractors and Rijkswaterstaat, for the process of developing and using performance indicators in Best Value projects.
This is realised by giving insight in the current problems regarding performance indicators in Best Value projects, by finding characteristics of how to develop and use performance indicators in Best Value projects and by testing these characteristics at current Best Value projects.
1.4
Research framework
Page 4
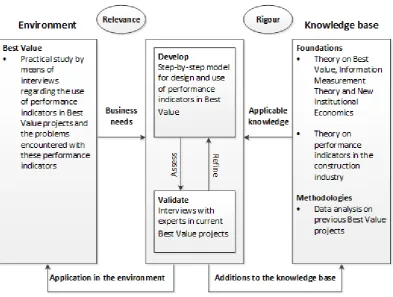
Figure 1-1: research framework, based on Hevner et al. (2004; 2007)
The primary components of forming a model are the environment and the knowledge base, which are therefore studied first.
The left side of the model shows the environment. In this research, this environment consists of the Best Value projects of Rijkswaterstaat and it is researched by means of interviews in current projects. The description of the environment will lead to a
business need. This business need can be seen as the relevance for this research. The business need is one part of the input for the step-by-step model.
The right side of the framework shows the knowledge base, which consists firstly of an extensive literature study on Best Value and on performance indicators in construction and secondly of a data analysis of previous Best Value projects at Rijkswaterstaat. The literature studies and data analysis are called respectively
foundations and methodologies by Hevner. The foundations and methodologies together are called the applicable knowledge. The quality of this applicable knowledge is called the degree of rigour of this research. The applicable knowledge is the other part of the input for the step-by-step model.
Page 5
This refined step-by-step model is the output of this research. It can then be applied in the environment (by testing it in Best Value projects at Rijkswaterstaat) and can be
added to the knowledge base (by describing the scientific implications). The application in the environment is done by doing recommendations to Rijkswaterstaat and presenting the step-by-step model. The additions to the knowledge base are done by writing a paper.
1.5
Research questions
Using the research framework from section 1.4, the research objective is translated into research questions, which are shown below here.
Knowledge base
Research question 1
What is the Best Value approach?
Research question 2
What is the role of performance indicators in Best Value projects?
Environment
Research question 3
What problems regarding performance indicators can be identified in current Rijkswaterstaat Best Value projects?
Knowledge base
Research question 4
How are performance indicators generally used in the construction industry?
Development
Research question 5
What model can be made regarding the process of developing and using performance indicators in Best Value projects?
Evaluation
Research question 6
Is this model applicable, relevant and effective on Rijkswaterstaat’s Best Value projects?
Application and additions Research question 7
What recommendations can be made to Rijkswaterstaat and what suggestions can be done for further research?
1.6
Research relevance
Page 6
1.6.1
Scientific relevance
The Best Value theory focuses mainly on the selection phase, seen the content of the 2013 Best Value Standard (D. T. Kashiwagi, 2013a). The steps that have to be taken in the clarification phase and during the execution are also described, but the use of performance indicators is under researched. A lot about performance indicators in construction can be found in literature, but the impact of the emerging approach of Best Value on performance indicators is not yet known and needs further research (D. T. Kashiwagi, Kashiwagi, Kashiwagi, & Sullivan, 2012). This research therefore highlights the development and use of performance indicators at Best Value projects.
1.6.2
Practical relevance
The coming years, Rijkswaterstaat intends to implement Best Value further in their primary processes. More projects will be approached with Best Value and thus more projects will be using performance indicators. Therefore, taking away the lack of knowledge concerning the development and use of these indicators is of increasing importance. It is expected that this should lead to increased professionalism of the supply chain, such as better learning and improvement and more objective discussions supported by measurements.
Because Rijkswaterstaat is one of the worldwide leading parties in the use of Best Value (Rijt, van de & Santema, 2013) and because performance indicators in Best Value are still relatively underdeveloped, many other parties are interested in how performance indicators are used in Rijkswaterstaat’s projects. Therefore, the practical relevance of this research is not limited to Rijkswaterstaat and their contractors.
1.7
Structure
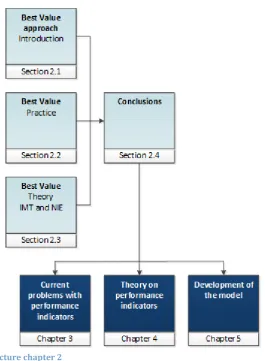
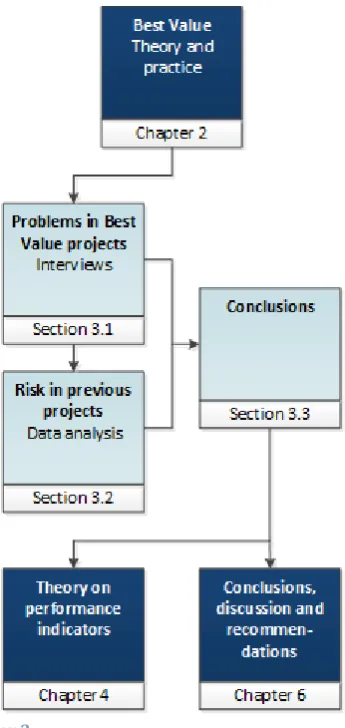
Figure 1-2 shows the structure of this report.
Figure 1-2: structure of the report
First, the Best Value approach, as well as the use of performance indicators in Best Value (chapter 2), are elaborated on mostly theoretically. Chapter 3 is more practical and describes the current problems with performance indicators in Best Value projects, based on interviews and data analysis.
Page 7
Chapter 5 describes the development of the model. This development is based on the Best Value theory of chapter 2 and the characteristics found in chapter 4. A draft model is made, which is evaluated by project team members of current Best Value projects. After that, the final model for developing and using performance indicators in Best Value is made. At the end of the fifth chapter, the model is tested in two cases.
Page 8
BEST VALUE AND PERFORMANCE
INDICATORS
This chapter describes the Best Value approach from both a practical and theoretical perspective, and describes the role of performance indicators in the approach. The chapter starts with a general introduction of Best Value (section 2.1). After that, the practical part highlights the different phases of Best Value and the way performance indicators are used in each phase (section 2.2). The theoretical section (2.3) shows, from the viewpoint of two theories, the need for performance indicators in Best Value. The first two research questions are answered in the concluding section 4.4. An overview of the structure of this chapter can be found in Figure 2-1.
Research question 1
What is the Best Value approach?
Research question 2
[image:22.595.178.444.363.725.2]What is the role of performance indicators in Best Value projects?
Page 9
2.1
Best Value approach
Best Value is a procurement, project management, and risk management approach aimed on getting the highest value for the lowest price, with high customer satisfaction and high efficiency. The approach was developed in the 1990s in the United States by Dean Kashiwagi. By 2013, the research group that developed the approach monitored over 1,600 tests with Best Value with an amount of $ 5.6 billion (D. T. Kashiwagi, 2012; Rijt, van de & Santema, 2013), not only in the construction sector but also several non-construction sectors, for instance in IT, food services and health services (D. T. Kashiwagi, 2013a). Nowadays, Best Value is used in several countries all over the world and from these countries, “The Netherlands has become the leader of the Best Value, (…) where the concepts are the most widely used” (Rijt, van de & Santema, 2013, p. 10). More about the history of Best Value can be found in Appendix III.
Best Value is based on the concepts of win-win, less management, direction and control, and transparency, which is explained in section 2.3. This is achieved by using several filters in the selection phase to select an expert supplier, by running a pre-award clarification phase with this selected, so-called prospective contractor, and by project and risk management using Weekly Risk Reports during the execution of the project. A more detailed description of this process can be found in section 2.2.
The descriptions of the Information Measurement Theory and Best Value in this chapter are derived from the latest literature of Dean Kashiwagi: the 2013 Best Value Standard (D. T. Kashiwagi, 2013a) and the 2013 Information Measurement Theory (D. T. Kashiwagi, 2013b).
2.2
Best Value and performance indicators in practice
This section explains the different phases of the approach, in the way it is used at Rijkswaterstaat. The use of Rijkswaterstaat is comparable to the original philosophy; however, since Rijkswaterstaat is a public organisation and thus bound to Dutch and European procurement legislation, some adaptations have been done to fit the approach into Dutch law and European directions (Rijt, van de et al., 2011).
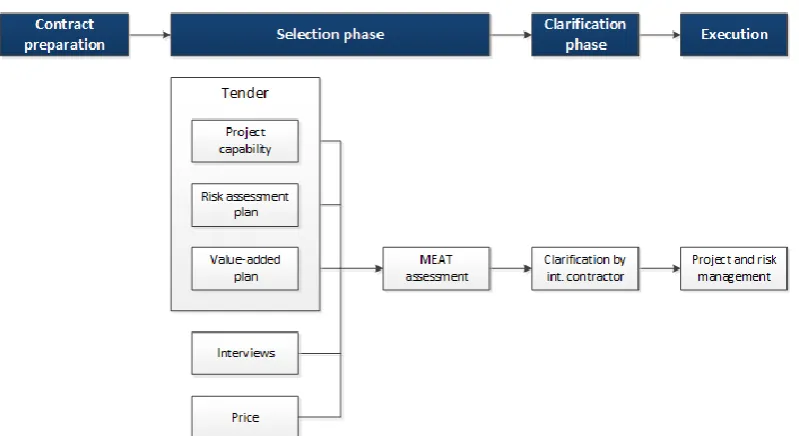
The approach consists of three phases, i.e. selection, clarification, and execution. Before these three phases is the contract preparation of the client. The first two phases (i.e. selection and clarification) in Best Value are pre-award; the third phase (i.e. execution) is post-award. An overview of the process can be found in Figure 2-22.
2 MEAT or EMVI (Dutch) means Most Economically Advantageous Tender or Economisch Meest Voordelige
Page 10
Figure 2-2: Best Value process (based on Kashiwagi (2013a))
In the next sections, respectively the selection, clarification and execution phase are described, including the role of performance indicators in these phases.
2.2.1
Selection
The selection phase consists of five filters: a project capability submittal, risk assessment plan, value-added plan, interviews, and the price. These filters are used to identify the expert supplier. In the original process, past performance is also used as a filter for selection, but due to European legislation, this is not possible at Rijkswaterstaat: it can only be used as a prequalification criterion. The submittals in the selection have to be short and dominant; therefore, the maximum number of pages per submittal (project capability, risk assessment plan and value-added plan) is two.
Project capability
In the project capability submittal, the supplier describes why he is capable to do the project.
Risk assessment plan
The risk assessment plan describes the risks concerning the client that the supplier sees upfront and the way he will mitigate them.
Value-added plan
Page 11
Interviews
During the selection, formal interviews are held with key personnel of the supplier. These interviews are held to find out to what extent the prospective project team members can oversee the project.
Price
The price is the supplier’s price for the project, without the price for value-added options. Before the tender, the client determines a maximum price for the project. The supplier’s price may not exceed this maximum price.
Performance information
All the submittals and the interviews have to be supported with verifiable performance information. This enables suppliers to show their expertise in a short and clear way. Quantitative information reduces the need for subjective decisions of the client’s selection committee.
Examples of verifiable performance information that can be used include the number and size of projects done by the prospective project manager, a customer satisfaction score, and the average time and cost deviations in previous projects. For instance, a supplier can show his expertise in a clear and transparent way by stating that the project manager has experience with three projects with a similar size and complexity in the same sector, which had an average customer satisfaction score of 8.6, a time deviation of less than 2%, and a cost deviation of less than 1%. This is much more transparent and objective than stating that the project manager has much experience with project of similar size and complexity, that customer satisfaction is very important to him, and that he does everything he can to avoid time and cost deviations.
In the submittals, suppliers can suggest performance indicators that can be measured during the execution, in order to support the claims made in the submittals. These indicators are then part of the tender and they can be further refined in the clarification. However, suggesting performance indicators in the submittals is not mandatory and is only used in a few cases. Moreover, Kashiwagi (2013a) does not mention the suggestion of performance indicators in the selection phase: he only states a list of performance indicators should be developed at the end of the clarification phase.
Prioritisation
All this information, together with the price, are scored by the client and subsequently prioritised. Rijkswaterstaat uses the EMVI method (Economisch Meest Voordelige Inschrijving; Most Economically Advantageous Tender) for the prioritisation, whereby the scores of the project capability (10%), risk assessment plan (20%), value-added plan (15%), interviews (30%), and price (25%) are expressed in monetary terms. After the prioritisation, the number one supplier is called the prospective contractor and he proceeds to the clarification phase.
2.2.2
Clarification
Page 12
plans, the prospective contractor now provides more details about his plan. Moreover, the client verifies the performance information delivered by the contractor during the selection phase.
During the clarification, the prospective contractor clarifies his scope (what is in and what is out). In addition, he draws a list of all the risks that both he and the client see upfront, together with mitigation measures for these risks. Furthermore, the client develops performance indicators that he will use during the execution of the project, if they are not suggested in the selection phase. How these performance indicators have to be developed is not described in the theory.
The clarification phase is the phase where the client can express his concerns regarding the project. It is up to the contractor to show the client that he really is the expert. The prospective contractor can use performance information to substantiate his capability. In addition, the expectations of the client and contractor are aligned. Performance indicators can be linked to this alignment, to increase transparency about the client and contractor’s performance expectations during the execution. Moreover, when a risk occurs, the contractor can use the measurements to show what the performance of his mitigation measures was on that risk. In this way, the risk allocation is clear: the contractor can show whether he is accountable for the occurrence of the risk.
The clarification phase ends with an award meeting, where the client decides to award the project to the prospective contractor.
2.2.3
Execution
During the execution of the project, the focus is on project and risk management. Using the risk management plan set up during the selection and the clarification phase, the contractor tries to minimise all the risks that he cannot control.
The contractor communicates the status of the project, including progress and deviations of milestones, deviations from the schedule in time and costs, documentation of risks, and a list of performance indicators by sending a so-called Weekly Risk Report each week.
Risks and scope changes in the Weekly Risk Report
The contractor mentions three types of risks or scope changes in the Weekly Risk Report:
1. Risks from the risk management plan that are likely to occur and that have an impact on time or cost
2. Unforeseen risks that are not taken into account prior to the project and that have an impact on time or cost
3. Changes to the project scope commissioned by the client
Page 13
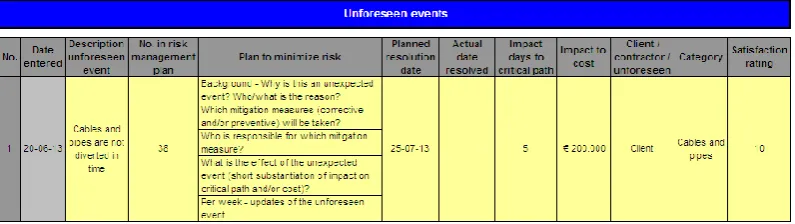
[image:27.595.86.484.163.275.2]contractor’s risk mitigation measures. When an unforeseen has happened and it is closed, the real impact on time and cost is described. An example of a risk in the Weekly Risk Report is shown in Figure 2-3.
Figure 2-3: example of an unforeseen event in the Weekly Risk Report
Tracking the risks and changes to the project scope makes clear how the project is performing and provides details about who is accountable for the occurrence of risks. Creating this transparency in the Weekly Risk Report enables the contractor to steer on risks upfront. All Best Value projects at Rijkswaterstaat use the Weekly Risk Report.
Performance indicators in the Weekly Risk Report
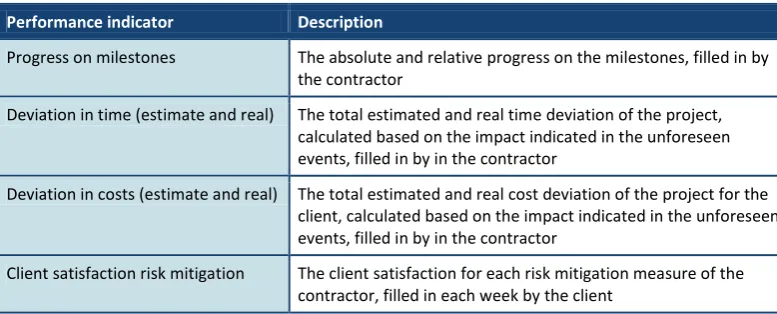
Each week, the contractor communicates the performance indicators that are developed in the tender or during the clarification phase in the Weekly Risk Report. During the whole execution of the project, the contractor measures the performance of risk mitigation and thus tracks the deviations to performance or quality expectations for the project (D. T. Kashiwagi, 2013a). In addition, he can measure his own performance. The performance indicators can be used to explicitly indicate and improve the processes. The concrete implementation and communication of these performance indicators is the responsibility of the contractor, because this forces him (i.e. the expert) to communicate to the client (i.e. non-expert) in a simple and clear way. Moreover, the contractor (i.e. the expert) knows the best what to measure (after all, it is his plan that is executed) and based on his expertise, he knows what action has to be taken when the indicator is below the threshold. Unlike for the unforeseen events, a format for communicating the performance indicators does not exist.
Page 14
Table 2-1: performance indicators already measured in the Weekly Risk Report
Performance indicator Description
Progress on milestones The absolute and relative progress on the milestones, filled in by the contractor
Deviation in time (estimate and real) The total estimated and real time deviation of the project, calculated based on the impact indicated in the unforeseen events, filled in by in the contractor
Deviation in costs (estimate and real) The total estimated and real cost deviation of the project for the client, calculated based on the impact indicated in the unforeseen events, filled in by in the contractor
Client satisfaction risk mitigation The client satisfaction for each risk mitigation measure of the contractor, filled in each week by the client
The communication of these indicators, together with other data about the project, in the Weekly Risk Report is shown in Figure 2-4 and Figure 2-5.
Figure 2-4: example of milestones in the Weekly Risk Report
Figure 2-5: example of other performance indicators and data in the Weekly Risk Report
Director’s Report
Page 15
Figure 2-6: example of a Director's Report
At Rijkswaterstaat, the Director’s Reports are directly communicated to the managing directors. The process of Weekly Risk Reports (WRs) and Director’s Report (DRs) in Rijkswaterstaat’s organisation is shown in Figure 2-7.
Figure 2-7: unfiltered information from project to managing director at Rijkswaterstaat
2.2.4
Conclusion
[image:29.595.88.482.377.636.2]Page 16
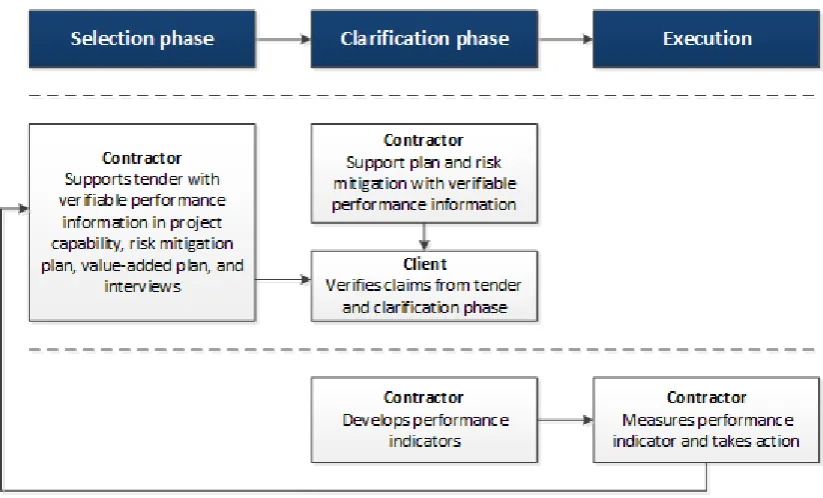
Figure 2-8: current role of performance indicators in Best Value
The contractor supports the tender with verifiable performance information. In the clarification phase, the plan is further worked out and also supported by verifiable performance information. Meanwhile, the client verifies these claims and the claims from the tender. During the clarification phase, indicators are developed for the execution of the project. During the execution, the contractor measures and takes action if needed. The measurements are communicated by the Weekly Risk Report.
Page 17
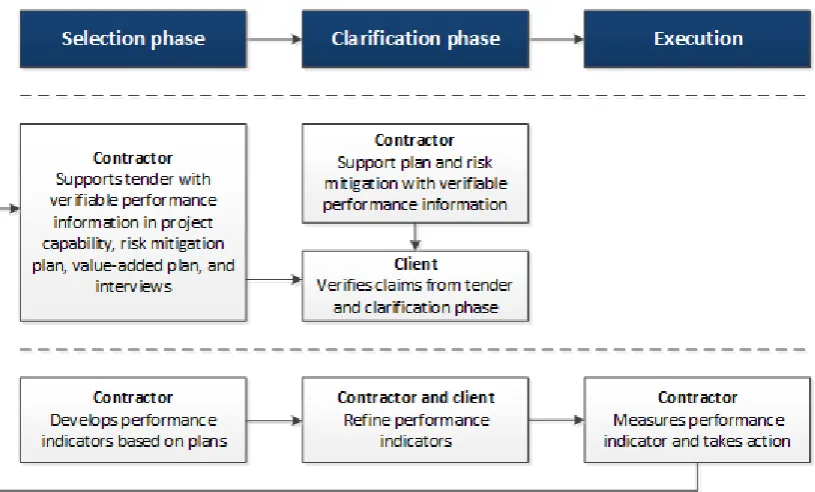
Figure 2-9: proposed role of performance indicators in Best Value
2.3
Best Value and performance indicators in theory
In this section, the role of performance indicators in Best Value is analysed from two different theories. The first theory is the Information Measurement Theory (IMT), developed by the founder of Best Value, Dean Kashiwagi. The second theory is New Institutional Economics (NIE), an economic theory that focuses on social norms, and includes concepts such as transaction uncertainty, bounded rationality, and opportunistic behaviour.
2.3.1
Information Measurement Theory
The founder of Best Value, Dean Kashiwagi, developed the approach on the base of his IMT. This theory consists of several concepts of which below the concepts of a price-based and value-price-based industry, dominant information, and working in silos are explained. The other concepts, i.e. events and who is on my molecule are described in Appendix IV.
From price-based towards value-based
Page 18
Table 2-2: industry structure (D. T. Kashiwagi, 2013b)
High Pe rf o rman ce III. Negotiated-bid
Minimised competition
Long term
Relationship based
Supplier selected based on performance
II. Value-based (supplier controlled) Buyer selects based on price and
performance
Supplier uses schedule, risk management, and quality control to track deviations
Expertise and professionalism
Win-win
IV. Unstable market I. Price-based (owner controlled) Wrong person talking
Management, direction and control
No transparency
Win-lose
Low supplier profits
Low Perceived competition High
A price-based culture has the following characteristics:
Wrong person talking
The client extensively prescribes the product or service, whilst the supplier has the knowledge.
Management, direction and control
The client does a lot to manage and direct the supplier and hence holds a strong control on the project, in order to let the supplier do what the client wants him to do.
No transparency
The strong control involves much communication and comprehensive contracts, which makes the process opaque instead of transparent. Moreover, no simple, objective performance measurements exist.
Win-lose
In a price-based culture, either the client or the supplier wins; the other party loses. When the client wins, he has a cheap product or service, but the supplier a high loss; when the supplier wins, he has profit, but the client pays a too high price or the product or service does not meet the expectations.
Low supplier profits
The strong focus on competition and lowest price makes suppliers bid lower than they actually want in order to get the project. This leads to low profits for the supplier.
Page 19
Best Value aims at combining these two ways of selecting, by focusing on both price and performance (quadrant II). This so-called value-based culture has the following characteristics:
Supplier uses schedule, risk management and quality control to track deviations
Not the client, but the supplier controls the project, using a schedule, risk management, and quality control. The supplier tracks the deviations in achieving the project goals.
Expertise and professionalism
The value-based culture is based on the expertise of the supplier. The supplier is the expert and professional that “talks”, instead of the client.
Transparency
A value-based culture means less management, direction, and control of the client. This leads to less communication. Furthermore, less management, direction and control leads to another attitude of client and contractor towards the project, other responsibilities and less contractual discussions. This all increases transparency in the process. Risk is mitigated through transparency and not management, direction and control.
Win-win
In a value-based culture, both client and contractor win. At the end of the project, the client has the high value product or service he asked for and the contractor has his profit, reference project, and knowledge.
Dominant information
Information Measurement Theory (IMT) states that parties have to communicate in a short, concise, non-technical, and simple way. IMT calls this type of information
dominant information. Dominant information has the following characteristics (D. T. Kashiwagi, 2013a, pp. 3–3):
non-disputable;
verifiable;
accurate;
measurements in terms of numbers, percentages or time;
high performance;
shows a high probability of performance of the claim in the future.
According to Best Value, the most dominant language is the language of performance indicators. Using performance measurements and indicators, the information is understandable for everyone, including people with a low perception level. Communicating by performance indicators increases transparency, minimises the need for trust and therefore mitigates risks.
Page 20
aspect led to increased value (J. S. Kashiwagi, 2013, p. 100). Therefore, the concept of dominant information can be considered as quite a unique aspect of Best Value, which has a strong impact on increased value.
Communication by dominant information and thus performance indicators are important in Best Value projects: it enables parties to communicate with each other in the supply chain in a simple and clear way, without management, direction and control, and it mitigates risks. The next section elaborates more on this communication by seeing parties as silos.
Silos in the supply chain
The supply chain of a project consists of several parties, such as the client, contractor, subcontractors, and various other stakeholders. All these parties have a certain contribution in achieving the project goals. Figure 2-10 shows the supply chain of a project.
In most projects, the parties work in silos. They only look at their own work, their own responsibilities and only do the things they have to do (inside the dashed line). Working in a silo creates opaqueness in the process, since the work is done inside the silo and the people inside the silo constantly try to protect their own silo.
Figure 2-10: silos in the supply chain (D. T. Kashiwagi, 2013b)
Best Value aims at selecting experts that can get out of the silo and oversee the whole project. Experts do not look at their own work and responsibilities and do not think in their own interest, but they look at the whole supply chain and think in the project’s interest. Moreover, to come out of the silo, transparency is needed. Best Value assumes using simplistic measurements, about their own performance, but also the performance of others in the supply chain, creates this transparency.
2.3.2
New Institutional Economics
Page 21
NIE theories
The first theory, Transaction Costs Economics (i.a. Williamson (1979)), explains transaction costs and aims at reducing the sum of direct costs and transaction costs. This can be done by reducing the tendency to show opportunistic behaviour, by reducing uncertainty, and by taking account of the aspect of bounded rationality.
The second theory, Property rights theory (i.a. Grossman & Hart (1986)), explains the different behaviour of a party in the case when he is owner of so-called properties. Van Duren concludes that the commitment of the contractor to manage risks grows when he is risk owner, which in the end leads to project success.
The third theory, the Principal-agent theory (i.a. Eisenhardt (1989)), explains the relation between principal (the client) and agent (the contractor). The principal and the agent have different goals and interests and do not have the full information about each other: this is called a-symmetric information. This leads to monitoring costs for the principal: he has to ensure that the agent acts as expected and contracted. On the other hand, it leads to bonding costs for the agent: he has to convince the principal that he works in the principal’s interest.
Influence on performance indicators
Van Duren concludes that Best Value promotes the alignment of goals. This leads to an increase of “commitment, confidence and a consciousness that both parties depend on each other’s performance to reduce the total costs and optimise the quality” (Duren, van, 2013, p. 88). The use of performance measurements reduces transaction uncertainty: uncertainty whether or not the contractor will perform according to agreements and expectations made. Performance measurements contribute to transparency, objectivity, and results-oriented project management. Therefore, performance measurements reduce the uncertainty as defined in the Transaction Costs Economics.
Furthermore, performance measurements done by the contractor reduce the need for control and thus for a reduction of monitoring costs. It contributes to an efficient process without unnecessary information and therefore takes the bounded rationality of parties in account (Duren, van, 2013, p. 96).
Performance measurements also reduce the chance of opportunistic behaviour of parties. Because performance measurements can be used in next tenders, the contractor is not inclined to show opportunistic behaviour that reduces his chance in next tenders. Moreover, performance measurements contribute to conflict regulation, because objective performance information is available (Duren, van, 2013, p. 112).
In the study of Van Duren (2013), only case studies are done on the selection phase, the execution phase of a project is not taken into account.
2.4
Conclusion
Research question 1
Page 22
Best Value is a procurement, project management, and risk management approach aimed on getting the highest value for the lowest price, with high customer satisfaction and high efficiency. Rijkswaterstaat uses the approach slightly different from the original, American approach, due to Dutch and European legislation. The approach exists of three phases: selection, clarification, and execution. In the first phase, a supplier is selected by means of several short submittals, interviews with key personnel, and the price. The submittals and interviews should be supported by verifiable performance information. After the selection, the prospective contractor pre-plans the project and at the end of this phase, the project is awarded. During the execution, the focus is on risk management, each week reported in a Weekly Risk Report.
Best Value is based on the concepts of the founder of Best Value, Dean Kashiwagi. These concepts are called Information Measurement Theory (IMT). The concepts include a win-win situation for client and contractor, a high value for a low price, less management, direction, and control of the client, and giving contractors the space to show their expertise. It states that less management, direction and control of the client leads to more transparency and better risk mitigation. The theories of New Institutional Economics, such as transaction costs economics, property rights theory and principal-agent theory, relate the advantages of the approach to the reduction of uncertainty, taking bounded rationality into account and less opportunistic behaviour.
Research question 2
What is the role of performance indicators in Best Value projects?
This chapter showed that measuring performance is a central issue in the Best Value approach. Performance indicators are used in each phase of the process. During the selection phase, it supports the claims made in the several plans and interviews. Moreover, performance indicators can be suggested by the contractor to specify the performance to be delivered. During the clarification phase, these claims are verified and performance indicators are developed or refined for the execution phase. During the execution of the project, the indicators provide insight and transparency regarding risks and show the client and contractor’s performance. Furthermore, they are the base of learning and improving during the project. Some performance indicators are already measured in the Weekly Risk Report.
In Best Value, the contractor is responsible for developing, measuring, and communicating the performance indicators, because as an expert, he is able to identify what has to be measured. He is also responsible for making risk mitigation plans in the Weekly Risk Report whenever an unforeseen event happens or is likely to happen. The contractor can use the measurements from the execution phase in a next tender as support for the claims made. Furthermore, he can use the measurement as objective base for risk allocation.
Page 23
through transparency. A practical study underlined the need for this type of information. From the perspective of New Institutional Economics, the need for performance measurements is also confirmed: it leads to less uncertainty, takes bounded rationality into account, and leads to less tendency to opportunistic behaviour.
Page 24
CURRENT PROBLEMS WITH PERFORMANCE
INDICATORS
Because chapter 2 showed a gap in the Best Value literature regarding performance indicators, this chapter highlights whether this gap exists in practice. In the first Best Value projects of Rijkswaterstaat, no performance indicators were used. However, most current projects are now obliged to use performance indicators and this chapter analyses this use. This is done by doing interviews with personnel from both client and contractor that is now involved in Best Value projects at Rijkswaterstaat (section 3.1). Furthermore, a data analysis is done on previous projects, in order to find out which party owns most risks (section 3.2). The research question below is answered in the concluding section 3.3. An overview of the structure of this chapter can be found in Figure 3-1.
Research question 3
[image:38.595.225.398.370.735.2]What problems regarding performance indicators can be identified in current Rijkswaterstaat Best Value projects?
Page 25
3.1
Problems with performance indicators at Rijkswaterstaat’s
Best Value projects
Interviews are held in order to find out the state of the current use of performance indicators in Best Value projects. This section presents this part of the research.
3.1.1
Research methodology
Goal
The problem analysis is done by holding interviews with experts from both the client and the contractor side. The aim of these interviews is to find out in a qualitative way what problems are encountered by client and contractor using performance indicators in practice. This analysis can then be used to look for improvements. This practical analysis complements with the theoretical chapter 2.
Research design
The research is conducted using individual semi-structured interviews with contract managers from the client side as well as from the contractor side. In total ten interviews are held, of which four with contract managers of Rijkswaterstaat and six with contract managers of engineering firms and general contractors. The contract managers work in six different projects: one exploration study, two planning studies, two Design and Construct contracts and one performance contract (see Table 3-1, a more extensive description can be found in Appendix V.1). In total, eight different contractors execute the projects. A broad selection of contract managers, from both the perspective of client and contractor, and analysing very different projects helps in creating a broad view of the problems regarding the use of performance indicators.
Table 3-1: cases for problem analysis
Project Characteristics
Strengthening Houtribdijk Exploration study for strengthening the Houtrib dike
3rd lock Beatrixsluis Planning study for a 3rd lock at the Beatrixsluis, broadening of the Lek
canal
PLuG acoustic research Acoustic research for air and noise reduction along highways Upgrade Zuid-Willemsvaart D&C project for broadening and deepening of the Zuid-Willems canal Diversion A9 Badhoevedorp D&C project for the diversion of highway A9 at Badhoevedorp Performance contract Droog Maintenance project for main road network in eastern of the
Netherlands
Page 26
The interviews are recorded and transcripts are made afterwards, in order to reduce the risk of own interpretation. The latest version of the performance indicators as used in the project is brought hardcopy to the interviews and is used as a concrete example for the problem analysis.
3.1.2
Results
This section shows the results of the interviews.
In the selection phase, it was not clear performance indicators had to be used during the project
One contractor stated that it was not clear when tendering whether performance indicators had to be used as an important aspect of Best Value. Another contractor indicated that they became aware of the need to measure during the clarification phase. One of the projects started with Best Value approach from the clarification phase. In this project, the use of performance indicators is non-contractual and the contractor was surprised by the client’s attention to the use of performance indicators.
The goal of measuring performance is not made clear by the client during the clarification phase
Contractors encountered a lack of not only theoretical, but especially practical explanation about the goal of measuring performance. This lack led to less support and awareness of client and contractor for the development and use of performance indicators.
During the execution phase, this leads to indicators that are not measured because of a lack of motivation of the contractor and a lack of attention of the client. The lack of attention of the client also reduces the incentive for the contractor to measure. In other words, client and contractor have other priorities.
Not enough attention is paid by the client to the development and use of performance indicators and a lack of knowledge exists regarding the development and use
Because performance measuring is new to most contractors, they lack the knowledge to develop performance indicators, which caused difficulty in developing them during the clarification phase. Interviewees indicate that it is both hard to determine what to measure and how to make indicators measurable. During the execution, this leads to ignoring the indicators because they are either not relevant or hard to measure. Moreover, client and contractors do not always take action upon indicators when this should be required by the value of the indicator.
Page 27
and therefore the indicator was no longer measured. The interviewee’s on the client side agree the lack of knowledge. Practical help for developing indicators is needed.
In some of the projects, performance indicators that do not give the opportunity to steer or focus on improvement are developed. This is caused by a bad development. Examples of such indicators are the progress of investigations (chronological start-execution-end, this only shows the progress and not a performance that can be improved) or the number of reactions of the client that are too late (such an indicator can never be steered to back to zero once a reaction is given too late, therefore it does not give the opportunity to steer). In these examples, indicators like the deviation from the planning or a percentage of reaction that are too late are preferred.
In one project, the contractor started with more than twenty performance indicators, because they felt the need to measure various aspects of the project. Already after several weeks, they found out that such a high number of indicators is very time and resource-consuming to measure. Therefore, they reduced the number of indicators to fourteen by only measuring the critical aspects. Another project started with ten indicators, but during the project this is further delimited to the five most critical.
Project teams of client and contractor are hardly involved in developing the indicators
In almost all the projects studied, the development of the indicators was done and the indicators were agreed by only a few people. For example, in one project, the client was not involved at all in the development. In another project, only the project manager and contract manager of the contractor and the contract manager of the client developed the indicators, which caused a lack of support for the indicators. Therefore, one interviewee said that the indicators should be developed with both projects teams in order to create support for measuring and taking action. The indicators will be of increasing importance when the whole project team owns the indicators.
All interviewees stress the importance of the clarification phase for aligning the expectations of client and contractor, not only for the development, but also for the use during the project: when and what action will be taken?
Too much focus is on the performance of the contractor
In one of the projects, only the performance of the contractor was measured. For example, the progress on several investigations on ground and technical aspects is measured, the relation of the contractor with the stakeholders is measured, etc. No aspect of the client is measured. However, according to the Best Value theory, it is expected that most risks are owned by others than the contractor (since he is the expert) and therefore the need to measure also the client is stressed in the theory. Furthermore, a contractor only measuring his own performance reduces the attention of the client for the performance indicators.
It is hard for contractors to collect data and to determine a target value