Modelling Linkage of Globalization and
Financial Development to Human
Development in CLMV Region
Chhorn, Theara and Chhorn, Dina
Faculty of Economics, Chiang Mai University, GREThA UMR
CNRS 5113, University of Bordeaux
31 September 2017
Online at
https://mpra.ub.uni-muenchen.de/84878/
1
Modelling Linkage of Globalization and Financial Development
to Human Development in CLMV Region
Theara Chhorn
Independent Researcher, International Business,
Faculty of Economics, Chiang Mai University
Dina Chhorn
Lecturer of Economics,
GREThA UMR CNRS 5113, University of Bordeaux, Avenue Duguit 33 608 Pessac, France
Abstract
Several existing theories emphasize the strong positive effects of globalization and financial development on human development, either because of the rising economic welfare and the higher productivity of workers generating from increasing skill specialization or because financial development will create an increase of investment in education which is the major source of economic growth and human development. We show that there is no such a huge promise in the case of CLMV countries. The globalization and financial development does unquestionably generate statistically positive impact but with a small magnitude. We suggest that this informative finding reflects the rapid increase of globalization and financial development in CLMV countries ameliorating significantly only human development of urban population but decreasing for rural population. This indicates the benefits of globalizing forces concentrate in urban region where the huge majority of CLMV population are living in rural area.
Key words: Financial Development, Globalization, Human Development, Analysis of Economic Significance, CLMV Region
2
I.
Background and Motivation
The rapid rising of globalization and financial development of both developed countries and much of the developing countries, especially the CLMV countries1, depicted in Appendix 6 and 7, is seen as one of the most major economic catalysts in stimulating economic growth and human development during last decades (B. Sharma & A. Gani, 2004; A. Davies & G. Quinlivan, 2006; U. Gunduz, 2009; F. K. Rabbanee, 2010; Shahrabi, 2011; A. Assadzadeh & J. Pourqoly, 2013; Z. Hamid & R. M. Amin, 2013; Pérez-Segura, 2014; G. Mustafa, 2017; Santhosh Kumar, 2017; S. T. Jawaid & A. Waheed, 2017; Santhosh Kumar, 2017; & S. T. Jawaid & A. Waheed, 2017).
The highly popular approaches, building on the paradox of absolute and comparative advantage theories of A. Smith (1808) and D. Ricardo (1817), view that everyone is better-off through which globalizing forces by international trade and/or foreign direct investment (FDI) will result in increasing human capital and physical accumulation, which stimulate economic growth and household income (Harrod & Dommar, 1939-47; Solow, 1956, & Sabi, 2007); ameliorating international specialization (Eli Hecksher, 1919, Bertil Ohlin, 1933, and Paul Samuelson,1953); rising capital education (Ronald Findlay, and Henryk Kierzkowski, 1983); promoting technology, innovation transformation and capital flow (S. D. Muhammad et al., 2010); encouraging mobility of both physical and financial capital (Dreher Axel, 2006, B. Sharma & A. Gani, 2007, Zhuang, 2016, M. Azam, 2015, and Steensma S. R., 2010); stimulating multinational firms allowing technological transfers to emerging countries (Agell & Lundborg, 1995, Davis, 1998, Albert & Merckl, 2001, Kreickemeier & Nelson, 2006, and Hellier, 2012); and reducing poverty as the proxy of human development and increasing welfare (A. Assadzadeh & J. Pourqoly, 2013).
A different but related challenge is emphasized by the positively significant effect of financial development on human development in which it is considered as the essential sources in increasing private investment and consumption (Cyn-Young Park, 2011); rising investment in education and other socio economic instruments (A. Ozpolat, 2016); promoting economic growth (Ghamati, 2014; Sehrawat, 2014, & A. A. Kargbo, 2016); and enhancing bank private credit and domestic private credit contributing significantly to economic growth, both directly and through their influence on human capital accumulation (A. Abubakar, 2015).
The prime objective of the study is to illustrate the stylized facts of globalization and financial development on human development either in empirical or theoretical frameworks. The main objective is firstly to investigate their relationship relying on panel data set of small – dimension, (1995-2016) obtained from International Monetary Fund (IMF) and World Bank. Secondly, it aims at examining the economic significance to find out the smallest and largest share from estimated regressions. The key contribution inside the study is insightfully. Some interesting factors are adopted to examine the relationship at cross – sectional country level. Moreover, this study is the first empirical investigation in the context of CLMV region.
Therefore, the organized outline of the study is structured as follows: 1st section is to demonstrate the background and motivation whereas 2nd one is to design the methodology and data description. The 3rd section is to interpret the empirical results along with technical observations and analysis of economic significance. The last section is to make the concluding remarks and highlight some major policy recommendations.
1
3
II.
Econometric Methodology and Data Calculation
2.1.
Data Collection and Hypothesis
From existing empirical studies, the choice of variables is designated due to the current stylized facts of CLMV region. In accordance to an aspect of simplicity and generalizability, Human Development Index (HDI), developed by the United Nations Development Programme (UNDP) and computed from three main composite statistics, namely life expectancy, education, per capita income, uses as the proxy of human development. It extracts annually from UNDP and IMF. The HDI trend of CLMV region reports in appendix 2 and 3 in the last section.
Globalization employs as the proxy of per capita trade and FDI net flows (% of GDP) extracts from the World Development Indicators (WDI), the World Bank. Furthermore, attempting to capture the impact of trade on HDI, we model the change in HDI index as a function of per-capita trade. It is because most of the studies used trade (% of GDP) to investigate its impacts to HDI. Yet, we are conversely concerned with trade as it impacts people rather than those as percentage of GDP. It differs from other empirical studies by which trade (% of GDP) is applied as the proxy (its trend illustrates in appendix 6). Therefore, per capita trade, following the study of A. Davies and G. Quinlivan (2006) equates as bellows:
per capita trade!" =ln !"#$%&!!"#$%& !,!
!"#$%&!"#$!,! −ln
!"#$%&!!"#$%&
!,!!!
!"#$%&'(")!,!!! (2.1)
In line to some existing literature reviews, financial development employs two main indicators, namely domestic credit to private sector and broad money supply (M2) as the percentage of GDP. This indicator has become a standard measure of the financial depth and size of the financial intermediary sector (Alkhuzaim, 2014). It imports annually from WDI, the World Bank. Its trend shows detail in appendix 7.
Other control variables such as total, rural, urban population growth rate (%) and labor force participant import from WDI, the World Bank. The choice of control variables closely follows those applied in HDI regression and empirical research analysis (A. Abubakar, 2015; A. M. Figueroa, 2014; A. Hatemi-J & M. Shamsuddin, 2016) for example. All variables transfer to the nature of logarithm function and extract annually. Therefore, their detail description and hypothesis demonstrate in appendix 1 in the last session. Moreover, in order to examine the possible differences on how the vitality of globalization and financial development affect to HDI in CLMV region, the study considers several specifications due to the baseline model. The baseline model including and excluding control variable simultaneously is employed. The other models incorporating dummy variables and interacting with the proxy of globalization and financial development to examine differential effects from individual country of Cambodia, Lao PDR, Myanmar and Vietnam are adopted.
2.2.
Specification Function: Globalization, Financial Development and
Human Development
We model the specification function of human development and its impacts from globalization, financial development and other control variables in the simple form of panel data analysis as follows:
HDI!" = α+γglobalization!"+φfin!"+δW′!"+ µμ!" (2.2)
4
Where,
• HDI!" is a matrix of explained variable, using as the proxy of human development
index (HDI).
• globalization!" is a matrix of globalization variables, adopting as the proxy of international trade (trade per capita) and foreign direct investment (FDI) flows as the percentage of GDP.
• fin!" is a matrix of financial development variables, applying as the proxy of domestic
credit provide to private sector and broad money supply (M2) as the percentage of GDP.
• W′!" is a set of control variables from which assume to be impacted statistically and
economically to HDI. In the regression equation, total, urban and rural population growth rate (%)and labor force participant are applied.
• α,γ,δ,φ is vector parameters to be determined in estimated regression.
• µμ!" is an error term and it is assumed to be Gaussian normal distribution, N(0, 1).
To examine effect from individual country and time dummy applying as binary variable, say 0 and 1, the study subscripts its function as follows: let’s consider country dummy 𝐶𝐷
! = 1 for 𝑟 equates to the evaluated country, as example 𝐶𝐷! =1 if 𝑟= 𝑐𝑎𝑚𝑏𝑜𝑑𝑖𝑎 and 0 otherwise. As the result, we denote as follows:
individual country dummy =θ!"CD
! (2.3)
Where, country dummy, (𝐶𝐷
!) and 𝑟= 1,…,𝑅 is dummy variable taking number 1
for country 𝑟, and 0, otherwise. More importantly, FDI, trade per capita, broad money supply and domestic credit provided to private sector are adopted as country dummy in line with multiplying by its own determined factors of globalization and financial development variable. Again, it calculates as multiplying to country dummy variable. With regard to time dummy, let’s denote 𝜏!𝑇! as time trend effect or time dummy where 𝜏! is the parameters of
time trend, 𝑇!. It equals to 1 on year 𝑗 and 0 otherwise. For any given year 𝑗, denotes the
function by setting 𝑇! =1 for 𝑗 equates to determined period and 0 otherwise. As the result,
we get an expression as follows:
time dummy= !!!τ!T!
!!! (2.4)
From equation (2.2), (2.3) and (2.4), we can accordingly rewrite a new specification function of human development in CLMV region as follows:
HDI!" = α+γglobalization!"+φfin!"+δW′!"+θ!"CD!+ !!!!!!τ!T!+ µμ!" (2.5) i= 1,…,N,r =1,…,R and t= 1,…,T
The equation (2.2) and (2.5) will estimate throughout panel data model, say pooled OLS, fixed effect (FE), random effect (RE) and feasible generalized least squares (FGLS) in general. In particular, due to diagnostic detecting of autocorrelation and heteroskedasticity, FGLS will be adopted individually to remove those violent in regression model. Therefore, the brief description of panel data analysis explains in the following part as bellows:
2.3.
Brief Description of Cross Country Analysis
5
(𝑡) and number of cross – section (𝑖). It though equates in the form of panel data analysis as
follows:
Y!" =α+βX′!"+µμ!+ ε!" (2.6)
i=1,…,N and t =1,…,T, and
v!" = µμ
!+ ε!" (2.7)
Where, 𝜇! captures unobserved characteristics, such as languages, distance and demographics, which does not change for a given individual. On the notification of (C. Hsiao, 2003), the crucial distinction between FE and RE estimator is whether the unobserved individual effect embodies the elements that are correlated with regressors in the model, not whether these effects are stochastic or not, (W. H. Greene, 2012). Hausman specification test (Hausman, 1978) is accordingly computed to compare the constant variances between two estimators. Under the null hypothesis of having variances of error term (𝜀!") are constant, the
two estimators produce the same statistical value. Thus, let’s consider, 𝛽!" and 𝛽!" is RE and FE estimator respectively. We get the asymptotic distributed as chi – square distribution with
𝜀!" degree of freedom as follows:
H= β!"−β!" ′ V β
!" −V(β!") !!
β!"−β!" (2.8)
Moreover, it is worth noting that OLS estimator is bias, inconsistency and inefficiency because of the existence of violent assumptions due to serial correlation issue where it demonstrates in the handbook of (W. H. Greene, 2012). The empirical result is theoretically not reliable and untruthfulness. Accordingly, other estimators take into account. In the presence of heteroskedasticity of error term, though FGLS estimator, as a weight least square (WLS) is consistency and efficiency in correcting for the presence of heteroskedasticity and can be applied to linearized model.
FGLS, in contrast to RE or FE estimator, assumes orthogonally between explanatory variables and the unobserved heterogeneity (Baltagi, 2008). In empirical studies revealed that it is fitted perfectly to small sample size. Meaning that it is sensitive to small sample size observation, with the lowest bias. Consequently, it is perfectly fitted to our study where it exists only 4 cross-sections with 79 and 68 number of observations. FGLS applies weight matrix to estimate the parameter errors of heteroskedasticity. For the weight matrices, Ω!,! to
be parameterized to model cross-sectional correlation, they must be square (balanced panels). Our dataset is strongly balance. According to (Jeffrey M. Wooldridge, 2009) denotes that FGLS weighs the observations in line to the square root of their variance. It is given by:
β!"#$ = X′Ω!!X !!X!Ω!!y= X!′Σ!!X ! !
!!! !! !!!!X!′Σ!!X! (2.9)
It can be showed that even the weights use in FGLS estimation are biased (resulting in a biased estimation of the residuals variance), FGLS would still provide consistent estimated due to the variance matrix of the error terms applied retransformation technique (Manning, 1998). Yet, it is denoted as follows:
E εε′ =Ω =
σ
!,!Ω!,! σ
!,!Ω!,!
⋮ σ
!,!Ω!,! σ
!,!Ω!,!
σ
!,!Ω!,!
⋯
…
σ
!,!Ω!,!
σ
!,!Ω!,!
⋮ ⋱ ⋮
σ
!,!Ω!,! ⋯ σ!,!Ω!,!
(2.10)
6
increasing an accuracy of estimation. It aims yet at calculating economic significance analysis. Last but not least, to capture more detail of panel data approach, they can be found in (Hsiao, 1986; Hausman, 1978; C. Hsiao, 2003; Baltagi, 2008; Jeffrey M. Wooldridge, 2009; Manning, 1998 & W. H. Greene, 2012).
III.
Empirical Findings and Discussions
3.1.
Discussions on Diagnostic Test Result
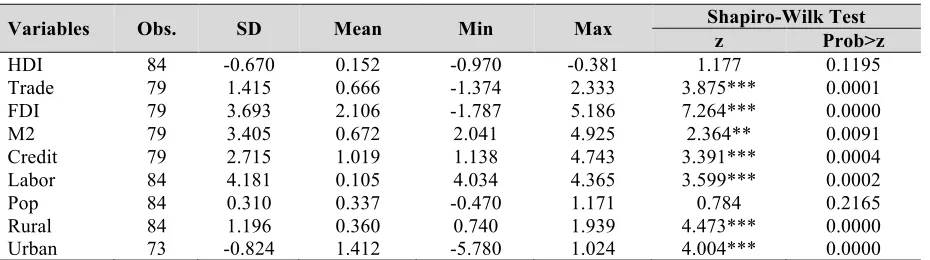
This section is to present the descriptive statistic highlighting the mean, maximum, minimum and standard deviation (SD). Table 3.1 reports 84 sample observations for nearly all variables excluding trade, FDI, M2, credit and urban conversely showing only 79 and 73 observations respectively. It is because we transform to logarithm and some observations are drooped. SD statistically reports in the gap of -0.824 for lowest and 4.181 for the highest one.
[image:7.595.69.534.392.522.2]FDI indicates the maximum value, say 5.186 among others variables. Regarding to normality test under the null hypothesis of whether dataset come from normal distribution population reveals that 5 variables, namely trade, enroll, urban and rural, can reject the null hypothesis at 1% level of significant. It fails for the rest of variables. In short, most of variables are not come from normal distribution excluded HDI in accordance to Shapiro – Wilk test. Thus, FGLS accordingly takes into account to overcome normality issue and small sample size observation.
Table 3.1: Descriptive Statistics and Normality Test
Variables Obs. SD Mean Min Max Shapiro-Wilk Test z Prob>z HDI 84 -0.670 0.152 -0.970 -0.381 1.177 0.1195 Trade 79 1.415 0.666 -1.374 2.333 3.875*** 0.0001 FDI 79 3.693 2.106 -1.787 5.186 7.264*** 0.0000
M2 79 3.405 0.672 2.041 4.925 2.364** 0.0091
Credit 79 2.715 1.019 1.138 4.743 3.391*** 0.0004 Labor 84 4.181 0.105 4.034 4.365 3.599*** 0.0002
Pop 84 0.310 0.337 -0.470 1.171 0.784 0.2165
Rural 84 1.196 0.360 0.740 1.939 4.473*** 0.0000 Urban 73 -0.824 1.412 -5.780 1.024 4.004*** 0.0000 Source: Computer calculation, author’s estimates
Note: p – value is inside the parentheses, (). The sign notification of * p<0.05, ** p<0.01, *** p<0.001 indicates the
statistical significant of the diagnostic test.
3.2.
Discussion on Empirical Estimated Result
7
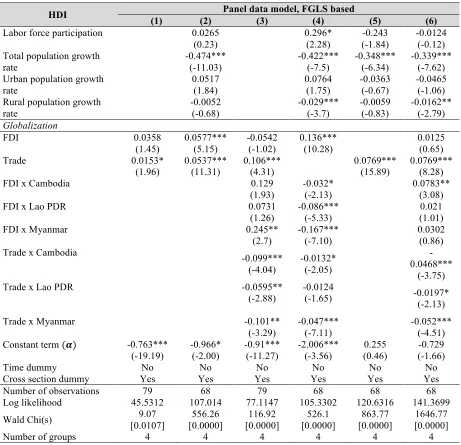
[image:8.595.70.531.151.596.2]suggests the higher the magnitude of globalization and financial development, the higher the improvement of human capability in CLMV region, particularly in urban area. More importantly, this quantum of rising is reduced due to an increasing magnitude of population factor, especially those who are living in rural population.
Table 3.2: Human Development Regression, (Globalization = FDI and Trade)
HDI Panel data model, FGLS based
(1) (2) (3) (4) (5) (6)
Labor force participation 0.0265 (0.23) 0.296* (2.28) -0.243 (-1.84) -0.0124 (-0.12) Total population growth
rate -0.474*** (-11.03) -0.422*** (-7.5) -0.348*** (-6.34) -0.339*** (-7.62) Urban population growth
rate 0.0517 (1.84) 0.0764 (1.75) -0.0363 (-0.67) -0.0465 (-1.06) Rural population growth
rate -0.0052 (-0.68) -0.029*** (-3.7) -0.0059 (-0.83) -0.0162** (-2.79) Globalization
FDI 0.0358
(1.45) 0.0577*** (5.15) -0.0542 (-1.02) 0.136*** (10.28) 0.0125 (0.65)
Trade 0.0153*
(1.96) 0.0537*** (11.31) 0.106*** (4.31) 0.0769*** (15.89) 0.0769*** (8.28)
FDI x Cambodia 0.129
(1.93)
-0.032* (-2.13)
0.0783** (3.08)
FDI x Lao PDR 0.0731
(1.26)
-0.086*** (-5.33)
0.021 (1.01)
FDI x Myanmar 0.245**
(2.7)
-0.167*** (-7.10)
0.0302 (0.86) Trade x Cambodia
-0.099*** (-4.04) -0.0132* (-2.05) -0.0468*** (-3.75)
Trade x Lao PDR -0.0595**
(-2.88)
-0.0124
(-1.65) -0.0197* (-2.13)
Trade x Myanmar -0.101**
(-3.29)
-0.047*** (-7.11)
-0.052*** (-4.51) Constant term (𝜶) -0.763***
(-19.19) -0.966* (-2.00) -0.91*** (-11.27) -2.006*** (-3.56) 0.255 (0.46) -0.729 (-1.66)
Time dummy No No No No No No
Cross section dummy Yes Yes Yes Yes Yes Yes
Number of observations 79 68 79 68 68 68
Log likelihood 45.5312 107.014 77.1147 105.3302 120.6316 141.3699
Wald Chi(s) 9.07
[0.0107] 556.26 [0.0000] 116.92 [0.0000] 526.1 [0.0000] 863.77 [0.0000] 1646.77 [0.0000]
Number of groups 4 4 4 4 4 4
Source: Computer calculation, author’s estimates
Note: t statistics is inside the parentheses, () and number inside the basket, [] refers to the probability value. The sign
notification of * p<0.05, ** p<0.01, *** p<0.001 indicates the statistical significant. FGLS estimator is computed based on independent and identically distributed (i.i.d) of error structure across the panel and corrected autocorrelation based on Durbin – Watson statistics.
8
role in the enhancement of human capital in all developing countries (M. Azam, 2015). A growing of per capita trade boosts HDI by its positive affect, as it is not differ from FDI. Both are the essential fragment of rising globalization from which caused in improving human capability via transferring technology ICT (Information and Communications Technology) based, new business structure, employment creation and poverty reduction. Precisely, as reflecting to the study conducted by UNDP (2011) revealed that trade has played an important role in expanding people’s horizons and choices. Furthermore, our finding is also replicated to some empirical studies which stated that trade liberalization boosts to growth in static and dynamic gains leading to rapid capital accumulation and faster productivity growth (Khan and Zahler, 1985). CLMV trade has grown rapidly. Starting in the late 1980s, CLMV countries put trade and investment at the center of their respective development strategies. They have been gaining global export and import market share since 2000, though since they are small economies, these market shares remain small in absolute terms (Koshy Mathai et al., 2016).
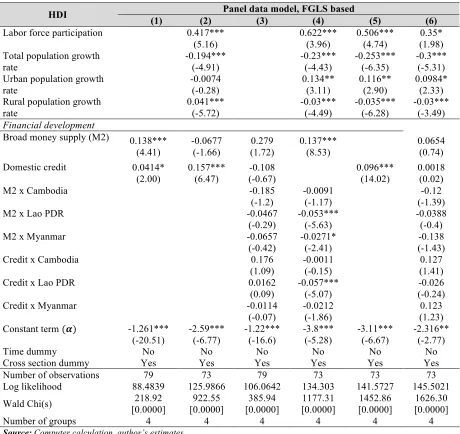
In addition, we investigate human development regression with respect to financial development whereas it shows in table 3.3. The control variables show positively and negatively significant even if dummy factors are dropped in estimated regression. Consequently, in one part, it implies that HDI is driven not only from development of financial sector but it is generated from other internal factors such as population, labor force in the economy and country – specific itself as well. Model (1) shows that M2 and credit is positively and significantly impacted to HDI. Hence, 1% increases of M2 and credit (% GDP) will generate HDI score by 0.138% and 0.041% respectively. One could explain is that development of financial sector has been successful for CLMV countries in facilitating and improving banking and financial system. It is such an important catalyst in elaborating trade and foreign capital flows into the country. This finding is that development of financial section by efficient resource allocation and financing innovative activities can support and boost economic growth. As the result, this has generated the country growth in CLMV countries, yet increasing HDI score of the country.
9 Table 3.3: Human Development Regression, (Financial Development = Broad money supply and Credit)
HDI Panel data model, FGLS based
(1) (2) (3) (4) (5) (6)
Labor force participation 0.417*** (5.16) 0.622*** (3.96) 0.506*** (4.74) 0.35* (1.98) Total population growth
rate -0.194*** (-4.91) -0.23*** (-4.43) -0.253*** (-6.35) -0.3*** (-5.31) Urban population growth
rate -0.0074 (-0.28) 0.134** (3.11) 0.116** (2.90) 0.0984* (2.33) Rural population growth
rate 0.041*** (-5.72) -0.03*** (-4.49) -0.035*** (-6.28) -0.03*** (-3.49) Financial development
Broad money supply (M2) 0.138*** (4.41) -0.0677 (-1.66) 0.279 (1.72) 0.137*** (8.53) 0.0654 (0.74) Domestic credit 0.0414*
(2.00) 0.157*** (6.47) -0.108 (-0.67) 0.096*** (14.02) 0.0018 (0.02)
M2 x Cambodia -0.185
(-1.2)
-0.0091 (-1.17)
-0.12 (-1.39)
M2 x Lao PDR -0.0467
(-0.29)
-0.053*** (-5.63)
-0.0388 (-0.4)
M2 x Myanmar -0.0657
(-0.42)
-0.0271* (-2.41)
-0.138 (-1.43)
Credit x Cambodia 0.176
(1.09)
-0.0011 (-0.15)
0.127 (1.41)
Credit x Lao PDR 0.0162
(0.09)
-0.057*** (-5.07)
-0.026 (-0.24)
Credit x Myanmar -0.0114
(-0.07)
-0.0212 (-1.86)
0.123 (1.23) Constant term (𝜶) -1.261***
(-20.51) -2.59*** (-6.77) -1.22*** (-16.6) -3.8*** (-5.28) -3.11*** (-6.67) -2.316** (-2.77)
Time dummy No No No No No No
Cross section dummy Yes Yes Yes Yes Yes Yes
Number of observations 79 73 79 73 73 73
Log likelihood 88.4839 125.9866 106.0642 134.303 141.5727 145.5021
Wald Chi(s) 218.92 [0.0000] 922.55 [0.0000] 385.94 [0.0000] 1177.31 [0.0000] 1452.86 [0.0000] 1626.30 [0.0000]
Number of groups 4 4 4 4 4 4
Source: Computer calculation, author’s estimates
Note: t statistics is inside the parentheses, () and number inside the basket, [] refers to the probability value. The sign notification of * p<0.05, ** p<0.01, *** p<0.001 indicates the statistical significant. FGLS estimator is computed based on independent and identically distributed (i.i.d) of error structure across the panel and corrected autocorrelation based on Durbin – Watson statistics.
3.3.
Analysis of Economic Significance
10
benefits those population living in urban area. As both RE and FGLS show urban population is riding in paralleling to higher HDI. This replicated the facts as the fastest – growing economic, CLMV countries themselves is growing beyond the gap of exclusive growth. It is simply that the process of globalization may help only specific group of people to become richer and this will widen the gap between the poor and the rich. As we have known, most of population, over 70% in CLMV countries is living in rural or countryside area (See appendix 11). It highly exposes to inequality, particularly in income distribution within the country and the low level of institutional quality such as political stability and corruption. Yet, the connection of economic growth and HDI is automatic, it is depended on a variety of factors such structure of economics, income and asset distribution, institutional quality and policy choice within the country (G. Mustafa, 2017).
[image:11.595.82.520.464.637.2]Though the empirical findings show the positive correlation of both globalization and financial development relating to improvement of human capability in CLMV countries. Yet, the proportion contributes to HDI score is only a small magnitude. This should be higher as it should be as we notify trade and FDI is augmenting dramatically in the country since the year of 2000. Credit shows the largest impact to HDI. Most of developing countries experience a shortage of capital, this is reflected in their respective savings-investment and import-export gaps, which implies that developing countries have insufficient savings and/or foreign exchange to finance their investment needs. Improving human capital would have long-term payoffs on human development but it has not showed a strong magnitude effect as human development (Pérez-Segura, 2014). The role of globalization will simulate in changing business structure, particularly the usage of ICT in organization throughout technical progress. But it should be rising within the level of education and provide sufficient source of fragility. It can be implied that in general, the globalization process is likely to bring negative results to those countries with high levels of state fragility and delinquency.
Figure 3.1: Economic Significance of a One-SD Increase of Explanatory Factors on line of HDI (% Probability) with Robust Standard Error (SE)
Source: Computer calculation, author’s estimates
The financial development presented as domestic credit to private sector is initiated the positive impacts and a significant factor in contributing to human improvement. In CLMV countries, financial system is remained as the gap of development in the long term. It needs a high level of commitment for CLMV countries to integrate its region not only economic but also finance. As in CLMV countries, providing loan from financial institutes to household resulted in enhancing debt. People are not used loan as investment option but rather for daily
0.019
0.038
0.088
0.019
-0.083
0.004
-0.036 0.055
0.080
0.018
-0.082
0.008
-0.026
-0.100 -0.080 -0.060 -0.040 -0.020 0.000 0.020 0.040 0.060 0.080 0.100
FDI Trade Credit FDI x Trade
M2 x Credit
Labour Total population
Urban population
11
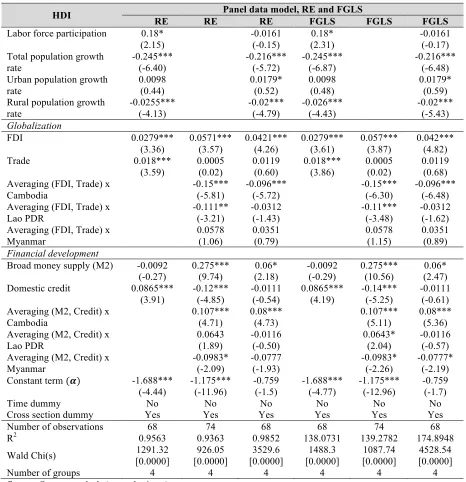
[image:12.595.66.532.127.609.2]consumption. Thus, the needs in development financial system is moved a path forwardly to improving their human resource capability via financial literacy.
Table 3.4: Human Development Regression, (Globalization and Financial Development)
HDI Panel data model, RE and FGLS
RE RE RE FGLS FGLS FGLS Labor force participation 0.18*
(2.15) -0.0161 (-0.15) 0.18* (2.31) -0.0161 (-0.17) Total population growth
rate -0.245*** (-6.40) -0.216*** (-5.72) -0.245*** (-6.87) -0.216*** (-6.48) Urban population growth
rate 0.0098 (0.44) 0.0179* (0.52) 0.0098 (0.48) 0.0179* (0.59) Rural population growth
rate -0.0255*** (-4.13) -0.02*** (-4.79) -0.026*** (-4.43) -0.02*** (-5.43) Globalization
FDI 0.0279***
(3.36) 0.0571*** (3.57) 0.0421*** (4.26) 0.0279*** (3.61) 0.057*** (3.87) 0.042*** (4.82)
Trade 0.018***
(3.59) 0.0005 (0.02) 0.0119 (0.60) 0.018*** (3.86) 0.0005 (0.02) 0.0119 (0.68) Averaging (FDI, Trade) x
Cambodia -0.15*** (-5.81) -0.096*** (-5.72) -0.15*** (-6.30) -0.096*** (-6.48) Averaging (FDI, Trade) x
Lao PDR -0.111** (-3.21) -0.0312 (-1.43) -0.11*** (-3.48) -0.0312 (-1.62) Averaging (FDI, Trade) x
Myanmar 0.0578 (1.06) 0.0351 (0.79) 0.0578 (1.15) 0.0351 (0.89) Financial development
Broad money supply (M2) -0.0092 (-0.27) 0.275*** (9.74) 0.06* (2.18) -0.0092 (-0.29) 0.275*** (10.56) 0.06* (2.47) Domestic credit 0.0865***
(3.91) -0.12*** (-4.85) -0.0111 (-0.54) 0.0865*** (4.19) -0.14*** (-5.25) -0.0111 (-0.61) Averaging (M2, Credit) x
Cambodia 0.107*** (4.71) 0.08*** (4.73) 0.107*** (5.11) 0.08*** (5.36) Averaging (M2, Credit) x
Lao PDR 0.0643 (1.89) -0.0116 (-0.50) 0.0643* (2.04) -0.0116 (-0.57) Averaging (M2, Credit) x
Myanmar -0.0983* (-2.09) -0.0777 (-1.93) -0.0983* (-2.26) -0.0777* (-2.19) Constant term (𝜶) -1.688***
(-4.44) -1.175*** (-11.96) -0.759 (-1.5) -1.688*** (-4.77) -1.175*** (-12.96) -0.759 (-1.7)
Time dummy No No No No No No
Cross section dummy Yes Yes Yes Yes Yes Yes
Number of observations 68 74 68 68 74 68
R2 0.9563 0.9363 0.9852 138.0731 139.2782 174.8948
Wald Chi(s) 1291.32 [0.0000] 926.05 [0.0000] 3529.6 [0.0000] 1488.3 [0.0000] 1087.74 [0.0000] 4528.54 [0.0000]
Number of groups 4 4 4 4 4 4
Source: Computer calculation, author’s estimates
Note: t statistics is inside the parentheses, () and number inside the basket, [] refers to the probability value. The
12
IV.
Concluding Remarks and Recommendations
The empirical findings of this paper suggest that globalization and financial development have positive effect on human development. However, contrary to a range of theories emphasizing a huge promise of positive effect, we found a small magnitude of the effect in the CLMV countries. One possible explanation for this pattern is possibly related to geographic and sociological context of population and endogenous factors of human development. We document that, during last several decades in the CLMV countries, human development does increase for urban population while it is decreasing for rural population. This indicate that the positive effect of globalized forces and financial development could not benefit the majority of population who are living in rural area whereas it has less effect on educational and health factors which are the major components of human development.
13
Reference
A. A. Kargbo, Y. D. (2016). Financial Development, Human Capital, and Economic Growth: New Evidence from Sierra Leone. Journal of Finance and Bank Management, 4(1), 49-67. doi:10.15640/jfbm.v4n1a4
A. Abubakar, S. H. (2015). Financial Development, Human Capital Accumulation and Economic Growth: Empirical Evidence from the Economic Community of West African States (ECOWAS). Procedia - Social and Behavioral Sciences 172, 96 – 103.
A. Assadzadeh and J. Pourqoly. (2013). The Relationship between Foreign Direct
Investment, Institutional Quality and Poverty: Case of MENA Countries. Journal of Economics, Business and Management, 1(2), 161-165 .
A. Davies and G. Quinlivan. (2006). A Panel Data Analysis of the Impact of Trade on Human Development. Duquesne University , John F. Donahue Graduate School of Business .
A. Hatemi-J and M. Shamsuddin. (2016). The causal interaction between financial development and human development in Bangladesh. Applied Economics Letters, 3(14 ).
A. M. Figueroa. (2014). The Impact of Globalization on Human Development in Developing Countries: The Case of Central and South America. Revista Eletrônica de Ciência Política, 5(2).
A. Ozpolat, F. N. (2016). The Relationship between Financial Development and Human Development in OECD Counties: A Panel Causality Test. 18th International Scientific Conference on Economic and Social Development – “Building Resilient Society”. Zagreb, Croatia.
ADB. (2014). ASEAN 2030 - Toward a Borderless Economic Community. Asian Development Bank Institute.
B. Sharma and A. Gani. (2007). The Effects of Foreign Direct Investment on Human Development. Global Economy Journal, 4(2). doi: https://doi.org/10.2202/1524-5861.1049.
Baltagi, B. H. (2008). Econometric analysis of panel data. UK: John Wiley & Sons: Chichester.
C. Hsiao. (2003). Analysis of panel data, 2nd edn. Econometric society monographs, 34.
Cambodia-UNDP. (2016). Human Development Report 2016, Briefing note for countries on the 2016 Human Development Report, Cambodia. Human Development Report 2016.
Chaisrisawatsuk, S. (2016). Capital market development in ASEAN Economic Community: issues and opportunities for other subregions of the Asia-Pacific region. UNESCAP.
Chen, C. (. (n.d.). An Introduction to Quantile Regression and the QUANTREG Procedure.
SAS Institute Inc. Cary, NC: SUGI 30, Statistics and Data Analysis.
Cyn-Young Park. (2011). Asian Development Bank.
Denise Jannah Serrano, K. S. (n.d.). In Pursuit of the ASEAN Economic Community . Closing the Development Gap between CLMV and ASEAN-6 Through the Initiatives for ASEAN Integration , De La Salle University , Manila.
14
Dreher Axel. (2006). Does Globalization Affect Growth? Evidence from a new Index of Globalization. Applied Economics, 38(10), 1091-1110.
EIC. (2016 , March 07 ). Japan’s ODA paves way for further economic ties with CLMV.
Bangkok Post/Asia In Depth: Asia Focus section.
ERIA. (2012 ). Globalization and Development Strategy in Myanmar toward ASEAN Economic Integration . Economic Research Institute for ASEAN and East Asia .
F. K. Rabbanee, M. M. (2010). Globalization and Human Development – Realities and Recommendations for Developing Countries. Asian Affairs, 30(1), 32-49.
Figueroa, A. M. (2014). The impact of globalization on human development in the
developing countries: the case of Central and South America. Revista Eletrônica de Ciência Política, 5(2 ).
Figueroa, A. M. (2014). The impact of globalization on human development in the
developing countries: the case of Central and South America. Revista Eletrônica de Ciência Política, 5 , 24 - 41 .
G. King and M. E. Roberts. (2015). How Robust Standard Errors Expose Methodological Problems They Do Not Fix, and What to Do About It. Political Analysis, 23, 159– 179. doi:10.1093/pan/mpu015
G. Mustafa, M. R. (2017). Growth, human development, and trade: The Asian experience.
Economic Modelling, 61 , 93-101. Retrieved from https://doi.org/10.1016/j.econmod.2016.12.007
Gani, B. S. (2004). The Effects of Foreign Direct Investment on Human Development.
Global Economy Journal, 4(2).
Ghamati, M. M. (2014). Financial Development and Economic Growth in Developed Countries. International Letters of Social and Humanistic Sciences, 36, 75-81. doi:10.18052/www.scipress.com/ILSHS.36.75
Hausman, J. (1978). Specification Tests in Econometrics. Econometrica, 46, 1251-1271.
Heckman J. (1974). Shadow Prices, Market Wages, and Labor Supply. Econometrica, 42, 679-693.
Hsiao, C. (1986). Analysis of panel data. New york: Cambridge University Press.
Jeffrey M. Wooldridge, I. G.-8. (2009). Recent developments in the econometrics of program evaluation. Journal of Economic Literature 47, 1: 5-86.
Koenker R. and Hallock K. (2002). Quantile Regression. The Journal of Economic Perspectives, 15(4), 143–156.
Koshy Mathai et al. (2016). China’s Changing Trade and the Implications for the CLMV Economies. The Asia and Pacific Department. International Monetary Fund.
Lao-UNDP. (2016). Human Development Report 2016, Briefing note for countries on the 2016 Human Development Report, Lao People's Democratic Republic. Human Development Report 2016.
15
M. Mehrara and F. Ghamati. (2014). Financial Development and Economic Growth in Developed Countries. International Letters of Social and Humanistic Sciences, 36, 75-81.
M. Sehrawat, A. G. (2014). The relationship between financial development indicators and human development in India. International Journal of Social Economics, 41(12), 1194-1208. Retrieved from https://doi.org/10.1108/IJSE-11-2013-0268
Manning, W. G. (1998). The Logged Dependent Variable, Heteroskedasticity and the Retransformation Problem. Journal of Health Economics, 17, 283-295.
Margarita Genius, E. S. (2008). Applying the Copula Approach to Sample Selection Modelling. 40 (11), 1443-1455.
Myanmar-UNDP. (2016). Human Development Report 2016, Briefing note for countries on the 2016 Human Development Report, Myanmar. Human Development Report 2016.
Pavcnik, P. K. (2007). Distributional Effects of Globalization in Developing Countries.
Journal of Economic Literature, American Economic Association , 45(1) , 39-82. Retrieved from http://www.nber.org/papers/w12885
Pérez-Segura, A. (2014). FDI and Human Development: What is the Role of Governance?
Honors Thesis .
Quinlivan, A. D. (2006). A panel data analysis of the impact of trade on human development.
The Journal of Socio-Economics, 35(5), 868-876. doi:https://doi.org/10.1016/j.socec.2005.11.048
S. D. Muhammad et al. (2010). Impact of Globalization on HDI (Human Development Index): Case Study of Pakistan. European Journal of Social Sciences, 13(1).
S. T. Jawaid and A. Waheed. (2017). Contribution of International Trade in Human Development of Pakistan. Global business Review.
doi:https://doi.org/10.1177/0972150917710345
Sabi, M. (2007). Globalization and Human Development. International Conference on Globalization and Its Discontents, Cortland, 2007 . USA : The Sage Colleges.
Santhosh Kumar. (2017). Trade and Human Development: Case of ASEAN. Pacific Business Review International, 12, 48-57.
SCB. (2015). 4 Strategies to seize opportunities from the rising CLMV. Economic Intelligence Center (EIC).
Sen, G. (2016). Act East Policy and the CLMV Countries. IDSA Comment. Retrieved from http://www.idsa.in/idsacomments/act-east-policy-clmv-countries_gsen_290316
Shahrabi, B. (2011). The Role of Globalization in Improving Human Development Index.
Middle-East Journal of Scientific Research, 8(5 ), 954-958.
Steensma, S. R. (2010). Human Development and Foreign Direct Investment in Developing Countries: The Influence of FDI Policy and Corruption. World Development , 38 (12 ), 1678-1691. Retrieved from https://doi.org/10.1016/j.worlddev.2010.04.005
Steensma, S. R. (2010). Human Development and Foreign Direct Investment in Developing Countries: The Influence of FDI Policy and Corruption. World Development, 38(12), 1678–1691.
16
Development Research Institute, International Monetary Fund, the ASEAN Secretariat and the Royal Government of Cambodia .
T. Manolom and B. Promphakping. (2016). Measuring development and human wellbeing in the Lao PDR: Exploring Laos' development indicators. Kasetsart Journal of Social Sciences, 37 , 73 - 81.
U. Gunduz, M. H. (2009). The Impact of Trade on Social Development. International Journal of Social, Behavioral, Educational, Economic, Business and Industrial Engineering, 3(6).
UNDP. (2016). Human Development Report 2016, Human Development for Everyone. New York, NY 10017 USA.
UNDP page 10. (2011). Trade and human development: A practical guide to mainstreaming trade. Switzerland: United Nations Development Programme.
UNDP., C. . (2011). Cambodia Human Development Report 2011, Building Resilience: The Future of Rural Livelihoods in the Face of Climate Change.
Vietnam-UNDP. (2016). Human Development Report 2016, Briefing note for countries on the 2016 Human Development Report, Vietnam. Human Development Report 2016.
Vo. T. T. (2008). Narrowing the Development Gap in ASEAN: Approaches and Policy. in Soesastro, H. (ed.): ERIA Research Project Report 2007-1-2.
W. H. Greene. (2012). econometric analysis (Vol. Seventh Edition). New York University.
Yan Wang. (2006 ). Globalization and its Impact: East Asia and Vietnam. Hanoi, Vietnam: The World Bank .
Z. Hamid and R. M. Amin. (2013). Trade and Human Development in OIC Countries: A Panel Data Analysis. Islamic Economic Studies, 21(2), 55-70. doi:DOI No. 10.12816/0001558
Zhuang, H. (2016). The effect of foreign direct investment on human capital development in East Asia. Journal of the Asia Pacific Economy, 195-211.
doi:http://dx.doi.org/10.1080/13547860.2016.1240321
17
Appendix 1: Detail description of selected variables without taking logarithm
Sign Variables Sources Expected
outcome Obs. Mean SD Min Max
Dependent variable
HDI Human
development Index
IMF and
UNDP n/a 84 0.52 0.08 0.38 0.68
Independent variables Globalization variables
FDI
Foreign direct investment, net
inflows (% of GDP) WDI, World
Bank
+ 79 4.90 2.56 0.25 10.31
Trade International trade
(% of GDP) + 79 86.60 48.73 0.17 178.77
Financial development variables
M2 Broad money (% of
GDP)
WDI, World Bank
+ 79 38.38 30.57 7.70 137.65
Credit
Domestic credit to private sector (% of GDP)
+ 79 26.16 30.40 3.12 114.72
Controlled variables
Labor
Labor force participation rate for ages 15-24, total (%)
WDI, World Bank
+ 84 65.80 6.94 56.50 78.62
Pop Population growth
(annual %)
WDI, World Bank
+/- 84 1.44 0.51 0.62 3.23
Rural Rural population
growth (annual %) +/- 84 0.68 0.76 -0.49 2.79
Urban Urban population
growth (annual %) +/- 84 3.54 1.39 2.10 6.95
GDP GDP growth
(annual %)
WDI, World
Bank + 84 7.78 2.48 0.09 13.84
Dummy factor variables FDI x Cambodia
Taking number 1 in observing period and 0, otherwise
+/- 79 0.47 0.82 0.00 2.33
FDI x Lao PDR +/- 79 0.29 0.67 -1.37 2.14
FDI x Myanmar +/- 79 0.21 0.44 0.00 1.88
FDI x Vietnam +/- 79 0.45 0.78 0.00 2.27
Trade x Cambodia +/- 79 1.25 2.10 0.00 4.97
Trade x Lao PDR +/- 79 1.15 1.92 0.00 4.46
Trade x Myanmar +/- 79 0.01 0.96 -1.79 3.86
Trade x Vietnam +/- 79 1.28 2.15 0.00 5.19
M2 x Cambodia +/- 79 0.83 1.43 0.00 4.20
M2 x Lao PDR +/- 79 0.61 1.22 0.00 3.59
M2 x Myanmar +/- 79 0.87 1.47 0.00 3.84
M2 x Vietnam +/- 79 1.10 1.86 0.00 4.92
Credit x Cambodia +/- 79 0.68 1.23 0.00 4.14
Credit x Lao PDR +/- 79 0.45 0.92 0.00 3.04
Credit x Myanmar +/- 79 0.52 0.91 0.00 2.89
Credit x Vietnam +/- 79 1.05 1.80 0.00 4.74
Source: Author’s illusion
Note: Dummy variables are calculated after logarithm to determinant variables such as FDI, trade, M2 and credit is
18 Appendix 2: CLMV countries – A snapshot of HDI and economic growth
[image:19.595.67.530.162.304.2]Cambodia, Lao PDR, Myanmar and Vietnam, known as CLMV countries have been taking a ways longer for the nation to reform her economic and connect to the world through trade and financial liberation since 1986.
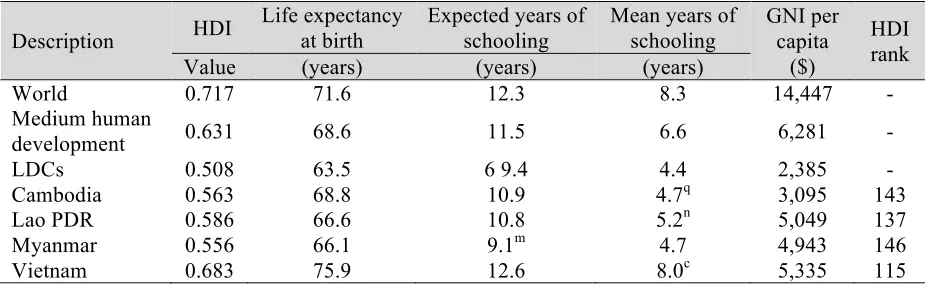
Table A.1: CLMV – Human development indicators comparing to rest of the world, (2015)
Description HDI
Life expectancy at birth
Expected years of schooling
Mean years of schooling
GNI per capita
($)
HDI rank
Value (years) (years) (years)
World 0.717 71.6 12.3 8.3 14,447 -
Medium human
development 0.631 68.6 11.5 6.6 6,281 -
LDCs 0.508 63.5 6 9.4 4.4 2,385 -
Cambodia 0.563 68.8 10.9 4.7q 3,095 143
Lao PDR 0.586 66.6 10.8 5.2n 5,049 137
Myanmar 0.556 66.1 9.1m 4.7 4,943 146
Vietnam 0.683 75.9 12.6 8.0c 5,335 115
Source: Author’ compilation, data generated from IMF
Note: q = Based on data from ICF Macro Demographic and Health Surveys for 2006–2015.
n = Based on data from United Nations Children’s Fund (UNICEF) Multiple Indicator Cluster Surveys for 2006– 2015.
m = Updated by HDRO based on data from UNESCO Institute for Statistics (2016). c = Updated by HDRO using Barro and Lee (2016) estimates.
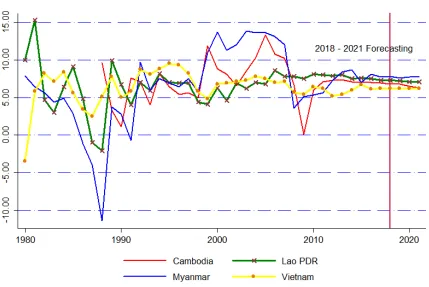
With the total population of 168 million and GDP growth rate averagely approximates 7% per year, CLMV’s market size is 267.33 billion USD, (World Bank, 2016). According to ASEAN Secretariat indicates that in 2015, combined merchandise trade amounted to US$ 385.5 billion and contributed 16.9% to ASEAN’s total trade, compared with 14.1% in 2014. In the same period, foreign direct investment into the four countries totaled US$17.4 billion, which constituted 14.6% of total inward direct investment to ASEAN.
Positive absorbed from Economic growth (figure 1.1) has brought the region transferring to transition economics and development. The path of development is onward and continued, particularly in the form of capital investment, financial liberalization, enhancing and monitoring skill – labor force etc. Lao PDR for example is aiming to remove itself from the list of least developed countries (LDC) by 2020 and eradicate mass poverty by 2010. It is not differ, Cambodia in 2016, has transferred from lower income country to the lower middle income status as GDP per capital approximates 1,269.91 USD, (World Bank, 2016).
19 Figure A.1: CLMV - Path of growth rate trend, (2000 – 2022)
Source: Author’s compilation, data generated from IMF
20 Appendix 3: CLMV – ASEAN, HDI, averaging decomposition period
Period 1990-2000 2000-2005 2005-2010 2010-2015 Growth Rate (2010/15) CLMV
Cambodia 0.382 0.449 0.510 0.549 0.076
Lao PDR 0.430 0.482 0.522 0.567 0.086
Myanmar 0.392 0.450 0.499 0.542 0.086
Viet Nam 0.528 0.597 0.637 0.670 0.053
ASEAN 6
Brunei Darussalam 0.803 0.827 0.842 0.858 0.020
Indonesia 0.565 0.618 0.646 0.678 0.040
Malaysia 0.684 0.728 0.752 0.781 0.026
Philippines 0.601 0.634 0.657 0.674 0.045
Singapore 0.771 0.823 0.880 0.920 0.044
Thailand 0.611 0.669 0.702 0.733 0.049
Source: Computer compilation, data generated from IMF
21 Appendix 4: CLMV - 2015 KOF Index of Globalization, 1970 to 2012
Source: Dreher, Axel, 2006, Does Globalization Affect Growth? Empirical Evidence from a new Index, Applied Economics
38, 10: 1091-1110
Note: The Red line denotes political globalization index, the Blue one is economic globalization index, the Black one is
social globalization index whereas the Brown one is overall globalization index.
Appendix 5: CLMV- International trade, FDI inflows and GDP per capital, 1990 – 2016
Variable Mean SD Min Max Cambodia
FDI net inflows (% of GDP) 6.03 2.77 1.75 10.31 Trade (% of GDP) 109.57 26.81 48.72 144.61 GDP per capita growth (annual %) 5.52 2.77 -1.40 11.49 Lao PDR
FDI net inflows (% of GDP) 3.52 2.43 0.25 8.53 Trade (% of GDP) 69.92 13.98 35.85 86.32 GDP per capita growth (annual %) 4.96 1.46 1.40 6.89 Myanmar
FDI net inflows (% of GDP) 2.97 1.19 1.82 6.52 Trade (% of GDP) 11.65 18.61 0.17 47.32 GDP per capita growth (annual %) 7.70 3.68 -2.01 12.69 Vietnam
FDI net inflows (% of GDP) 5.86 2.42 2.78 11.94 Trade (% of GDP) 120.86 36.99 66.21 184.69 GDP per capita growth (annual %) 5.36 1.21 3.12 7.76
22 Appendix 6: CLMV – International trade, FDI and GDP per capital, 1990 – 2016
Source: Author’s calculation, data generated from WDI, the World Bank (2017)
Note: Full sample observations is calculated from 1990 to 2016
Appendix 7: CLMV – Financial development trend (1993 – 2016)
Source: Author’s calculation, data generated from WDI, the World Bank (2017) Note: All data is denoted as % of GDP
23 Appendix 8: Plotting regression of coefficients by simple static panel data method
Source: Computer compilation, author's calculation
24 Appendix 9: Estimating parameter coefficients based on quantile regression without checking robust standard error
Source: Computer compilation, author's own calculation, quantile regression based