A KNOWLEDGE FRAMEWORK FOR AUTOMATING AND CONTROLLING MANUFACTURING
Higher Education
ARTICLE INFO ABSTRACT
This paper addresses a framework that incorporate four integrated models; a mathematical formulation model which integrate final products with sub
generate optimal solution. The second model is the simulation which
model to generate set of items of information. The third model is a knowledge base structure that records simulation output, and manufacturing organization procedures and policies. The fourth model is an automatic internal contro
structure and detect any violations to the procedures and policies set up by management of the manufacturing organization. The framework enables the internal control to explore data and information and to act as a guard against any misuse of the manufacturing system properties. It acts against any error occurrence, threats, and irregularities that might lead to inconsistencies. The framework supports a set of policies that monitors and c
determines how much of each item should be manufactured or be kept in warehouses, when low items should be replenished, and how many items should be assembled or be ordered when replenishment is needed. Altho
among researchers and manufacturers, they also have a number of drawbacks due to the complexity of real-world problems. Using simulation, knowledge base, and internal contr
productivity. The proposed framework provides a traceability capability for finished products and their relationships. It also provides reasoning capabilities on the manufacturing system objects. The framework allows the complex simul
the changing environment variables. The framework performs a querying system to furnish top management with a clear understanding of the structure of risks that may occur. This framework provide
terms of profits as well as enabling to remove any processes that are overly complicated
Copyright©2016, Abid Thyab Al Ajeeli. This is an open access article
use, distribution, and reproduction in any medium, provided the original work is properly cited.
INTRODUCTION
A manufacturing system is a very complex network of physical activities, decision making and information flows. Hence, the complexity of the development and the integration of such a system increase with the complexity of the degree of automation. In this paper, a framework of a knowledge base as is proposed as the basis to organize information in an automatic manufacturing environment. Such systems can provide significant advantages in terms of knowledge management, integrity control, object abstraction, d abstraction, and very high level programming. The power of
*Corresponding author: Abid Thyab Al Ajeeli, Higher Education Committee, C. O. R., Iraq.
ISSN: 0975-833X
Article History:
Received 21st May, 2016 Received in revised form 24th June, 2016
Accepted 12th July, 2016
Published online 20th August,2016
Key words:
Manufacturing, Raw material, Internal Control, Finished product, Optimality, Constraints, Knowledge Base, Transient State.
Citation: Abid Thyab Al Ajeeli, 2016. “A knowledge framework for
Current Research, 8, (08), 36436-36448.
RESEARCH ARTICLE
A KNOWLEDGE FRAMEWORK FOR AUTOMATING AND CONTROLLING MANUFACTURING
SYSTEMS ACTIVITIES
*Abid Thyab Al Ajeeli
Higher Education Committee, C. O. R., Iraq
ABSTRACT
This paper addresses a framework that incorporate four integrated models; a mathematical formulation model which integrate final products with sub-assemblies and raw materials in order to generate optimal solution. The second model is the simulation which
model to generate set of items of information. The third model is a knowledge base structure that records simulation output, and manufacturing organization procedures and policies. The fourth model is an automatic internal control interacting with the knowledge base structure in order to browse the structure and detect any violations to the procedures and policies set up by management of the manufacturing organization. The framework enables the internal control to explore data and information and to act as a guard against any misuse of the manufacturing system properties. It acts against any error occurrence, threats, and irregularities that might lead to inconsistencies. The framework supports a set of policies that monitors and controls finished products and raw materials. It determines how much of each item should be manufactured or be kept in warehouses, when low items should be replenished, and how many items should be assembled or be ordered when replenishment is needed. Although integration concept of manufacturing processes has enjoyed increased popularity among researchers and manufacturers, they also have a number of drawbacks due to the complexity of
world problems. Using simulation, knowledge base, and internal contr
productivity. The proposed framework provides a traceability capability for finished products and their relationships. It also provides reasoning capabilities on the manufacturing system objects. The framework allows the complex simulation model to be manageable for the purpose of adaptation to the changing environment variables. The framework performs a querying system to furnish top management with a clear understanding of the structure of risks that may occur. This framework provides top managements with clear picture of how to make their production lines more efficient in terms of profits as well as enabling to remove any processes that are overly complicated
is an open access article distributed under the Creative Commons Attribution License, which use, distribution, and reproduction in any medium, provided the original work is properly cited.
A manufacturing system is a very complex network of physical activities, decision making and information flows. Hence, the complexity of the development and the integration of such a system increase with the complexity of the degree of paper, a framework of a knowledge base as is proposed as the basis to organize information in an automatic manufacturing environment. Such systems can provide significant advantages in terms of knowledge management, integrity control, object abstraction, design abstraction, and very high level programming. The power of
this framework is illustrated in detail in the context of manufacturing process planning, which is one of the major components of an automatic manufacturing environment (Shoham, 2016). Before starting the discussion of manufacturing systems and how to deal wit
can handle such systems, one needs to introduce a number of terms including modeling. A model may be viewed as a representation of real life activities while a system can be viewed as a section of reality. A common property of all physical systems is that they are composed of components interacting with one another. The physical laws that govern their behavior determine the nature of the interactions in these systems. A system, in our case, is an organized group of entities such as people, equipment, methods, principles, procedures, internal control mechanism, raw materials and finished product, which come together and work as one unit. A
International Journal of Current Research Vol. 8, Issue, 08, pp.36436-36448, August, 2016
INTERNATIONAL
A knowledge framework for automating and controlling manufacturing systems activities
A KNOWLEDGE FRAMEWORK FOR AUTOMATING AND CONTROLLING MANUFACTURING
This paper addresses a framework that incorporate four integrated models; a mathematical assemblies and raw materials in order to generate optimal solution. The second model is the simulation which simulates the mathematical model to generate set of items of information. The third model is a knowledge base structure that records simulation output, and manufacturing organization procedures and policies. The fourth model l interacting with the knowledge base structure in order to browse the structure and detect any violations to the procedures and policies set up by management of the manufacturing organization. The framework enables the internal control to explore data and information and to act as a guard against any misuse of the manufacturing system properties. It acts against any error occurrence, threats, and irregularities that might lead to inconsistencies. The ontrols finished products and raw materials. It determines how much of each item should be manufactured or be kept in warehouses, when low items should be replenished, and how many items should be assembled or be ordered when replenishment is ugh integration concept of manufacturing processes has enjoyed increased popularity among researchers and manufacturers, they also have a number of drawbacks due to the complexity of world problems. Using simulation, knowledge base, and internal control model will improve productivity. The proposed framework provides a traceability capability for finished products and their relationships. It also provides reasoning capabilities on the manufacturing system objects. The ation model to be manageable for the purpose of adaptation to the changing environment variables. The framework performs a querying system to furnish top management with a clear understanding of the structure of risks that may occur. This framework make their production lines more efficient in terms of profits as well as enabling to remove any processes that are overly complicated.
ribution License, which permits unrestricted
framework is illustrated in detail in the context of manufacturing process planning, which is one of the major components of an automatic manufacturing environment Before starting the discussion of manufacturing systems and how to deal with framework that can handle such systems, one needs to introduce a number of terms including modeling. A model may be viewed as a representation of real life activities while a system can be viewed as a section of reality. A common property of all systems is that they are composed of components interacting with one another. The physical laws that govern their behavior determine the nature of the interactions in these systems. A system, in our case, is an organized group of equipment, methods, principles, procedures, internal control mechanism, raw materials and finished product, which come together and work as one unit. A
INTERNATIONAL JOURNAL OF CURRENT RESEARCH
simulation model characterizes a system by mathematically describing the responses that can result from the interactions of a system’s entities. The set of values of variables in a system at any point in time is called the state of the system at that point in time.
The proposed framework incorporates simulation-based performance assessment for such complex manufacturing systems with automated material handling mechanism (Simulation in Manufacturing, 2016; Robinson, 2014). A simulation may be performed through solving a set of equations (a mathematical model), constructing a physical model, staged rehearsal, variables estimation, keeping track of inventory management, risk measurement, or a computer graphics model. simulations are very useful tools that allow experimentation without exposure to risk, they are gross simplifications of the reality because they include only a few of the real-world factors, and are only as good as their underlying assumptions. Simulation in manufacturing systems is defined as a organized system that enables a computer model of any manufacturing system to analyze and obtain important information from it. However, their use has been limited due to the complexity of some software packages and the lack of preparations that users have in the field of probability and statistics. This technique represents a valuable tool used by engineers when evaluating the effect of capital investment in equipment and physical facilities like factory, warehouses, and distribution centers. Simulation can also be used to predict the performance of an existing or expected system and to compare alternative solutions for a particular design problem (Driessel and Monch, (2007).
Therefore, we consider a coupling architecture that connects simulation models of the manufacturing knowledge base system and the automated material handling with a shop-floor control system. The center point of this architecture is a blackboard-type data layer between the shop-floor control system and the simulation engine. We provide detailed information on how the different subsystems communicate and how each system triggers events of the other systems. We show by means of a case study how this framework supports the required performance assessment and internal control implementation (Sprenger and Monch, 2008). In simulation system, a discrete event is an instantaneous action that occurs at a unique point in time. A raw material part arriving at a delivery dock, a customer arriving at a bank, and a machine finishing a cycle of production are examples of discrete events. A continuous event continues uninterrupted with respect to time. The temperature of water in a lake raising and lowering during a day, the flowing of oil into a tanker, and chemical conversions are simple examples (Driessel and Monch, 2007). Simulation has been a widely used tool for manufacturing system design and analysis for more than three decades. During this period, simulation has proven to be an extremely useful analysis tool (Ornella and Benny, 2008; Turban and Aronson, 2001). The proposed framework incorporates, in addition to the simulation system, control systems of policies and procedures established and maintained by top management in order to collect, record and process data and report the resulting information to enhancing the reliability of the automated entities of the manufacturing system.
1. Background on Manufacturing Sector
The manufacturing sector is very broad and complex. It encompasses firms that make everything from abrasives to light bulbs, including both industrial and consumer products, as well as both finished products and raw materials and/ or sub-assemblies used to manufacture finished products. Demand for manufactured goods is ultimately driven by consumer spending. The profitability of individual companies depends on their efficiency of production and distribution. Large manufacturers often have sizeable economies of scale in purchasing, production, and marketing. Small companies can effectively compete by producing specialized products for which large economies of scale do not exist. The manufacturing sector is fragmented, with the 50 largest companies accounting for less than half of manufacturing revenues (Smith, 2003). A number of important trends have recently emerged within the manufacturing sector. As the sector, along with much of the world economy, continues a slow rebound from the depths of the 2007 financial crisis, managers must identify ways to streamline operations without sacrificing the integrity of the financial reporting and the proper application of key processes and procedures. Globalization entails new growth opportunities, but also entails new risks which must be properly mitigated by existing or new internal controls. Outsourcing and off shoring result from an increasingly globalized economy where transportation and communications costs continue to decline, thereby making it more cost effective to take advantage of lower wages somewhere, the outsourcing and off shoring trends have reversed in a handful of areas within the manufacturing sector.
The most important objective of simulation in manufacturing is to understand the change to the whole system since it is easy to understand the difference made by changes in the local system but it is hard or impossible to assess the impact of this change in the overall system. Simulation gives us some measures and analysis of such impact (Delaware Valley Industrial Resource Center, 2016; Wildberger, 1995):
Parts produced per unit time
Time spent in system by parts
Time spent by parts in queue
Time spent during transportation from one place to another
In time deliveries made
Build up of the inventory
Inventory in process
Percent utilization of machines and workers.
Some other benefits include Just-in-time manufacturing, calculation of optimal resources required; validation of the proposed operation logic for controlling the system, and data collected during modeling that may be used elsewhere. Simulation is used to address some issues in manufacturing as follows: In workshop to see the ability of system to meet the requirement, to have optimal inventory to cover for machine failures (Graul et al., 2003). Simulation provides insight into the manufacturing system so that top management can have control on the manufacturing system variables. The simulated variables will be incorporated into the knowledge base. Simulation involves testing specific values of the decision or uncontrollable variables in the model and observing the impact on the output variables. Simulation is usually used only when a problem is too complex to be treated by numerical or analytical optimization techniques (Terkaj and Urgo 2014). The current available tools and techniques for solving manufacturing problems have a number of drawbacks such as large integer problems and an inefficient implementation with some interfacing obstacles (Velazco, 1994). They require sufficient items of information of the specified domain (Nakagiri and Kuriyama, 1994).
2.Construction Automated Framework
A manufacturing organization is an industrial site, usually consisting of buildings and machinery, or more commonly a complex having several buildings, where workers manufacture goods or perate machines processing one product into another. Factories arose with the introduction of machinery when the capital and space requirements became too great for workshops. Most modern factories have large warehouses or warehouse-like facilities that contain heavy equipment used for assembly line production. Large factories tend to be located with access to multiple modes of transportation, with some having rails, highways and water loading and unloading facilities.
The proposed framework for manufacturing system has two main models:
a. The finished products model, and b. The raw materials model.
The sub-system or sub-assemblies may need to go through one or more floor shops or factories in order to be manufactured as a final product. At each floor shops a number of actions, controls, procedures, and rules have to be adopted. These activities and the accountability for them should be recorded and can be queried whenever a decision on them is required.
2.1 Finished Product Model
The finished product model has three main cost components. These cost componentsinclude (Sharma et al., 1994):
Setup cost: This is the cost of changeover a production line from making one product to making a different product. Set up costs favor large production runs result in larger inventory. The low setup costs favor smaller runs with fewer inventories. Set up cost is not always straight forward to calculate or estimate. It may be a complicated mathematical function that has no analytical solution. In this case a mathematical simulation technique needs to be adopted. The warm-up period discussed the simulation experiments is one element of set up cost as well as deficiencies in production line due to processes that are overly complicated.
Holding costs: These are the costs that organizations incur in purchase and storing of the inventory. They include the costs of financing the purchase, storage, handling, taxes, obsolescence, pilferage, breakage, spoilage, reduced flexibility and opportunity cost. Holding costs are also known as carrying costs. The scope of inventory management also concerns the fine lines between replenishment lead time, carrying costs of inventory, asset management, inventory forecasting, inventory valuation, inventory visibility, future inventory price forecasting, physical inventory, available physical space for inventory, quality management, replenishment, returns and defective goods and demand forecasting and also by replenishment Or can be defined as the left out stock of any item used in an organization. Above variables that contribute to the holding cost may be hard to compute or estimate, and each variable may need to be fitted into a probabilistic distribution. The values of variables will be generated by running simulation tools on the probabilistic distribution until a steady state is reached.
Shortage costs: This is the cost of not having stocks when they are needed. These costs include loss of goodwill, loss of a sale, loss of a customer, loss of profit, and late penalties. Many of these costs are difficult or impossible to measure with any accuracy without using simulation techniques (Detty and Yingling, 2000).
The finished product model has the form:
Total Finished Cost = Setup cost + holding cost + shortages cost
Variables associated with the finished product model are recorded in the knowledge base an explained as follows: D = finished product demand per unit time, Q = finished production quantity,
C3= shortages cost per unavailable unit per unit time, S = shortages quantity,
P1 = (1 - D / P), where P is production rate per unit time.
The variable, T is the length of the production cycle, TP is the actual production time, and TD is the demand time when there is no production processing (Weida et al., 2001; Internal Control, 2016; Manufacturing organization, 2016). In real life situations, all above variable values are not known in advance and they are following a probabilistic distribution. It would impossible to estimate their values without using simulation. The output of the simulation is considered control on the behavior of the manufacturing model (Beasley, 2016; Shen et al., 2006).
3.Manufacturing System Model
A finished product model is developed through the process of a very complicated interaction of raw materials and sub-assemblies. Each unit of a finished product may be produced by combining, on average, hundreds of items. The number of items from each type required is not evenly distributed. In order to facilitate the formulation and the understandability of a simulated model, we assume that assembled component Aj is made up by raw materials and/or assembled components R1, R2, ..., Rj of kind Jw out of kind w where J = 1, 2 ,3, ..., im and 1<= im <= m. Kj and Zj are decision variables indicating the time between raw material j releases for level 1 and level 2 respectively. The raw material model (Last) is not just a mathematical model. It is a planning model (MMS 2010) that provides planning and control of the functions supporting the complete cycle (flow) of materials, and the associated flow of information. These functions include identification, cataloging, standardization, need determination, scheduling, procurement, inspection, quality control, packaging, storage, inventory control, distribution, and disposal. Raw material model can mathematically be built as follows:
Total Raw Material Costs = Ordering Costs + Holding Costs We assume shortages of raw materials are not permitted as situations in real life do not allow shortages of raw materials; otherwise production processes will be stopped. The model would be:
Where RMCj is the cost for the raw material number j. The above formula can be described as follows
A number of fixed costs were not explicitly mentioned in the formulation of the model. These costs may include labor, machinery, overheads ... etc. These costs have no effects on the solution of the model. They, the fixed costs, can be added to the total variable costs or they can be added to the set-up costs (administrative costs), holding costs, or shortages costs.
When finished products and raw materials models are combined, the following integrated model is produced.
Total Variable Cost = Integrated Model Cost = Finished Product Total Cost + Raw Material Total Cost
One should mention that limited material handling capacity may lead to starvation of highly expensive process equipments. Consequently, in order to assess production performance involved in production capacity (or turn-around time) of a material handling simulation is required to be integrated with production simulation (Orchard and Hoag, 2014; Mautz and Winjum, 1981; Beasley et al., 2010). These restriction variables such as space, time, capacity, and other key resources can affect manufacturing performance. Restrictions may be imposed on any variable. For example, Kj may be constrained into
Lj <= Kj <= Uj,
Constraints may be imposed on T, S, or the total raw material. One can issue a number of queries regarding manufacturing production lines and the associated activities such as what are the numbers of components need more than 10 parts
4.Automation and Controlling
In order to have a visible insight into the frame of activities associated with manufacturing systems, a high degree of automation is required. Automation is also required to safeguard manufacturing organization's assets, and to detect and deal with errors and irregularities (Orchard and Hoag, 2014; Mautz and Winjum, 1981; Beasley et al., 2010). Internal control is one of the techniques that safeguards organization's assets. Internal control is defined as the process for assuring achievement of an organization's objectives in operational effectiveness and efficiency, reliable financial reporting, and compliance with laws, regulations and policies. In a broad concept, internal control involves everything that controls risks of an organization (Federal Reserve 2016). It is a means by which an organization's resources are directed, monitored, and measured. It plays an important role in detecting and preventing fraud and protecting both physical and intangible organization's resources. Internal control automation aims to reduce errors and irregularities a minimum possible level.
4.1 Knowledge base structure
The paper introduces logic knowledge base to incorporate automatic mechanisms in the form of facts, rules, and conclusions. A knowledge is the underlying set of facts, assumptions, and rules which a computer system has available to solve a problem. This definition can be rephrased as follows:
A collection of data organized in a form that facilitates analysis by automated deductive processes.
The items of information representing the collective kn owledge of an organization, arranged in a way that make search and retrieval more attractive.
Facts are statements that can have arguments as shown below:
T Raw Material Cost = K )j
j=1 M
Relation (argument1, argument2, …, argumentN).
Rules are a key concept in building logical relationships. Rules enable management to draw conclusions about the behavior of the manufacturing environment activities. A rule has the form:
Conclusion (arg1, arg2, …, argN) :- relation1, relation2, …, relationN.
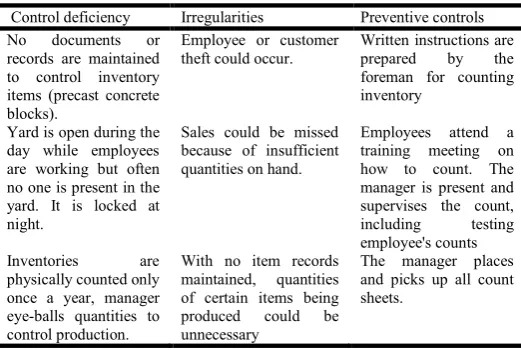
The conclusion is only valid if all the relations are also logically 'true'. Commas work exactly like the logical 'and'. It can be read as: conclusion is true if everything that comes after the ':-' can also be proven true. Anything comes before the ':-' is called head, and what comes after ',' body. For example the knowledge base, for inventory system, incorporates logic facts such as control deficiencies, how such deficiencies will reduce the system trust, and what measure one can take in order to prevent undesirable action. In other words what automatic control one can implement. Table 1 explains a sample of a knowledge base structures and can be interpreted into fact template as follows:
Control Automation (Deficiency, Irregularity, Preventive Control): Rules are a key concept in building logical relationships. Rules enable management to draw conclusions about the behavior of the manufacturing environment activities. A rule has the template form:
Conclusion (P) :- deficiency (X), irregularity (Y):
Conclusions can automatically be drawn by proving the truth of the body. A query can be issued in the form:
What is the conclusion Control Deficiency? Or just issue conclusion (Variable)
[image:5.595.32.293.580.755.2]Logic programming mechanism will search table for matching and instantiate the 'Variable' arguments, after verification. Conclusions will be issued and displayed or recorded depending on the satisfaction of the logical facts or the logical rules. It is also possible to introduce any constraints and conditions into the structure of the issued query. Search and instantiation mechanisms can be terminated when certain conditions are met.
Table 1. Snapshot of Inventory automatic control
Control deficiency Irregularities Preventive controls
No documents or
records are maintained to control inventory items (precast concrete blocks).
Employee or customer theft could occur.
Written instructions are
prepared by the
foreman for counting inventory
Yard is open during the day while employees are working but often no one is present in the yard. It is locked at night.
Sales could be missed because of insufficient quantities on hand.
Employees attend a training meeting on how to count. The manager is present and supervises the count,
including testing
employee's counts
Inventories are
physically counted only once a year, manager eye-balls quantities to control production.
With no item records maintained, quantities of certain items being produced could be unnecessary
The manager places and picks up all count sheets.
Investment in inventories may be comprised of a large number of merchandise items that can be readily under errors, irregularities, and threats. Keeping track of finished product or raw material is essential to ensuring that the production processes will not run short of materials. This means that a manufacturing organization needs to implement an array of controls, either to prevent threats or to ensure that the manufacturing operation does not run short of inputs. Below is a list of key controls a company should consider for investment in inventories (Moutray, 2013). The following facts can be inserted into the knowledge base structure.
Control (Organize the inventory, A fundamental basis for inventory internal control is to number all locations, identify inventory item, and track these items by location).
Control (Count all incoming inventory, Count the inventory received before recording. This keeps errors from being introduced into the inventory records).
Control (Inspect incoming inventory, Verify that all incoming inventory is of the correct type and is not damaged. All items that fail inspection should be returned at once, and the accounts payable staff notified that the returned items should not be paid for).
Control (Tag all inventory, Every scrap of inventory in the warehouse should be identified with a tag, which states the part number, description, unit of measure, and quantity).
Control (Audit the bill of materials, The bill of materials is a record of the parts used to construct a product. The bill of materials is used to pick items from stock, if the bill is incorrect, pickers will pull incorrect amounts from the warehouse. This calls for a periodic audit of every bill, as well as password-only access to the bill of material records in the computer system).
Control (Segregate customer-owned inventory, If there is inventory on-site that customers own, the warehouse staff will likely count it as though it is owned by the company, so have a procedure in place for labeling these items as customer-owned when they arrive, and segregate them in a separate part of the warehouse).
Control (Standardize record keeping for inventory picking, When an item is picked from the shelf in the warehouse, for use either in the production area or for sale to customers, have a standard procedure for recording the picks as soon as they leave the warehouse. It is recommended to have warehouse fence, and inventory can only pass through a single controlled gate).
Control (Trace extra requisitions and returns, If the production staff asks for extra issuances of parts, or returns excess amounts to the warehouse, then there is an error in the picking records).
Control (Conduct cycle counts, Have the warehouse staff conduct small, frequent counts of a small portion of the inventory, and investigate and correct any errors they find. This gradually improves the inventory record accuracy).
Control (Investigate negative-balance inventory records, If a negative inventory exists. it means a transactional flaw t caused the negative balance. This is a prime target for a detailed investigation).
Control (Fence and lock the warehouse, The single most important inventory control is simply locking down the warehouse. This means that you construct a fence around the inventory, lock the gate, and only allow authorized personnel into the warehouse).
Control (Record scraps transactions, Do not just throw scrap in a scrap bin when it occurs. If you do, the accounting system still thinks the scrapped item is in stock, and so will overstate the amount of inventory. Instead, create a procedure to track scrap on a regular basis).
Control (Sign for all inventory removed from the warehouse, If inventory items are being removed from the warehouse for reasons outside of the normal picking process, have the person removing the inventory sign for the removal, so that there is a record of accountability).
From above facts, managers can issue queries to follow up irregularities and threats and to choose an appropriate decision.
The purpose of this work is to provide a solid foundation for the automation of manufacturing activities. The paper takes into account a number of issues supporting internal control functionality such as:
Safeguard assets: ensures that assets are protected from damage or destruction, unauthorized used and unauthorized removal.
Maintain data integrity: ensures that data is authorized, accurate, complete, non-redundant, timely, and private.
Achieve organizational objectives effectively: ensures that manufacturing systems are developed, implemented, operated, and maintained to meet the needs of their major stakeholders.
Consume resources efficiently: ensures that products are designed and tuned to minimize the resources they use.
4.2 Schedule
A schedule is the conversion of a project action organization into an operating timetable to serve as the basis for monitoring and controlling project activities, as well as, the organization budget; it is probably the major tool for the management of projects. In a project environment, the scheduling function is more important than it would be in an ongoing operation. Projects lack the continuity of day-to-day operations and often present much more complex problems of coordination. The basic approach of scheduling techniques is to form a network of activity and event relationships (Sharma et al., 1994). Such
networks are a powerful tool for organizing and controlling an organization and have the following benefits:
It is a framework for organizing, scheduling, monitoring, and controlling projects activities.
It outlines the interdependence of tasks, work packages, and work elements.
It denotes times when specific individuals must be available for work on a given task.
It aids in ensuring that the proper communications take place between departments and functions.
It determines the expected project completion date.
It identifies critical activities that will delay the project completion time.
It identifies activities with slack that can be delayed for specific periods without penalty.
It determines the dates on which tasks may be started, or must be started to stay on schedule.
It illustrates which tasks must be coordinated to avoid resource timing conflicts.
It illustrates which tasks may run, or must be run, in parallel to achieve the predetermined project completion date;
It relieves interpersonal conflict by showing the task dependencies.
The above points can be formulated as facts and governed rules that establish connections. Facts and rules can then be inserted into the designated knowledge base for future browsing and querying. This mechanism will support the internal control performing its functionality effectively and efficiently.
5. The Role of Manufacturing Management
Evaluate top management performance by examining 4 major functions:
• Planning: determine the goals of the knowledge base systems function and the means of achieving these goals.
• Organizing: Gathering, allocating, and coordinating the recourses needed to accomplish the goals.
• Leading: Motivating, guiding and communicating with personnel.
• Controlling: Comparing actual performance with organization performance as a basis for taking any corrective actions that are needed.
organization. Preparing the organization involves recognizing opportunities and problems that confront the organization in which manufacturing systems can be applied cost effectively, identifying the resources needed to provide the required information, formulating strategies and tactics for acquiring the needed resources and poor information systems planning can also result in an organization losing its competitive position within the marketplace. Proper management of a manufacturing system is to achieve harmony of objectives, a person’s or group’s objectives must not conflict with the organization’s objectives. It requires that managers must motivate subordinates, direct them, and communicate with them. Ineffective leadership can result in system failure.
Top management of a manufacturing organization has overall responsibility for designing and implementing effective internal control. Top management, by the help of internal control, will be responsible and accountable for providing governance, guidance and oversight for manufacturing activities. In a large manufacturing organization, the chief executive fulfills this duty by providing leadership and direction to senior managers and reviewing the way they are controlling the business (Bowswell, 1999).
Internal control assists management in optimizing the use of resources by:
Ensuring as far as practical that reliable information is provided to management for the determination of business policies; and
Monitoring the implementation of those policies and the degree of compliance with them.
A management objective, to which internal controls are relevant, is the prevention and detection of error, threats, and fraud of financial information or misappropriation of assets. The establishment and maintenance of internal controls to meet this objective is subject to management's usual requirement that any control be cost-effective. The cost of a possible control would be weighed against the relative likelihood of error and fraud occurring and the consequences if any were to occur, including their effect on the financial statements. This internal control is a guard that can be built through a number of if-statement analysis that use the knowledge base to answer management's queries or investigation to identify responsibilities. Internal control procedures applied on a timely basis contribute to the reliability of financial information. Such information must be available when it is needed if it is to be useful for decision-making and control purposes. A system of internal control consists of five key components:
1. Control environment. Integrity, ethical values and competence of the personnel within the organization;
2. Risk assessment. A process of identifying, analyzing and managing the risks faced by the organization.
3. Control activities. The selection of appropriate internal control policies and procedures to address the risks identified and evaluated in 2 above and to achieve the entity's objectives effectively.
4. Information and communication. These enable the entity's personnel to develop and exchange the
information needed to conduct, manage and control its operations.
5. Monitoring. Monitoring helps determine and report the effectiveness with which internal control procedures accomplish their intended purpose so that the system can react dynamically, and modifications can be made in response to changing conditions.
In order to accurately measure progress in improving manufacturing productivity it is important to issue the set of queries such as. Does the company apply the standard metric for measuring the effectiveness of manufacturing processes? Does it measure changeovers, plan maintenance, and
meetings-Organization Production Time? Does system
implement improvement processes: Lean Manufacturing, Constraints, and Six Sigma? How internal control deals with monitoring process? Information and communication? Risk assessment? Control environment?
6. Computational Experiments Output
For each simulation scenario experiments have been conducted to demonstrate the viability of the proposed manufacturing system and the simulation model. Monitoring is effective when properly planned and supported by the organization. This plan and support form the foundation for monitoring which includes: a tone from the top about the importance of internal control, an organizational structure that considers the roles of management and the board in regard to monitoring, and the use of evaluators with appropriate capabilities and objectivity, and a baseline understanding of internal control effectiveness.
Simulation Scenarios
Monitoring process is essential for internal control, For example, if a production manager does not perform an inventory count over a two-week period, top management is alerted to the lapse during a review of its statistical reports. After receiving this alert, the top management notifies the store manager directly and requests for failing to perform the inventory. The district manager and regional director responsible for the store are also notified. In addition, the issue is documented on a Store Operations Recap Report, which serves as a clearinghouse for all exception items identified by the top management.
Simulation Scenario 1
In this example, consider the items of information listed below: Input: m = 4, c1=56, c2=2.59, c3=1.9, p=380, d:=165, p1=
1.0-d/p,
Raw Material Demand: x(1):= 495; x(2):= 825; x(3):=165; x(4):=330;
Holding Costs: hc(1):=0.005; hc(2):=4.221; hc(3):=0.401; hc(4):=10.024;
Ordering Costs: o(1):=40.87; o(2):=32.91; o(3):=14.19; o(4):=12.23;
Safety Stocks: b(1):= 495; b(2):=825; b(3):=165; b(4):=330;
Minimum costs = $758.442
Optimal Production Cycle = 0.55 months
Shortages Allowed are: 38 units
Reorder Raw Material (1) After 78 Days Reorder Raw Material (2) After 12 Days Reorder Raw Material (3) After 36 Days Reorder Raw Material (4) After 12 Days
It comes now the job on internal control to present items of information to management according to procedures, policies, rules, and induction. The internal control issues an automatic alert to managements presenting to them that product 1 needs to keep running for 17 days with total minimum cost $758.442. The system allows shortage of 38 units. The system has 4 items of raw materials with reordering time 78, 12, 36, and 12 days. Following management rules and procedures, the framework warns you that the number of product allowed to be out of stock is 30 units only and the manufacturing system suggests 38. These contradict with your policy number 19.
Simulation Scenario 2
In this experiment, consider the problem listed below:
Input: m= 6; c1:=34;c2:=1.59;c3:=1.2; p:=4400;d:=1155; p1:= 1.0-d/p;
Raw Material Demand: x(1):= 1155;x(2):= 1155; x(3):=2310;x(4):=2310;x(5):=1155;x(6):=3465;
Holding Costs:
hc(1):=0.05;hc(2):=0.021;hc(3):=0.001;hc(4):=0.002; hc(5):=0.003; hc(6):=0.01;
Ordering Costs:
o(1):=4.87;o(2):=2.91;o(3):=1.19;o(4):=3.23;o(5):=2.74;o(6):= 4.46;
Safety Stocks:
b(1):=10;b(2):=20;b(3):=10;b(4):=10;b(5):=10;b(6):=10;
After running the simulated model the following output is outlined below:
Minimum costs = $248.836
Optimal Production Cycle = 0.37 months Shortages Allowed are: 182 units Reorder Raw Material (1) After 33 Days. Reorder Raw Material (2) After 39 Days Reorder Raw Material (3) After 81 Days Reorder Raw Material (4) After 96 Days Reorder Raw Material (5) After 87 Days Reorder Raw Material (6) After 42 Days
Simulation Scenario 3
In this experiment, consider the items of data that received by the framework as an input as outlined below:
m:= 10; c1:=34;c2:=1.59;c3:=1.2; p:=4400;d:=1155; p1:= 1.0-d/p; x(1):= 1155;x(2):= 1155; x(3):=2310;x(4): =2310;x(5): =1155;x(6):=3465; x(7):= 3465; x(8):=4620; x(9):= 2310; x(10):=1155;
hc(1):=0.05;hc(2):=0.021;hc(3):=0.001;hc(4):=0.002;hc(5):=0. 003;
hc(6):=0.01;hc(7):=0.12; hc(8):= 0.076; hc(9):=0.0025; hc(10):=0.11;
o(1):=4.87;o(2):=2.91;o(3):=1.19;o(4):=3.23;o(5):=2.74;o(6):= 4.46;
o(7):=4.43; o(8):=3.21; o(9):=8.76; o(10):=5.01; b(1):=10;b(2):=20;b(3):=10;b(4):=10;b(5):=10;b(6):=10; b(7):=10; b(8):=20; b(9):=10;b(10):=20;
The framework has a number of capabilities that cannot be found in other systems, as far as the author aware. These capabilities enable managers or engineers to impose any types of constraints and restrictions they wish and think of.. For example, a manager wishes to find the best available solution taking into consideration as shown below:
T > 0.0 and T <= 0.5, S >= 0 and S <= 144, 0.7 <= K1 <= 1.6 1 <= K2 <= 2.3 1 <= K3 <= 3.2 2 <= K4 <= 1.9 1 <= K5 <= 1.6 1 <= K6 <= 2.6 1 <= K7 <= 1.4 1 <= K8 <= 1.6 0 <= K9 <= 2.5 1 <= K10 <= 1.6
After running the simulated model the following output is generated s shown below:
Minimum costs = $383.70
Optimal Production Cycle = 0.325 months Shortages Allowed are: 134 units
Reorder Raw Material (1) After 40 Days Reorder Raw Material (2) After 42 Days Reorder Raw Material (3) After 42 Days Reorder Raw Material (4) After 42 Days Reorder Raw Material (5) After 42 Days Reorder Raw Material (6) After 42 Days Reorder Raw Material (7) After 39 Days Reorder Raw Material (8) After 39 Days Reorder Raw Material (9) After 60 Days Reorder Raw Material (10) After 48 Days
Simulation Scenario 4
Monitoring process is essential for internal control, For example, if a production manager does not perform an inventory count over a two-week period, top management is alerted to the lapse during a review of its statistical reports. After receiving this alert, the top management notifies the store manager directly and requests an explanation for failing to perform the inventory. The district manager and regional director responsible for the store are also notified. In addition, the issue is documented on a Store Operations Recap Report, which serves as a clearinghouse for all exception items identified by the top management.
An organization is specialized in selling item. The sale follows a uniform distribution of values between 1 and 3 items per day. After placing an order for a new shipment of items, arrival time follows a normal distribution with a mean of 2 weeks and a standard deviation of 0.6 weeks. In the past, the manager has placed an order when the quantity has dropped to 21 items. Set up a simulation and experiment with various reorder quantities to see which values seem to work better.
Scenario 5 provides some of the specific details of reports that the organization used in monitoring. This is intended as a supplement to the discussion above for those who would like to understand the process in greater detail.
Simulation Scenario 5
Expand the experiment varying the reorder point as well as the reorder quantity. Experiment with various values. Set up a data table to report results.
When optimality criteria is applied the following numerical results is obtained: 1 = 0.08781833, 2 = 52.00098, and 3
is positive for all Kj, j=1,...,M. The minor values for j=1,2,..., 6 are 953.0471, 331.406, 13.88616, 23.11795, 16.06441, 455.7297 respectively. As the principal minors are strictly positive, the point ( T*, S*, Kj*) is a minimum of the function Tvc(T*,S*,Kj*). The above statements prove that the proposed model has actually optimal solutions.
Sales Uniform Distribution
Minimum 1
Maximum 3
Normal Arrival Distribution
Mean 2.0
Standard Deviation 0.6
Reorder Quantity 21
Starting Quantity 44
Results
Average Inventory 28.7
Minimum Inventory 0.0
Maximum Inventory 55.0
Number of Stockouts 16
0=No, 1=Yes
Day Inventory Sales Ending Inventory Orders Pending Orders Days Till Arrival Arrival Date Arrivals
1 44 1 43 0 0 0 0 0
2 43 1 42 0 0 0 0 0
6 35 1 34 1 0 0 16 0
14 20 1 19 1 0 0 16 0
15 19 1 18 1 0 0 16 0
981 38 2 36 1 0 0 987 0
982 36 1 35 1 0 0 987 0
Sales Uniform Distribution
Minimum 1
Maximum 3
Normal Arrival Distribution
Mean 2.0
Standard Deviation 0.6
Reorder Quantity 21
Reorder Point 30
Starting Quantity 44
Results
Average Inventory 19.4
Minimum Inventory 0.0
Maximum Inventory 51.0
Number of Stockouts 31
0=No, 1=Yes
Day Inventory Sales Ending Inventory Orders Pending Orders Days Till Arrival Arrival Date Arrivals
1 44 1 43 0 0 0 0 0
2 43 2 41 0 0 0 0 0
3 41 3 38 0 0 0 0 0
10 25 1 24 1 0 0 20 0
975 11 3 8 1 0 0 981 0
976 8 3 5 1 0 0 981 0
981 21 3 18 0 1 10 991 21
From experience with the proposed framework, one can find that it satisfies the most important three control criteria;
effectiveness in which the quality of the output corresponds to the given goal and efficiency in which one can measure how long users take to complete the product and the mental resources they need to spend on interaction with the product; and ease of use in terms of general attitudes towards the product and specific attitudes towards or perception of the interaction with the tool. During the annual strategic planning process, the leadership teams reporting to them identify and prioritize manufacturing process quality risks. The activity is subjective (i.e., not driven by a quantitative analysis of risk significance and likelihood) and draws on the extensive experience of the professionals involved as shown below (Sawyer's Guide for Internal Auditors 1 2012; Internal Control 2016)
Improper design of customer-requested components and related manufacturing processes.
The risk associated with it includes: Inadequate specifications received from customer, Failure (through lack of skills or proper design analysis procedures) to address appropriately the risk that the component will fail, Failure (through lack of skills or proper design analysis procedures) to address appropriately the risk that the component will cause a system failure or not operate as intended in the system in which it is installed, and Failure to follow established manufacturing design procedures related to raw material selection, production methods and/or testing routines
Improper manufacture of components within quality tolerances
The risk associated with it includes: Failure to establish proper quality-tolerance metrics, Failure to follow up when tolerances are exceeded, inadequate skills of manufacturing personnel, and/or inadequate oversight of manufacturing process.
Untimely delivery of components to customer
The risk associated with it includes: Failure to establish reasonable delivery deadlines with customer, and/or Failure to recognize delays in a timely manner for possible correction or discussion with customer.
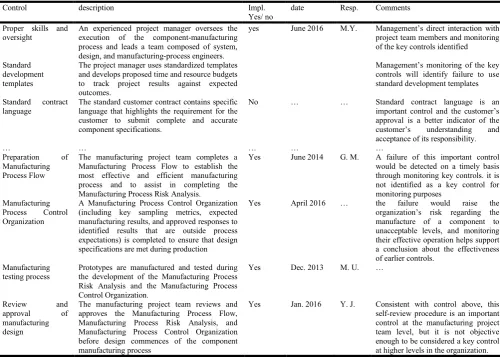
The framework provides a template fact of 6-tuple that will be recorded in the knowledge base in the form:
Report (Control, Description, Implemented, Date, Responsibilities, Comments)
We can add more items to the template fact above. Samples of 6-tuple of internal control is shown in Table II (COSO 2016).
Top management can issue a number of queries for example: Who is responsible for control "Testing Process"? What are the descriptions? Are there any comments? Has the control been implemented?
[image:10.595.47.548.432.790.2]Other complicated questions may be issued for example:
Table II: 6-tupe template internal control facts
Control description Impl.
Yes/ no
date Resp. Comments
Proper skills and oversight
An experienced project manager oversees the execution of the component-manufacturing process and leads a team composed of system, design, and manufacturing-process engineers.
yes June 2016 M.Y. Management’s direct interaction with
project team members and monitoring of the key controls identified
Standard development templates
The project manager uses standardized templates and develops proposed time and resource budgets to track project results against expected outcomes.
Management’s monitoring of the key controls will identify failure to use standard development templates
Standard contract language
The standard customer contract contains specific language that highlights the requirement for the customer to submit complete and accurate component specifications.
No … … Standard contract language is an
important control and the customer’s approval is a better indicator of the
customer’s understanding and
acceptance of its responsibility.
… … … … …
Preparation of
Manufacturing Process Flow
The manufacturing project team completes a Manufacturing Process Flow to establish the most effective and efficient manufacturing process and to assist in completing the Manufacturing Process Risk Analysis.
Yes June 2014 G. M. A failure of this important control would be detected on a timely basis through monitoring key controls. it is not identified as a key control for monitoring purposes
Manufacturing Process Control Organization
A Manufacturing Process Control Organization (including key sampling metrics, expected manufacturing results, and approved responses to identified results that are outside process expectations) is completed to ensure that design specifications are met during production
Yes April 2016 … the failure would raise the
organization’s risk regarding the manufacture of a component to unacceptable levels, and monitoring their effective operation helps support a conclusion about the effectiveness of earlier controls.
Manufacturing testing process
Prototypes are manufactured and tested during the development of the Manufacturing Process Risk Analysis and the Manufacturing Process Control Organization.
Yes Dec. 2013 M. U. …
Review and
approval of
manufacturing design
The manufacturing project team reviews and approves the Manufacturing Process Flow, Manufacturing Process Risk Analysis, and Manufacturing Process Control Organization before design commences of the component manufacturing process
What are the controls responsible by M.U and what are the items produced and who are the customers?
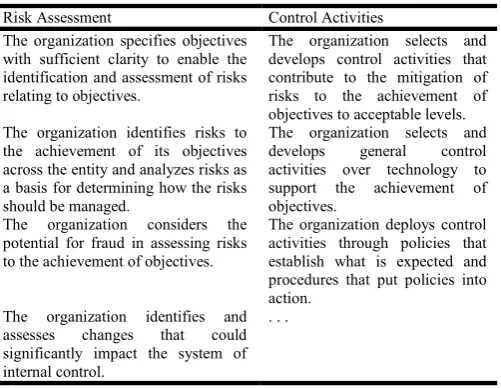
Top managements, therefore will have a clear pictures and oversight on manufacturing system activities and can take the right decision while they are in their offices. Table III shows
[image:11.595.34.285.198.392.2]risk assessment against control activities (Muñoz-Villamiza et al., 2013; COSO 2016).
Table III: Key Principles for the Risk Assessment and Control Activities Components Internal Control – Integrated Framework
(Muñoz-Villamiza et al., 2013)
Risk Assessment Control Activities
The organization specifies objectives with sufficient clarity to enable the identification and assessment of risks relating to objectives.
The organization selects and develops control activities that contribute to the mitigation of risks to the achievement of objectives to acceptable levels. The organization identifies risks to
the achievement of its objectives across the entity and analyzes risks as a basis for determining how the risks should be managed.
The organization selects and
develops general control
activities over technology to support the achievement of objectives.
The organization considers the potential for fraud in assessing risks to the achievement of objectives.
The organization deploys control activities through policies that establish what is expected and procedures that put policies into action.
The organization identifies and assesses changes that could significantly impact the system of internal control.
. . .
As highlighted in Table III, managers must carefully identify objectives with sufficient clarity to enable the identification and assessment of risks to achieving these objectives. In addition, auditors must evaluate whether the internal control over financial reporting is effective in order to mitigate the risk of misstated and/or fraudulent financial statements.
7. Probability of Control System Failure
Preventive controls are aimed at deterring or forestalling errors and irregularities. If no errors occur, then no losses can result. Unfortunately, no controls or preventive measures are 100% reliable. Detective or corrective controls and other compensating strategies are aimed at minimizing the consequences of errors and irregularities once they occur, thus minimizing the expected losses incurred from various types of exposures. Preventive controls are often silent in their operation and it is difficult to determine their degree of effectiveness. Detective controls actually find errors, thus leaving evidence of their functioning. Preventive controls are usually cheaper than detective controls to implement and operate (Shin et al., 2013). The reliability of a system depends upon the effectiveness of preventive and directive controls, the detective controls and the corrective measures implemented. One way of putting this relationship is as follows:
R = 1 - (X * Y)
where R is reliability, X is the probability of errors and irregularities occurring in the first place, and Y is the probability of failing to detect and instantaneously correct any
errors and irregularities if they occur. X can further be defined as P(e) and Y can be defined as P(d) * P(c), where P(e) is the probability of error, P(d) is the probability of failing to detect the error, and P(c) is the probability of failing to correct it. The limitation of this formulation is that all errors and irregularities are assumed equal in magnitude and consequence. Also, it is, not system unreliability per se that is our main concern, but the exposures and losses stemming from such unreliability (Goble, 2010).
Since control systems, like other systems, can have faults, the selection of control measures would generally include a proper mix of:
1. Preventive and directive measures aimed at potential system faults (i.e., to prevent things going wrong); 2. Detective measures aimed at the "things that went
wrong" and, corrective measures to address the resulting errors, omissions, irregularities, and so on; and 3. Compensating strategies aimed at minimizing the
amount of loss in the event of a failure of systems or controls.
System faults can lead to increases in various exposures and, ultimately, to losses (Failure rate, 2012). Control systems address inherent system faults and/or the "things that went wrong" to reduce exposures to an acceptable level.
8. Conclusions and Suggestions
This paper suggested the study of a framework that incorporates four integrated models. The first one is a mathematical formulation model which integrates final products with raw materials in order to generate optimal solution. The second model is the simulation which simulates the mathematical model to generate set of items of information. The third model is a knowledge base structure that records simulation output, manufacturing organization procedures and policies. The fourth model is an automatic internal control interacting with the underlying knowledge base structure in order to browse the structure and detect any violations to the procedures and policies set up by the management of the manufacturing organization. The framework enables the internal control to explore data and information and to act as a guard against any misuse of the manufacturing system properties. It acts against any error occurrence, threats, and irregularities that might lead to inconsistencies. The framework supports a set of policies that monitors and controls finished products and raw materials. It determines how much of each item should be manufactured or be kept in warehouses, when low items should be replenished, and how many items should be assembled or be ordered when replenishment is needed. The paper addressed an important application issue: how well an integrated model can describe the real world applications. The idea was to integrate the finished products, sub-assemblies and raw materials in one model. Simulation is used to generate a number of scenarios in what-if-analysis approach in order to deal with uncertainty.
where mathematical techniques do not work or hard to analytically or numerically optimize. Simulation is used in two general types of situations:
The probability distributions cannot be expressed in mathematical forms as we have seen in our models.
The model is too complex. There are too many components, and the model is thus impossible to solve using mathematical methods.
Introducing artificial intelligence in the simulated applications provides a laboratory to generate and examine models and what-if scenarios that involve many uncertainties. The intelligent system can examine not only results but assumptions, particularly as far as probabilities are concerned. Material handling capacity is taken into consideration on performance assessment involved in production capacity, and the framework also allows the complex simulation model to be manageable for the purpose of adaptation to the changing environment. Moreover, the framework employs a material handling request-driven approach rather than a process request-driven approach in order to implement both push and pull flows of production loads. Thus, nondeterministic part routing is facilitated. In addition, interfaces between the simulation model and shop-floor control systems were represented as triggering events and decision flows, whereby the framework was equipped with capabilities to plug in arbitrary shop-floor control systems. Processing a large amount of items of information about system components, control variables, and the interdependency structures create new challenges on the shoulder of engineers and managers. The proposed framework provides a traceability capability for manufactured components and their relationships. It provides manager and engineer with sufficient items of information in order to detect inconsistencies. i.e. it has reasoning capabilities on the system objects. This paper suggests for future works to discuss some key issues by implementing agent-based manufacturing systems such as agent encapsulation for enhancing control automation, agent organization, agent coordination and negotiation, system dynamics, learning, optimization, security and privacy, tools and standards.
REFERENCES
Beasley J. E. 2016. http://people.brunel.ac.uk/~mastjjb/jeb/or/ invent.html, Retrieved June 2016.
Beasley, M. S., Carcello, J. V., Hermanson, D. R., & Neal, T. L. 2010. Fraudulent Financial Reporting 1998 – 2007: An analysis of U.S. public companies. Committee of Sponsoring Organizations (COSO), Jersey City, NJ. Boston Consulting Group 2011. Productivity-adjusted wage
rates will near US rates by 2015, assuming current capital-labor tradeoffs and low-cost U.S. location (chart), shown in Supply Chain Digest’s On Target e-magazine (2011). Retrieved June 2016 from http://www.scdigest.com/ ONTARGET/11-06-06- 1.PHP?cid=4609&ctype=content. Bowswell, C. 1999. “Process Simulation Software Offers
Efficiency and Savings”, Chemical Market Reporter, Vol. 256, No. 13, September 1999.
COSO 2016. Guidance on Monitoring Internal Control Systems, http://www.coso.org/documents/volumeiii-applicationtechniques.pdf, Retrieved June 2016.
Delaware Valley Industrial Resource Center 2016. Manufacturing Success – Making it in the U.S.A. Retrieved June 2016, from http://www.dvirc.org/manufacturing-success-making-it-in-the-u-s-a/
Detty, R. B. & Yingling, J. C. 2000. "Quantifying benefits of conversion to lean manufacturing with discrete event simulation: A case study". International Journal of Production Research, 38 (2): PP. 429–445.
Driessel R. & L. Monch, 2007. Simulation framework for complex manufacturing systems with automated material handling, Proceedings of the 39th conference on Winter Simulation WSC'07, pp 1713-1721, IEEE Press Piscataway, NJ, USA.
Driessel R. & L. Monch, 2007. Simulation framework for complex manufacturing systems with automated material handling, Proceedings of the 39th conference on Winter Simulation WSC'07, pp 1713-1721, IEEE Press Piscataway, NJ, USA.
Failure rate, 2012. Failure Rate and Event Data for use within Risk Assessments, Retrieved from http://www.hse. gov.uk/landuseplanning/failure-rates.pdf, June 2016. Federal Reserve 2016. Historical statistics for industrial
production, capacity, and utilization: Manufacturing (seasonally adjusted). Retrieved June 2016, from http://www.federalreserve.gov/releases/g17/current/table12 .htm.
First Research 2013. Manufacturing sector industry profile. First Research, a division of Hoover’s, Inc., Austin, TX. Goble, W. M. 2010. Control Systems: Safety Evaluation and
Reliability, International Society of Automation, Third Edition, USA.
Graul, M., F. Boydstun, M. Harris, R. Mayer, O. Bagaturova, 2003. "Integrated Framework for Modeling & Simulation of Complex Production Systems", Knowledge Based Systems, Inc.
Internal Control 2016. http://www.accountingtools.com/ inventory-internal-controls. Retrieved June 2016.
Internal Control 2016. https://en.wikipedia.org/wiki/Internal_ control, Retrieved June, 2016.
Manufacturing organization, 2016. https://en.wikipedia.org/ wiki/Factory, Retrieved in June 2016.
Mautz, R. K. & J. O. Winjum, 1981. Criteria for Management Control Systems. Published by Financial Executives Research Foundation.
MMS, 2010. Material Management System (MMS) User's Guide, Version 1.0, State Highway Administration, State of Maryland, March 22, 2010, retrieved from https://www. roads.maryland.gov/OMT/MMSGuide.pdf, July 2016. Moutray, C. 2013. Global Manufacturing Economic Update,
June 14, 2013 (a publication of the National Association of Manufacturers). Retrieved June 2016, from http://www.
nam.org/Communications/Publications/Global- Manufacturing-EconomicUpdate/Archives/GMEU-061413.aspx.