Abstract—A technique for edge detection in images and its hardware implementation is presented in this communication. The presented technique applies soft computing strategies for each of the stages of the edge detection process. Fuzzy logic and Lukasiewicz's algebra operator are applied in the above mentioned stages. The hardware implementation of the system takes as design criterion the low cost and a high processing speed.
Index Terms—Edge detection, Fuzzy Logic system, hardware implementation.
I. INTRODUCTION
The edge detection algorithms in images allow extracting information from the image and reducing the stored required information. An edge is defined as a sharp change in the luminosity intensity between a pixel and another adjacent one. Most of the edge detection techniques can be grouped in two categories: gradient based techniques and Laplacian based methods. The techniques based on gradient use the first derivative of the image and look for the maximum and the minimum of this derivative. Examples of this type of strategies are: the Canny method [1], Sobel method, Roberts method [2], Prewitt method [3], etc. On the other hand the techniques based on Laplacian look for the cross by zero of the second derivative of the image. An example of this type of techniques is the zero-crossing method [4].
Normally the edge extraction mechanisms are implemented executing the corresponding software realisation on a processor. Nevertheless in applications that demand constrained response times (real time applications) the specific hardware implementation is required. The main drawback of implementing the edge detection techniques in hardware is the high complexity of the existing algorithms. For that reason this paper presents a technique that offers reasonable results for detecting edges in images and simultaneously it allows low cost hardware realisations and high processing speed. The method is based on applying soft computing techniques such as fuzzy logic and Lukasiewicz algebra operator. The utility of this technique is related to the simplicity of the operations for edge calculation that makes it very suitable for hardware implementation.
Angel Barriga and Nashaat M. Hussein are with the Instituto de Microelectrónica de Sevilla (CNM-CSIC)/University of Seville, Spain, (fax: +34 955056686; e-mail: [email protected]).
This work was supported in part by the Spanish Education and Research Council under grant no. TEC2005-04359/MIC, and by the Andalusia Regional Government under grant no. TIC2006-635
This paper is organized in three sections. Section 2 presents the proposed edge detection algorithm in images. It describes each stage of the edge detection process. Section 3 raises the hardware implementation of the proposed technique and analyzes the performance of the circuit.
II. EDGE DETECTION ALGORITHM
In this section a method of edge detection applying soft computing techniques is going to be presented. The method is applied to the luminosity of the image. An image is a bidimensional matrix of pixels whose values belong to certain range of values. In this communication each pixel is codified with 8 bits, which gives rise to 256 possible values of grey tones. Therefore an image is a function of two variables (dimensions) in the range from 0 to 255.
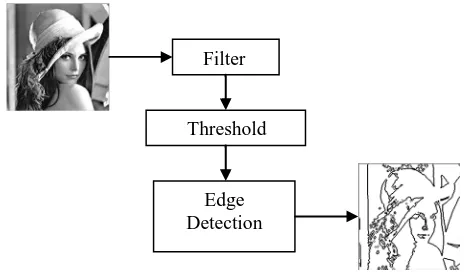
The process of edge detection in an image consists of a sequence of stages shown in figure 1. The first stage receives the input image and applies a filter in order to eliminate noise. The second step applies a threshold in order to classify the pixels of the image under two categories, black and white. The resulting image is a binary image. Finally, in the last stage the detection of edges is performed.
Filter
Threshold
[image:1.595.309.541.471.607.2]Edge Detection
Fig. 1. Diagram flow for edge detection.
A. The Filter Stage
The filter stage allows to improve the details of edges in images, or to reduce or eliminate noise patterns. The target of the filter step consists in eliminating all those points that do not provide any type of information of interest. The noise corresponds to nonwished information that appears in the image. It comes principally from the capture sensor (quantisation noise) and from the transmission of the image (fault on transmitting the information bits). Basically we consider two types of noise: Gaussian and impulsive (salt&peppers). The Gaussian noise has its origin in differences of gains of the sensor, noise in the digitalization,
Hardware Implementation of a Soft Computing
Technique for Edge Detection
etc. The impulsive noise is characterized by some arbitrary values of pixels that are detectable because they are very different from its neighbours. A way to eliminate these types of noise is by means of a low pass filter. This filter makes smoothed of the image replacing high and low values by average values.
The filter used in the proposed edge detection system is based on the bounded sum Lukasiewicz's operator. This operator comes from multi-valued Lukasiewicz algebra [5] and is defined as:
) , 1 min( ) ,
(x y x y
BoundedSum = + (1)
where x,y∈[0,1].
The behaviour of the bounded-sum is shown in figure 2. It consists in a normalized function in the range [0,1]. The main advantage of applying this operator comes from the simplicity of the hardware realisation as we will discuss in section 3.
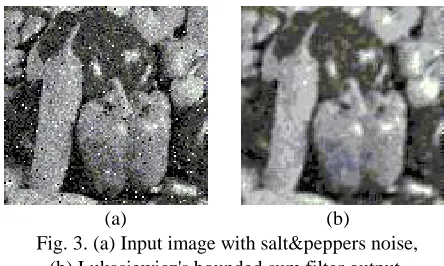
Fig. 2. Bounded sum graphical representation The Lukasiewicz's bounded sum filter performs the smoothing of the image and is suitable for salt&peppers noise as well as Gaussian. Figure 3 shows the effect of applying this type of filter.
(a) (b)
Fig. 3. (a) Input image with salt&peppers noise, (b) Lukasiewicz's bounded sum filter output.
The application of the filter has been made using a mask based on a 3x3 array. For the pixel xij the weighted mask is applied to obtain the new value yij as is shown in the following expression: ) 8 1 , 1 min( 1 1 1 1 ,
∑ ∑
− = =− + + = k l l j k i ij x y (2)B. The Threshold Stage
The techniques based in thresholding an image allow classifying the pixels in two categories (black and white). This transformation is made to establish a distinction between the objects of the image and the background. The way of
generating this binary image is making the comparison of the values of the pixels with a threshold T, that is, any value lower than the threshold value is considered to be an object whereas the values greater than the threshold belong to the background. > − < = T x if L T x if y j i j i j i , , , 1 0 (3) where xi,j is a pixel of the original image and yi,j is the pixel corresponding to the binary image. In the case of a monochrome image in that the pixels are codified with 8 bits the range of values that the pixels take corresponds to the range between 0 and 255 (L=256). It is usual to express the above mentioned range with normalized values between 0 and 1.
A basic technique for threshold calculation is based on the frequency of grey level. In this case the threshold T is calculated by means of the following expression:
∑
= = L i ii p T 1 (4) where i is the grey level, pi represents the grey level frequency (also known as the probability of the grey level). For an image with n pixels and ni pixels with the grey level i:∑
= = = L i i ii n n and p
p
1
1 (5)
In 1965 Zadeh proposed the fuzzy logic as a reasoning mechanism that uses linguistic terms [6]. The fuzzy logic is based on the fuzzy set theory in which an element can belong to several sets with different membership degree. This is opposed with the classic set theory in which an element belongs or not to a certain set. Thus a fuzzy set A is defined as
(
)
{
x x x X}
A= ,µ( ) ∈
where x is an object of the set of objects X and µ(x) is the
membership degree of the element x to the set A. In the classic set theory µ(x) takes values 0 or 1 whereas in the fuzzy set
theory µ(x) belongs to the range of values between 0 and 1.
The techniques that apply fuzzy logic for the threshold calculation are based mainly on three types of measures of fuzziness [7]: entropy, Kaufmann`s measure, and Yager's measure.
The technique based on the entropy consists of minimizing the dispersion of the system. This way the pixels of the image are grouped in two classes corresponding to the objects and to the background. Huang and Wang [8] consider that the averages of the data corresponding to each class are µ0 and µ1. The membership function of each class is defined as:
> − − + < − − + = T x if x x x T x if x x x x ux min max 1 min max 0 1 1 1 1 ) ( µ µ
The calculation of the threshold T is based on the entropy of a fuzzy set that is calculated using the function of Shannon:
) 1 log( ) 1 ( log )
(x x x x x
Hf =− − − −
[image:2.595.55.277.476.609.2]the data:
∑
=i
x f i hi
H M T
E( ) 1 (µ ()) ()
The Kaufmann’s measure of fuzziness is defined as [9]:
w X
x
w C A x x
A D
1 ) ( ) ( )
(
−
=
∑
∈
µ µ
This method is based on using the distance metric to the set
A. When w=1 the Hamming's distance is used whereas if w=2
it is the Euclidean distance.
The method of Yager [10] is based on the distance between a fuzzy set and its complementary. This way it is based in minimizing the following function:
∑
−=
i
x x i i
T
D2( ) µ () µ ()2
where (i) 1 x(i)
x µ
µ = − .
The proposed technique consists in applying fuzzy logic in the calculation of the threshold T. Basically, from a formal point of view, this technique is based on the calculation of the average applied to the histogram of the image. An advantageous aspect of this technique is that the calculation mechanism improves the processing time since it only requires processing the image once and allows calculating in a direct way the value of the threshold. From the point of view of hardware realisation there is a low cost architecture of the fuzzy processing module as it will be seen in a next section.
The fuzzy system has an input that receives the pixel that is going to be evaluated and an output that corresponds to the result of the fuzzy inference. Once read the image the output shows the value of threshold T. Basically the operation that makes the fuzzy system corresponds to the calculation of the centre of gravity of the histogram of the image with the following expression:
∑∑
∑∑
= =
= =
= M
i
ij R
j M
i
ij ij R
j
c
T
1 1 1 1
α α
(6)
where T is the threshold, M is the number of pixels of the image, R is the number of rules of the fuzzy system, c is the consequent of each rule and α is the activation degree of the rule.
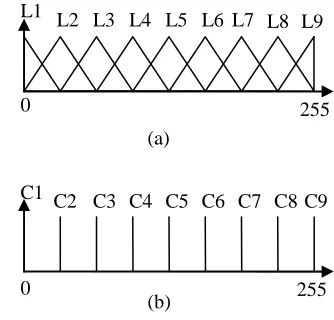
In order to make the fuzzy inference it is made a partition of the universe of discourse of the histogram in a set of N equally distributed membership functions. Figure 4 shows a partition example for N=9. Triangular membership functions have been used since they are easier for hardware implementation. These functions have an overlapping degree of 2 what allows to limit the number of active rules. The membership functions of the consequent are singletons equally distributed in the universe of discourse of the histogram. The use of singleton-type membership functions for the consequent allows applying simplified defuzzification methods such as the Fuzzy Mean. This defuzzification method can be interpreted as one in which each rule proposes a conclusion with a “strength” defined by its grade of activation. The
overall action of several rules is obtained by calculating the average of the different conclusions weighted by their grades of activation. These characteristics of processing based on active rules and simplified defuzzification method allows a low cost and high speed hardware implementation.
L2 L3 L4 L5 L6 L7 L9 L1
0 255
(a)
C2
C1 C3 C4 C5 C6 C7 C8
0 255
(b)
L8
[image:3.595.341.508.138.298.2]C9
Fig. 4. Membership functions for N=9, (a) antecedent, (b) consequent.
The rule base of the system of figure 5 used the membership functions defined in figure 4. The knowledge base (membership functions and the rule base) is common for any images, for that reason the values can store in a ROM memory.
[image:3.595.314.459.614.689.2]if x is L1 then c is C1; if x is L2 then c is C2; if x is L3 then c is C3; if x is L4 then c is C4; if x is L5 then c is C5; if x is L6 then c is C6; if x is L7 then c is C7; if x is L8 then c is C8; if x is L9 then c is C9; Fig. 5. Rulebase for N=9
It is possible to optimize the expression shown in (6) if the system is normalized. In this case the sum extending to the rule base of the grades of activation of the consequent takes value 1:
1 1
=
∑
=
R
i ij
α
Then (6) transforms in:
∑∑
= =
=
M
i
ij ij R
j
c M
T
1 1
1 α
(7) For each pixel the system makes the inference in agreement with the rule base of figure 5. The output of the system accumulates the result corresponding to the numerator of (7). The final output is generated with the last pixel of the image after the division by M.
threshold is in figure 6b.
(a) (b)
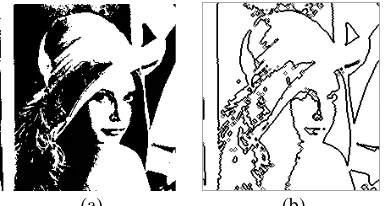
Fig. 6. (a) Lena`s image, (b) binary image.
C. The Edge Detection Stage
The next step is the edge detection. The input image for the edge detection is a binary image in which pixels take value 0 (black) or 1 (white). In this case the edges appear when a change between black and white takes place between two consecutive pixels.
= −
≠ − =
0 1
0 0
b a if
b a if aedge
where a and b are the values of consecutive pixels, and aedge is the resulting pixel value.
The edge generation consists of determining if each pixel has neighbours with different values. Since the image is binary every pixel is codified with a bit (black=0 and white=1). This operation of edge detection is obtained calculating the xor logic operation between neighbouring pixels using a 3x3 mask (figure 7).
xi-1,j-1 xi-1,j xi-1,j+1
xi,j-1 xi,j xi,j+1
xi+1,j-1 xi+1,j xi+1,j+1
Fig. 7. The 3x3 mask for edge detection
1 , 1 ,
1 1 , 1 , ,
, =
⊕
ij = i− j− ⊕ i− j⊕ ... ⊕ i+ j+ ji j
i x x x x
[image:4.595.66.259.70.179.2]y
Figure 8 shows an example of applying the xor operator on the binary image.
(a) (b)
Fig. 8. (a) Lena`s binary image, (b) edge detection. Using the 3x3 mask it is possible to refine the edge generation detecting the orientation of the edges. For it they can be considered the four orientations shown in figure 9. It gives rise to calculate the xor operation on 3 pixels. This way for a horizontal orientation we will have
1 , , 1 ,
,j = ij− ⊕ i j⊕ i j+ i x x x
y
Whereas for the case of 45º will be
1 , 1 , 1 , 1
,j = i+ j− ⊕ ij⊕ i− j+ i x x x
y
45o
0o 90o 135o
Fig. 9. Edge orientations in a 3x3 mask.
Figure 10 shows to the obtained results when making the edge detection on a set of test images.
[image:4.595.391.463.91.150.2]
Fig 10. Test images and edge detection results
III. HARDWARE IMPLEMENTATION
The circuit that realizes the edge detection has been implemented on a low cost FPGA device of the Xilinx Spartan3 family. This circuit receives the image from a vision sensor based on a CMOS chip that gives a CIF resolution (352x288). The image is stored in a double port RAM memory. The data memory width is 32 bits. This allows to read two words simultaneously.
Figure 11 shows the block diagram of the system. The image is captured by the camera. The camera provides an 8 bits pixel in each clock cycle. Then the pixel is stored in the RAM memory under the control of the memory control circuit. During the reading of the image the threshold is calculated since the threshold generation circuit receives the pixel coming from the camera. As soon as the image is stored in the memory the threshold generation circuit produce the threshold value of the image.
Memory control circuit
Camera Double port RAM
Threshold generation circuit
Edge detection circuit
32
32 4
32 8
8
[image:4.595.305.548.223.346.2]8
Fig. 11. Block diagram of the system.
[image:4.595.67.261.560.663.2] [image:4.595.353.512.605.730.2]words of 32 bits). This way the edge detection circuit is able to provide four output data in parallel that are stored in the external memory. Each data corresponds to a pixel of the edge image. This image is binary reason why only a bit is needed to represent the value of the pixel (0 if edge or 1 if background). The new image of the edges is stored in the above mentioned memory.
Next the two main blocks of the system will be described: the threshold generation circuit and the edge detection circuit.
A. The threshold generation circuit
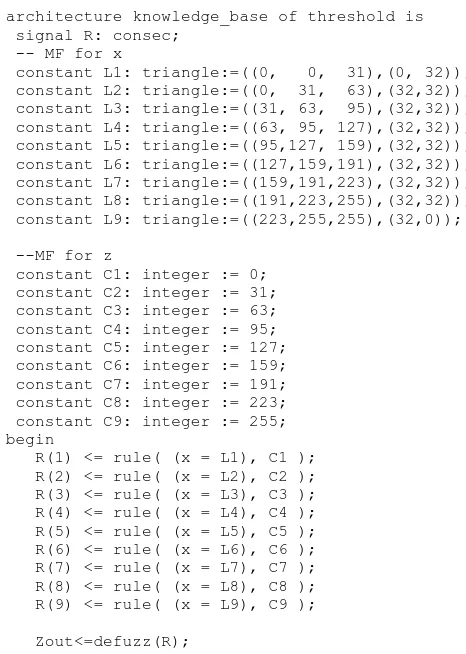
In order to implement the fuzzy system circuit that generates the threshold the design methodology used is described in [11]. This methodology is based on the hardware description language VHDL as a way to describe and model the system at high level. To achieve a behavioural modelling of the fuzzy inference module a VHDL description style will be used. In this description the system structure (fuzzy sets, rule base) and the operator description (connectives, fuzzy operations) are defined separately. This makes it possible to describe independently both the fuzzy system structure and the processing algorithm. The fuzzy system description must be synthesizable in order to generate the hardware realizations.
Figure 12 shows the VHDL architecture of the fuzzy system. The rule base is described in the architecture body. It contains a rule base structure with the 9 rules of figure 5. Each rule can be divided into two components: the antecedent of the rule and the consequent. The antecedent is an expression of the input variables related to their linguistic values. The consequent sets the linguistic value of the rule output.
The processing mechanisms of the fuzzy operation is (=) and the inference then (rule( , )) are not defined in the VHDL description. Only the structure of the rulebase is defined. Such a description is a high level description because it does not assume any specific implementation criteria. It only describes the knowledge base in terms of a behavioral rule base.
Linguistic labels represent a range of values within the universe of discourse of input and output variables. These labels can be described by functions in order to compute the membership degree of a certain input value. Membership functions associated to a linguistic label can be triangular or trapezoidal. The declarative part of the architecture of figure 12 shows the definition of such membership functions.
The data type triangle is defined in a VHDL package called ‘xfvhdlfunc’. This data type contains the definitions of the points that define a triangle as well as the slopes. On the other hand the rule base expresses the knowledge of figure 5. The function rule is also defined in the VHDL package. This function makes the inference of the rule. The set of rules is evaluated concurrently since the signal assignments in the architecture body are concurrent. The operator “=” has been redefined taking advantage of the functions overload properties in VHDL.
The functions used in the description of the fuzzy system have been described in agreement with the restrictions of VHDL for synthesis. This has allowed to generate the circuit that implements the fuzzy system using conventional circuit synthesis tools. The fuzzy inference module is a combinational circuit that makes the fuzzy inference.
architecture knowledge_base of threshold is signal R: consec;
-- MF for x
constant L1: triangle:=((0, 0, 31),(0, 32)); constant L2: triangle:=((0, 31, 63),(32,32)); constant L3: triangle:=((31, 63, 95),(32,32)); constant L4: triangle:=((63, 95, 127),(32,32)); constant L5: triangle:=((95,127, 159),(32,32)); constant L6: triangle:=((127,159,191),(32,32)); constant L7: triangle:=((159,191,223),(32,32)); constant L8: triangle:=((191,223,255),(32,32)); constant L9: triangle:=((223,255,255),(32,0));
--MF for z
constant C1: integer := 0; constant C2: integer := 31; constant C3: integer := 63; constant C4: integer := 95; constant C5: integer := 127; constant C6: integer := 159; constant C7: integer := 191; constant C8: integer := 223; constant C9: integer := 255; begin
R(1) <= rule( (x = L1), C1 ); R(2) <= rule( (x = L2), C2 ); R(3) <= rule( (x = L3), C3 ); R(4) <= rule( (x = L4), C4 ); R(5) <= rule( (x = L5), C5 ); R(6) <= rule( (x = L6), C6 ); R(7) <= rule( (x = L7), C7 ); R(8) <= rule( (x = L8), C8 ); R(9) <= rule( (x = L9), C9 );
[image:5.595.312.545.59.386.2]Zout<=defuzz(R); end knowledge_base;
Fig 12. VHDL architecture of the knowledge base The fuzzy inference module and the divider stage produce the threshold value of the image. The area occupied on a Xilinx Spartan3 FPGA device has been of 1,180 slices what is equivalent to 56,845 equivalent gates. The circuit can operate at a frequency of 137 MHz which would allow that the processing of an CIF image (352x288 pixels) will carry out in 0.7 ms. In case of an VGA image (1024x768) require a time of 5.7 ms to calculate the threshold.
B. Design of the edge detection system
The edge detection algorithm basically is constituted by three stages. In the first stage the Lukasiewicz bounded-sum is performed. After the filter stage a thresholding step is applied. This gives rise to a black and white monochrome image.
In the third stage the edges of the image are obtained. For it the final value of each pixel is evaluated. Only those pixels that are around the target pixel are of interest (a 3x3 mask). By this reason, if in the surroundings of a pixel the value is the same (all white or all black) then it means no edge and the output value associates the above mentioned pixel with the background of the image. When it is detected that some value of the surroundings of the pixel changes indicates that the pixel at issue is in an edge, reason why the black value is assigned to it.
stored in the mask registers.
pixel 1 pixel 2 pixel 3
pixel 4 pixel 5 pixel 6
pixel 7 pixel 8 pixel 9
[image:6.595.68.269.63.170.2]Functional Unit (FU)
Fig. 13. System schema
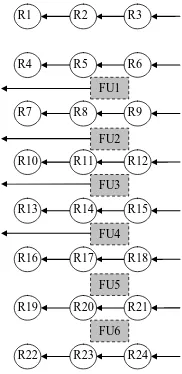
In order to improve the image processing time the mask was spread to an 8x3 matrix as is shown in figure 14. Each Functional Unit (FU) operates on a 3x3 mask in agreement with the scheme of figure 13. The data are stored in the input registers (R3, R6, R9, …) and they move in each clock cycle to their interconnected neighbours registers. In the third clock cycle the mask registers contain the data of the corresponding image pixels. Then the functional units operate with the mask data and generate the outputs. In each clock cycle the mask advances a column in the image. Pixels enter by the right and shift from one stage to another outgoing at the left side. It is a systolic architecture that follows a linear topology and allows processing several pixels in parallel.
The system receives two input data of 32 bits (this mean eight pixels). These data come from a double port memory that stores the image. The circuit also receives as input data the threshold (T) that has been calculated previously. The circuit generates as output the 4 bits corresponding to the output values of the processed pixels stored in R5, R8, R11 and R14.
R1 R2 R3
R4 R5 R6
R7 R8 R9
R10 R11 R12
R13 R14 R15
R16 R17 R18
R19 R20 R21
R22 R23 R24 FU1
FU2
FU3
FU4
FU5
FU6
Fig. 14. Block diagram of the 8x3 architecture. The functional unit operates on the 3x3 mask and generates the output value corresponding to the evaluated element of the mask.
The system has been implemented on an FPGA of the Spartan3 Xilinx family. The circuit occupies an area of 293 slices that supposes a cost of 5,361 equivalent gates. It can operate at a 77 MHz frequency, although the development board used has a 50MHz clock. This supposes that the required time to process an image is 0.335 ms what allows to process 2,985 images per second.
IV. CONCLUSION
The hardware implementation of an edge extraction system has been presented in this paper. The edge detection algorithm is based on soft computing technique. Thus the calculation of the threshold that allows to obtain a binary image is realized by means of a fuzzy logic inference mechanism. The conditioning of the image for its later processing is based on a filter that uses Lukasiewicz's bounded sum. The main advantage of this edge detection technique is that it allows a very efficient hardware implementation in terms of cost and speed. This makes it specially indicated in applications that require a real time processing.
REFERENCES
[1] J. F. Canny, “A computational approach to edge detection”, IEEE
Trans. Pattern Analysis and Machine Intelligence, 1986, pp. 679-698.
[2] L. G. Roberts, “Machine perception of three-dimensional solids”, in J. T. Tippet et al., editor, Optical and Electro-Optical Information
Processing,, MIT Press, Cambridge, Massachusetts, 1965, (pp.
159-197).
[3] J.M.S. Prewitt, “Object enhancement and extraction”, in A. Rosenfeld and B. S. Lipkin, editors, Picture Processing and Psychophysics, Academic Press, New York, 1970, (pp. 75-149).
[4] Marr, D., and Hildreth, E., “Theory of Edge Detection”, Proceedings
of the Royal Society London, 207, 1980, pp. 187-217.
[5] P. Amato, A. Di Nola, B. Gerla, “Neural Networks and Rational Lukasiewicz Logic”, Proceedings. NAFIPS. Annual Meeting of the
North American, 2002, pp. 506-510.
[6] Zadeh, L.A., “Fuzzy sets”, Information and Control, vol. 8, 1965, pp. 338-353.
[7] Forero-Vargas, M.G., Rojas-Camacho, O., “New formulation in image thresholding using fuzzy logic”, 11th Portuguese Conf. on Pattern
Recognition, 2000, pp. 117-124
[8] Huang, L.K., Wang, M.J.,”Image thresholding by minimizing the measure of fuzziness”, Pattern Recognition, vol. 28, 1995, pp. 41-51. [9] Kaufmann, A., Introduction to the theory of fuzzy subsets, Academic
Press, 1975.
[10] Yager, R.R., “On the measure of fuzziness and negation. Part 1: membership in the unit interval”. Int. Journal of Genet. Syst., vol. 5, 1979, pp. 221-229.
[11] A. Barriga, S. Sánchez Solano, Brox, P., A. Cabrera, I. Baturone, “Modelling and Implementation of Fuzzy Systems based on VHDL”,
International Journal of Approximate Reasoning, vol. 41, issue 2,
[image:6.595.122.213.435.622.2]