Abstract—This paper proposes a novel junction detection algorithm which combines image intensity variation and edge contour information. Firstly, use the Canny edge contour detector to extract edge map. Secondly, imaginary parts of multi-scale Gabor filters (IPGFs) are used to smooth the input image, and then acquire the normalized information entropies at various scales. Finally, the multiplication of different normalized information entropies is served as a new interest point measure, which is used to detect interest point. The proposed method has two advantages: on one hand, the proposed method not only utilizes contour shape and local maximum curvature to extract junctions but also considers the gray variation information of edge pixels and their surrounding pixels; on the other hand, the multi-scale product is served as junction measure which can inhabit the non-junction. Compared with four other state-of-art methods, the proposed method showed excellent performance in terms of the average repeatability and the localization accuracy.
Index Terms—Junction detection, imaginary parts of the Gabor filters (IPGFs), normalized, information entropy, multi-scale product
I. INTRODUCTION
unction, which often has unique structures, is a local invariant feature in an image. The detection and extraction of junction is very important in image analysis and computer vision, such as image matching [1], object recognition [2], feature tracking [3], among other applications. In true scenes, due to the perspectives and the environment change, the image may be turned by illumination, rotation and scale or be influenced by noise and other factors. Junction is independent to these variations, so we can extract image feature by detecting interest point. Generally, junctions are defined as the easy identified points in image [4], which also include corners and junctions.
Multiple junction detectors have been proposed in the literature [4-27], which can be broadly classified into three classes [4, 5]: intensity-based methods [6-13], template-based methods [4], [6] and contour-based methods
Manuscript received Jan. 10, 2018; revised Feb. 8, 2018. This work was supported by the Control Science and Engineering Group Construction of Xi’an Polytechnic University (No.107090811), the Shaanxi Provincial Science and Technology Department of Natural Science Foundation research project funded project (2016JZ026), project of tackle key problems in Industrial technology of Shaanxi (2016GY-047).
Authors are with the School of electronic information, Xi’an Polytechnic University, Xi’an, P. R. China (phone: 86-13572148712; e-mail: [email protected], [email protected], [email protected], [email protected], [email protected]).
[14-27]. The intensity method which considers the corner’s self-dissimilar property [6, 7] detects junctions in an image directly. The template-based method searches junctions by matching a small chip of an image to a previously given model. The contour-based method first uses some edge detectors to extract the edge contour and then analyzes the contour shape to find junctions. Furthermore, these detectors can also be divided into two groups [8]: single-scale detectors and multi-scale detectors. If the input image has the same scale feature, the single-scale detector has good detection property [9]. However, most input images contain multi-scale features that single-scale method may lose important junctions. To improve the defect of single-scale method, the multi-scale junction detector has been proposed. In this paper, we will combine the edge contour with intensity variation information to detect junctions.
The intensity methods detect junctions by using the first order or second order derivative of image. In the early stage, the second order derivatives are embedding in junction detectors, which proved to be sensitive to noise later. Inspired by Moravec’s idea [10], Harris and Stephens proposed the prosperous Harris algorithm [6], which then is the foundation stone of follow studies. But Harris corner detector can only detect L-type corners, other complex corners cannot be detected well [11]. From then on, the steerable filters such as Log-Gabor wavelet [12] and the shearlet [13], which introduced multi-scale and multi-directional intensity variation information, were used to extract the fine local intensity variations for edge and junction detection.
The contour methods which proposed by Mokhtarian and Mackworth [14] are based upon curvature scale space (CSS) theory to detect junctions. Rattarangsi and Chin [15] first adopted CSS [14] principle to detect junction in entire scale space. Mokhtarian and Suomda [16] proposed its improved edition, which detects interest point in large scale and tracks curvature from large to small scale to improve positioning performance. The CCS detector works well in detecting junctions. However, The CSS detector is sensitive to noise or local variation. Meanwhile, it is a difficult task to choose a suitable Gaussian scale to smooth edge contours. To solve the aforementioned problems, Gao [18] proposed multi-scale method with local nature scale. Zhang [17] utilized the multi-scale curvature product to find junctions. Awrangjeb [19] proposed the discrete curvature estimate technique [20] based upon chord-to-point distance accumulation (CPDA). Literature [21] utilized polygon to approximate the contour shape, and then extract the polygon peak by curvature maximum through scale space. Meanwhile, gradient correlation matrices of planar curves [22], adaptive threshold method [23] and multi-chord curvature polynomial [24] are also proposed to extract junctions. Although these methods
Junction Detection using Multi-scale Gabor
Filters
YunHong Li, Qiuming Zhang, Xiaoji Zhou, Weichuan Zhang, Jie Ren
have achieved better detection performance than the aforementioned detectors, there is still large space for improvement. The mentioned above contour-based method neglects the influence of gray variation information but only uses the contour shape to examine junctions, which leads to the detection performance depends on edge detection at large extent.
In literature [25], Gabor filter was proved to be the model of human visual system and it is further demonstrated [26][27]that Gabor filter is optimal to extract local feature such as edge and corner. Zhang [28] utilized imaginary part of Gabor filter (IPGF) to extract gray variation information and the normalized amplitude response at each direction is used to extract contour’s junctions. Unlike the traditional CSS method, IPGF detector utilizes the contour shape information and gray variation information, which improves the detection reliability.
In this paper, we propose a new junction detection algorithm to overcome the aforementioned problems. The literature [28] pointed out that whether a pixel is the junction depends on the pixel and its neighbor pixels’ gray value. Different from the literature [28], we use multi-scale IPGFs to extract gray variation information at multi-directions. Based upon the gray variation direction information at different scales, we compute the normalized information entropy of each contour pixel, and then the product of the normalized information entropies at multi-scale is embedded in contour framework to extract junctions. There is one main contribution in this paper: compared with the traditional contour-based method, the new algorithm uses not only contour shape information but also the pixel and its neighbor’s gray change information. Hence, the new detector reduces the false junction detection rate, which is impossible for contour method. We also examine the effect of scale factors on the experimental results. It shows that scale multiplication makes the detector more robust to noise. Compared with four state-of-art methods, include Harris [6], Harris-Laplace[8], CSS [16] and He & Yung [23], our approach is more effective with respect to corner detection, localization, and noise-robustness.
II. MULTI-SCALE GABOR FILTERS AND JUNCTION MEASURE In practical application, images are often the discrete two-dimensional signal, so the sequential Gabor filter should be discredited. In this section, we discuss the property of IPGF for interest point extraction.
A. Imaginary parts of Gabor filters
The discrete IPGF is expressed as
2 2 2
2 2
2 2
-1 max
( , ; , ) exp sin(2 ),
cos sin ,
sin cos ,
2 , 0,1,..., 1,
2 , 1, 2...
s s s
s k s
k k
k k
k
s s
f f f
m n f u v f u
u m n
v m n
k K k K
f f s
(1) where
,
are spatial width of filter along x-axis and y-axis, both of them determine the filter’s shape,f
sis centralfrequency under the scale
s
,f
max is maximum central frequency,K
is the number of direction of filter,
is the rotation angle. Fig. 1 shows an example of imaginary part of Gabor filters at eight directions.Fig.1 IPGF with fmax0.25,s0,0.75,1,kk8,k0,1, 2,3...
Using the filters with large scale to smooth image can suppress noise well but may lose the detail of gray variation information. On the contrary, the filters with small scale can extract detail of gray variation information well but sensitive to noise. Hence, use the different scales to extract gray variation information can enhance the detection property. For a discrete image
I m n
,
, under the scales
, the amplitude response
can be obtained by convolution:( , ;
, )
( , )
( , ;
,
)
(
,
) (
,
;
,
).
x y
s s k
x y x y s k
m n
m n f k
I m n
m n f
I m
m n
n
m n
f
(2)The magnitude response of the IPGF along the direction k
reflects the gray variation information of the input image. So, a bank of IPGFs along the different directions can give back the intensity variation regularities among edge contour pixels or interest points absolutely. For a step edge, L-type corner, Y-junction and X-junction, the magnitude response of the IPGF is shown in Fig. 2.Fig.2 Magnitude responses of the IPGF of a step edge, L-type corner, Y-junction, X-junction
B. Junction measure of contour pixel
The traditional contour-based method usually extracts the junction by searching for the local curvature maximum in edge contour, which existing the noise-sensitiveness and contour dependency problems. Under the different scales, our method serves the gradient direction information entropy of contour pixel and its neighbor as the junction measure. The gradient direction corresponding to the gray variation maximum can be obtained by amplitude response of the IPGF:
1,2,...
arg max{ ( , ;
s, ) }.
k K
m n f k
(3)contains
K
pixels, assuming that in this neighbor there were kM
pixels along the gradient direction
, so the corresponded probability of gradient direction is:,
1, 2,..., .
k
P
M
K k
K
(4)The information entropy of pixel q is defined as:
2 1
log
,
0.
K
k
H
P
P P
(5)In order to guarantee the sum of probabilities in one neighbor is equal to one, the window size of neighborhood should match with the filter’s orientations. For example, if we choose 5 5 size of window, the number of filter’s orientations should be 25. Under the scale
s
, normalizing the information entropies of all edge contours’ pixels, then the'
i th pixel’s normalized information entropy is:
1 2
max
,
,...,
,
i
sq si s s sn
H
H
H
H
H
(6)where
H
siandH
sndenote the gradient direction information entropy of the i th' and n th' pixels, we use scale-product as the new interest point measure to search junction:1,2...
j
j i
s
s q
j
H
(7)where
s
j denotes thej th
'
scale,j i
s q
H
denotes the normalized information entropy of contour pixelq
under the'
[image:3.595.48.271.387.746.2]j th
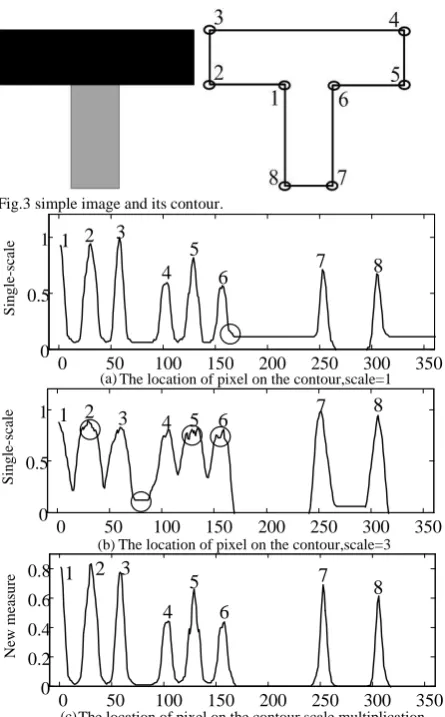
scale.Fig.3 simple image and its contour.
0 50 100 150 200 250 300 350
0 0.5 1
(a) The location of pixel on the contour,scale=1
S
in
g
le
-s
ca
le 1 2 3 4
5
6 7 8
0 50 100 150 200 250 300 350
0 0.5 1
The location of pixel on the contour,scale=3
S
in
g
le
-s
ca
le 1 2 3 4 5 6 7 8
(b)
0 50 100 150 200 250 300 350
0 0.2 0.4 0.6 0.8
The location of pixel on the contour,scale multiplication
N
ew
m
ea
su
re 1 2 3 4
5 6
7 8
(c)
Fig. 4 (a) single-scale response, s=1, (b) single-scale response, s=3, (c) scale-multiplication.
In order to prove multi-scale measure has better
performance than single-scale, in Fig.3, we use a simple image and its contour to examine the property of junction measure. Fig.4 (a), (b) and (c) show the junction measure under single-scale and scale multiplication. We can see that single-scale responses mix with some other points (marked by “o”) such as noise or edge pixels; this method could not distinguish junction well. On the contrary, scale multiplication can suppress non-junction well and its response is almost approach to zero. In addition, the multiplication makes the algorithm more robust that can distinguish junctions from others.
C. Outline of the proposed method
Based upon the content above, we give the algorithm’s steps:
--First, extract edge map from the input image by Canny[29] edge detector, and fill gaps to form a complete edge contours.
--Second, smooth the input image by multi-scale IPGF to obtain the magnitude response as well as gray variation information.
--Third, under the different scales, compute the edge contour pixels' normalized information entropies in 7 7
neighborhoods by Equation (6).
--Fourth, Multiply the normalized information entropies at different scales and then apply the non-maximum suppression to the multiplication. We use a local window with the size of 13 13 to smooth through all the pixels of the edge contour. If the central pixel is the local maximum, then the pixel is kept; conversely, it would be set to zero.
--Fifth,to remove weak and false junctions, compare the candidate junctions acquired in step 4 with a threshold.
III. PERFORMANCE EVALUATION AND EXPERIMENTAL RESULT
In this section, we focus on the performance evaluation and experiment results. We compare the proposed interest detector with four state-of-art methods (Harris [6], Harris-Laplace [8], CSS [16] and He&Yung [23]) by means of the average repeatability and localization error criterion [19], [30].
A. The database
[image:3.595.305.549.596.754.2]As is shown in Fig.5, eighteen images acquired from the database [31] and other magazines are used to evaluate the parameters and properties of four detectors.
Fig. 5 Twenty-eight images for computation of the average repeatability and localization error.
uniform scaling transform, non-uniform scaling transform, shear transform, lossy JPEG compression and Gaussian noise.
B. The database
The evaluation criterion [19], [30] adopts average repeatability and localization error to analyze the performance of the different detectors.
The average repeatability
R
avg reflects the repeatable degree between test image and origin image. It is defined as:0.5
(1
1
)
avg r o t
R
N
N
N
(8)where No denotes the number of detected interest points from original images, Nt denotes the number of detected interest points from test images and Nrdenotes the number of repeated interest points. Imagine that an interest point was detected in origin image and if its corresponding point in geometric transformation were within four pixels, Nrshould be added to one, and so on.
The localization error
L
e is defined as the average distance on all the matched pairs. Let( ,
P P
k k),
k
1, 2,
,
N
r be the matched pairs in original and test images. Then, the localization error is computed by:
2
1 2
1
Nre k k k
r
L
P
P
N
(9)C. Experimental results
In this section, we first concentrate on the experimental parameter setting for the proposed detector. Then, we give the relative results between the proposed and four other detectors: Harris [6], Harris-Laplace [8], CSS [16] and He & Yung [23]. The parameters setting are:
f
0
0.19,
0.55,
2
0.55 ,
K
49,
the multi-scale of Gabor filters is [1, 3], the threshold isThr
0.7,
the size of non-maxima suppression window is 13 13 .The whole comparative results among the proposed and four other detectors (Harris [6], Harris-Laplace [8], CSS [16] and He & Yung [23]) are put forward in this section. Here, all the parameters of the detectors use their default values.
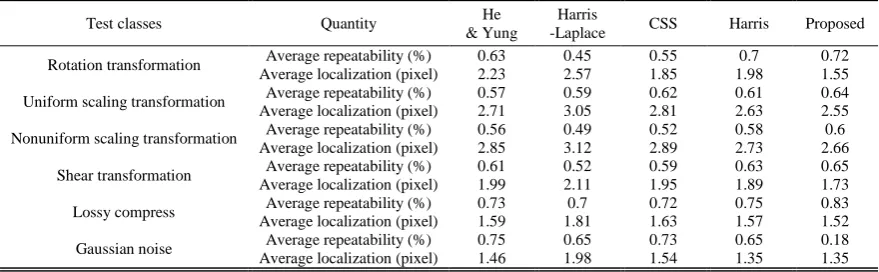
Table I shows the average repeatability and localization error under the different geometric transformations, lossy image compression and Gaussian noise. In rotation
transformations, the proposed method has high average localization; the Harris-Laplace has the worst performance in rotation transformation. Meanwhile, in average repeatability aspect, the proposed method is outperform other methods in Gaussian noise. In localization error aspect, the proposed method performs worse than the Harris-Laplace method, but achieves better performance than other four methods.
The statistics performance index of the five detectors are as follows: the average of the Harris is 4, Harris-Laplace is 2.333, He&Yung is 3.333, CSS is 3.417 and the proposed is 1.833, respectively. It can be seen that the proposed method shows the best performance, Harris-Laplace is second, He & Yung is third and Harris is the poorest.
IV. CONCLUSION
We have proposed a new junction detector based on the multi-scale IPGFs. It combines the edge contour pixels’ shape information and their surrounding pixels’ gray variation, which improves the property of the junction detector. Meanwhile, the scale-multiplication also suppresses the non-interest point. Compared with four other detectors, the proposed detector performs well in geometric transformations and it has precise localization of the repeated interest points. Future work may consider the more accurate localization performance and noise robustness.
ACKNOWLEDGMENT
This work was supported by the Control Science and Engineering Group Construction of Xi’an Polytechnic University (No.107090811), the Shaanxi Provincial Science and Technology Department of Natural Science Foundation research project funded project (2016JZ026), project of tackle key problems in Industrial technology of Shaanxi (2016GY-047).
REFERENCES
[1] Y. Pang, et al. "Fully affine invariant SURF for image matching."
Neurocomputing. 85.1(2012):6-10.
[2] M Kafai, L. An, and B. Bhanu. Reference Face Graph for Face Recognition. IEEE Press, 2014.
[3] P. A. Tresadern, M. C. Ionita, and T. F. Cootes. "Real-Time Facial Feature Tracking on a Mobile Device." International Journal of Computer Vision. 96.3(2012):280-289.
[4] M Awrangjeb, G. Lu, and C. S. Fraser. "Performance Comparisons of Contour-Based Corner Detectors." IEEE Transactions on Image Processing A Publication of the IEEE Signal Processing Society. 21.9(2012):4167.
TABLEI
AVERAGE REPEATABILITY AND LOCALIZATION ERROR RESULTS UNDER DIFFERENT TRANSFORMATIONS.
Test classes Quantity He
& Yung
Harris
-Laplace CSS Harris Proposed
Rotation transformation Average repeatability (%) Average localization (pixel)
0.63 0.45 0.55 0.7 0.72
2.23 2.57 1.85 1.98 1.55
Uniform scaling transformation Average repeatability (%) Average localization (pixel)
0.57 0.59 0.62 0.61 0.64
2.71 3.05 2.81 2.63 2.55
Nonuniform scaling transformation Average repeatability (%) Average localization (pixel)
0.56 0.49 0.52 0.58 0.6
2.85 3.12 2.89 2.73 2.66
Shear transformation Average repeatability (%) Average localization (pixel)
0.61 0.52 0.59 0.63 0.65
1.99 2.11 1.95 1.89 1.73
Lossy compress Average localization (pixel) Average repeatability (%) 0.73 1.59 1.81 0.7 0.72 1.63 0.75 1.57 0.83 1.52
Gaussian noise Average repeatability (%) Average localization (pixel)
0.75 0.65 0.73 0.65 0.18
[image:4.595.63.503.642.778.2][5] C Harris. "A combined corner and edge detector." Proc Alvey Vision Conf. 1988.3(1988):147-151.
[6] S C Pei, and J. J. Ding. "Improved Harris' Algorithm for Corner and Edge Detections." IEEE International Conference on Image Processing. IEEE, 2007:III-57 - III - 60.
[7] K Mikolajczyk, and C. Schmid. Scale & Affine Invariant Interest Point Detectors. Kluwer Academic Publishers, 2004.
[8] J S Lee, Y. N. Sun, and C. H. Chen. Multiscale corner detection by using wavelet transform. IEEE Press, 1995.
[9] H P. Moravec. "Toward automatic visual obstacle avoidance."
Proc.int.joint Conf.arti Intelligence (1997).
[10] A J. Noble. "Finding corners." Image & Vision Computing.
6.2(1988):121-128.
[11] X Gao, F. Sattar, and R. Venkateswarlu. "Multiscale Corner Detection of Gray Level Images Based on Log-Gabor Wavelet Transform." IEEE Transactions on Circuits & Systems for Video Technology. 17.7(2007):868-875.
[12] S Yi, et al. "A shearlet approach to edge analysis and detection. ". IEEE Transactions on Image Processing A Publication of the IEEE Signal Processing Society. 18.5(2009):929-941.
[13] A Goshtasby, F. Mokhtarian, and A. Mackworth. "Scale-based description and recognition of planar curves and two-dimensional shapes. ". Pattern Analysis & Machine Intelligence IEEE Transactions on. 8.1(2009):34-43.
[14] A Rattarangsi and R. T. Chin. "Scale-based detection of corners of planar curves.". Pattern Analysis & Machine Intelligence IEEE Transactions on. 14.4(1992):430-449.
[15] F Mokhtarian and R. Suomela. "Robust Image Corner Detection Through Curvature Scale Space." Pattern Analysis & Machine Intelligence IEEE Transactions on. 20.12(1998):1376-1381. [16] X Zhang, et al. "Multi-scale curvature product for robust image corner
detection in curvature scale space." Pattern Recognition Letters.
28.5(2007):545-554.
[17] X Gao, et al. "Multiscale contour corner detection based on local natural scale and wavelet transform." Image & Vision Computing.
25.6(2007):890-898.
[18] M Awrangjeb and G. Lu. "Robust Image Corner Detection Based on the Chord-to-Point Distance Accumulation Technique." IEEE Transactions on Multimedia. 10.6(2008):1059-1072.
[19] J H Han and T. Poston. "Chord-to-point distance accumulation and planar curvature: a new approach to discrete curvature." Pattern Recognition Letters. 22.10(2001):1133-1144.
[20] M A. Pinheiro and M. Ghanbari. "Piecewise approximation of contours through scale-space selection of dominant points. " IEEE Transactions on Image Processing A Publication of the IEEE Signal Processing Society. 19.6(2010):1442-50.
[21] X Zhang, et al. "Corner detection based on gradient correlation matrices of planar curves." Pattern Recognition. 43.4(2010):1207-1223.
[22] X He, and N. H. C. Yung. "Corner detector based on global and local curvature properties." Optical Engineering. 47.47(2008):057008. [23] G. U. Guoqing, R. Bai, and D. U. Bin. "High precision corner detection
based on curvature multi-scale." Optical Technique. 36.6(2010):918-922.
[24] S B. Manjunath and W. Y. Ma. "Texture features for browsing and retrieval of image data." IEEE Trans Pami. 18.8(1996):837-842. [25] Y Tian, T. Kanade, and J. F. Cohn. "Eye-State Action Unit Detection
by Gabor Wavelets." Lecture Notes in Computer Science.
1948(2000):143-150.
[26] L Shen and L. Bai. Information theory for Gabor feature selection for face recognition. Hindawi Publishing Corp. 2006.
[27] W Zhang, et al. "Corner detection using Gabor filters." Image Processing Iet. 8.11(2014):639-646.
[28] J. Canny. A Computational Approach to Edge Detection. IEEE Computer Society, 1986.
[29] C Schmid, R. Mohr, and C. Bauckhage. "Evaluation of Interest Point Detectors." International Journal of Computer Vision.
37.2(2000):151-172.
[30] The Image Database [Online]. Available: