_____________________________________________________________________________________________________ *Corresponding author: E-mail: [email protected];
Production of Microbial Exopolysaccharide by
Cost-effective Medium Opimization Method
I. G. Nwosu
1*, G. O. Abu
1and K. O. Agwa
11
Department of Microbiology, World Bank Africa Centre of Excellence for Oilfield Chemical Research, University of Port Harcourt, Rivers State, Nigeria.
Authors’ contributions
This work was carried out in collaboration among all authors. Author GOA designed the study. Author IGN performed the experiment, statistic analysis, wrote the protocol and wrote the first draft of the manuscript. Authors GOA and OKA supervised the study. All authors read and approved the final manuscript.
Article Information
DOI: 10.9734/JAMB/2019/v19i230189 Editor(s): (1) Dr. Marcin Lukaszewicz, Department of Biotransformation, Faculty of Biotechnology, University of Wroclaw, Wroclaw, Poland and Division of Chemistry and Technology Fuels, Wroclaw University of Technology, Wroclaw, Poland. (2) Dr. Zahid Anwar, Department of Biochemistry, University of Gujrat, Pakistan. (3) Dr. Eliton da Silva Vasconcelos, Department of Physiological Sciences, Federal University of São Carlos – UFSCar, Rod. Washington Luiz, São Carlos, SP, Brazil. (4) Dr. Niranjalie Perera, Professor, Department of Food Science and Technology, Faculty of Livestock, Fisheries & Nutrition, Wayamba University of Sri Lanka, Sri Lanka. Reviewers: (1) Slim Smaoui, Centre of Biotechnology of Sfax, Tunisia. (2) Maria Bintang, IPB University (Bogor Agricultural University), Indonesia. Complete Peer review History:http://www.sdiarticle4.com/review-history/52290
Received 15 September 2019 Accepted 19 November 2019 Published 30 November 2019
ABSTRACT
Microbial exopolysaccharide (EPS) emerged as a fast and high yielding sustainable polymeric substance which can be used as an alternative to synthetic polymer in industry. In this study, the influence of various nutritional and environmental factors of fermentation medium on bacterial growth and EPS production was evaluated by one factor at a time optimization. Efficient production medium was chosen from four different basal media and its carbon and nitrogen substrates were varied among organic and inorganic sources. Feasibility of bacterial utilization of some agricultural wastes as carbon and nitrogen sources to synthesize exopolysaccharide was compared. Carbon source of the fermentation medium was replaced with hydrolysates of sugarcane baggasse (SCB), sweet potato peels (SPP) or ripe plantain peels (RPP) at various concentrations while the nitrogen substrates was replaced with extracts of poultry droppings (PP), groundnut pod (GP) or beans bran (BB). Response results observed from single factor optimization were explored as center points to
design a model for Response Surface Methodology study. Cell growth was determined from the biomass population of the fermentation broth after 5 days of incubation in a rotary shaker at 120 rpm at 30ºC. EPS was precipitated with pre-chilled ethanol (at 4ºC) from cell-free broth and overnight incubation at 4ºC. Total carbohydrate content was estimated by phenol-sulphuric acid method. Result obtained showed that 2% concentration Hydrolysate of SPP containing medium gave maximum yield of 2.26 g EPS/l of the medium as compared to sucrose containing medium with yield of 1.25 g EPS/l of the medium while highest production yield of 9.46 gEPS/l of the medium was obtained from 10 g/l BB extract medium as compared to yeast extract medium (5.41 gEPS/l). Results indicated that agricultural wastes such as sweet potato peel hydrolysate and bean bran extract could be developed as inexpensive alternative route to synthesize EPS from bacteria than inorganic substrates.
Keywords: Bean bran; bacteria; exopolysaccharide; RSM; sweet potato peel.
1. INTRODUCTION
In complex biodiversity of marine habitat, most microorganisms synthesize biopolymers as secondary metabolites for adherence and thriving which enable their adaptation and survival in adverse environmental conditions. The biological roles of these biopolymers include cell defense, cell interactions and adherence to
surfaces, energy reserves and virulence
expression [1]. Such polymeric substances comprise of polysaccharides, lipids, protein, nucleic acid and humic acid substances [2]. Microbial polysaccharide is the most important biopolymer secreted either by bacteria, fungi or yeast as natural, non-toxic, biodegradable and renewable sugar monomers [3]. However, a
variety of microorganisms identified as
exopolysaccharide producing bacteria was
isolated from extreme environments.
Extremophiles adapt to and tolerate harsh
environmental conditions by synthesizing
extracellular polysaccharides to withstand the external stress. Such microorganisms include
Alcaligenes, Streptococcus, Halomonas,
Pseudomonas and Shewanella [4].
Considerable emerging interest of researchers in exploring new microbial exopolysaccharides in the past few decades is owing to the unique diverse and modifiable functionalities attributed
by their physiochemical and rheological
properties. They serve as additives for
thickening, stabilizing, gelling and emulsifying, bioflocculators and viscosifiers in various fields and industrial sectors such as drilling, medicines, pharmaceutical, cosmetics, food and agriculture [5,6,7].
Although, higher plants polysaccharides are
extracted from their biomass, microbial
polysaccharides are very much preferable as
they are recovered from their fermentation broth cultures. Besides, microbial polysaccharides are more advantageous and economical at industrial scale for the production of bioactive materials due to their fast and higher production yield under well-controlled fermentation process within limited time, uninterrupted geographical and seasonal variations and non-interference with land for agricultural purposes. Moreover, various organic sources can be utilized for microbial production unlike plants that solely depend on solar energy [8].
Nevertheless, the global biopolymer market is
highly dominated by plants polymers
superseding smaller fraction of microbial
polysaccharides such as Xanthan and Gellan with commercialized industrial values because of cost intensive steps in production process and other downstream process [9,10]. The rising interests to overcome the economic hindrance of microbial EPS in industrial purposes call elucidation of several approaches. Approaches adopted to minimize production cost of EPS biosynthesis in industrial scale involve using cheaper fermentation feedstock, optimizing production conditions to improve yield or genetic manipulation to develop strains and optimizing downstream processing [11,12].
Numerous studies on EPS production have been reported, however, only a few were directed toward production using low cost medium [13]. Fermentation medium represent 30% cost of
production of bioactive molecules from
sources available in the medium under certain
critical environmental factors to release
polysaccharide into the surroundings [13].
Almost 70% of the energy require for
biosynthesis of exopolysaccharide are from carbon source [2]. It is crucial to develop environmentally friendly and cost effective fermentation medium in order to increase production yield at reasonable cost by designing and employing cheaper alternative fermentation substrates such as agro-industrial by-products and other waste materials [6].
This study aimed to optimize EPS production of
bacterial strain by Response Surface
Methodology using different agricultural wastes to develop an economic culture medium, the effect of environmental factors on its production and characterization of produced EPS.
2. MATERIALS AND METHODS
2.1 Isolation of Bacteria
Water sample was aseptically collected from Bonny Island using a sterile container and immediately transported to the laboratory. It was
serially diluted from 10-1 to 10-7 in normal saline
and 0.1 ml of each dilution was inoculated in nutrient agar plate supplemented with 4% sucrose in duplicate by spread plate technique [14]. Bacteria producing EPS characterized by thick slime or mucoid colonies were selected and subcultured.
2.2 Screening and Selection by EPS Quantification
Pure cultures of selected isolates were
inoculated in a freshly prepared nutrient broth supplemented with 4% sucrose and incubated for 24 hrs [14]. The cell-free broths after centrifuging at 10,000 rpm for 10 minutes were mixed with two volumes of cold ethanol and stored at 4ºC overnight. The precipitates were collected centrifuging at 10,000 rpm for 20 minutes, dried, weighed and dissolved in distilled water [15]. They were quantified by phenol sulphuric acid method using glucose as standard [16].
2.3 Morphology and Biochemical Identification
Most potent EPS producing bacterial isolate
selected was identified by morphological
characterization, examined by Grams staining reaction and further confirm by biochemical test
based on key to Bergey’s Manual of
Determinative Bacteriology.
2.4 Preparation of Extracts of Organic Carbon Sources
Ripe plantain peel (RPP), sugarcane baggasse (SCB) and sweet potato peel (SPP) were diluted individually with distilled water containing 1% concentrated sulfuric acid. The mixtures were autoclaved at 121ºC for 40 minutes, cooled and filtered. The pretreated filtrates were separately used as source of carbon.
2.5 Preparation of Extracts of Organic Nitrogen Sources
Bean bran (BB), groundnut pod (GP) and poultry droppings (PD) were collected, dried and
processed. They were diluted in 0.5M K2SO4
solutions to extract the nitrate [17]. The solutions were autoclaved at 121ºC for 40 minutes, cooled and filtered for clear extracts. The extracts were used as economic media for nitrogen source.
2.6 Optimization by Classical Method
One-factor-at-a-time was used to investigate the EPS production by the selected strain.
2.7 Effect of Different Synthetic Media on EPS Production
Influence of different media composition was investigated on growth and production of EPS by the bacterial strain. The media include A (g/l): peptone 10, yeast extract 3, sodium chloride 5 and sucrose 20 at pH 6.5 [18]; B (g/l): yeast
extract 1.0, MgSO4 0.5,KH2PO4 1.0 and sucrose
30 at pH 7.0 [19]; C (g/l): KH2PO4 0.2, K2HPO4
1.5, MgSO4.7H2O 0.2, CaSO4.2H2O 0.1, FeCl3
0.002, yeast extract 0.5 and sucrose 20 [7]; D (g/l): peptone 10, glucose 15, NaCl 75 and
MgSO4 1.5 at pH 10 [5] and E: nutrient broth
supplemented with sucrose 20 g/l [14].
Aliquot of 24 hrs old actively growing culture of the isolate was used at constant innoculum size for each medium. The best medium that produced the highest growth and EPS yield was selected as the production media for further study.
2.8 Effect of Different Carbon Sources
carbon substrates (RPP, SPP and SCB extracts) were altered in the medium while other factors remaining constant. 100 ml of each medium in 250 ml conical flask was inoculated with 5% of 24 hrs old active culture of the isolate and incubated for 96 hrs at 200 rpm in orbital shaker incubator at 30ºC.
2.9 Effect of Different Nitrogen Sources
Varying synthetic nitrogen sources (yeast extracts, ammonium sulfate and urea) and organic nitrogen sources (BB, GP and PD extracts) were altered in the medium while other factors remained constant. 100 ml of each medium was inoculated with actively growing culture at constant inoculum size and incubated at 30ºC in orbital shaker incubator at 200 rpm for 96 hrs.
2.10 Effect of Different pH
EPS production was carried out in the medium at varying initial pH range from 5, 6, 7 to 8 to monitor the influence on bacterial growth and EPS yield. 100 ml of the medium in 250 ml conical flask were adjusted with 1M HCl and 1M NaOH at different pH range before sterilization. About 5% of 24 hrs old active culture of the isolate and incubated for 96 hrs at 200 rpm in orbital shaker incubator at 30ºC.
2.11 Effect of Different Incubation Period
Varying period of incubation (3, 6 and 9 days) were investigated for their effect on growth and production of EPS when cultured at constant inoculum size.
2.12 Optimization of Culture Medium by Response Surface Methodology
The tested variables were selected from one-factor-time and employed to determine the optimum conditions and concentration for production of EPS by bacterial strain through RSM. The four independent variables included in the model were organic carbon source SPPE (10-50 g/l), organic nitrogen source BBE (3.75-8.75 g/l), pH 6.5) and incubation time (4.5-10.5 days).
2.13 Characterization of EPS
The crude EPS was characterized by Fourier Transform Infrared Spectrometer.
2.14 FTIR
The functional groups of the EPS from strain code WAS 11 was analyzed with FT IR spectroscopy [20]. About 2 mg of the crude EPS was mixed with 200 mg of dry potassium bromide pellets and compressed into mould in a disc. The FT IR spectrum was recorded in the
frequency range of 4000-400 cm-1 by using FTIR
system.
3. RESULTS
Bacterial isolates were chosen based on their ability to form mucoid on nutrient agar plates. Mucoid-forming isolate with the highest potential of producing exopolysaccharide was selected quantitatively by EPS dry weight and phenol sulfuric acid test after cold ethanol precipitation. Bacterial strain WAS11 which has the highest potential of producing EPS was selected, identified as Gram-negative, catalase and oxidase positive, hydrogen sulphide utilizing rod and used for further study in this research.
WAS11 was identified as Shewanella chilikensis
WAS11 (Accession number: MN511702).
Result showed that all the shortlisted culture media favored the growth and production of EPS by the bacterial strain inoculated. Optimum cell growth of 1.62 (OD) with the highest EPS yield of 1.29 g/l was obtained from medium C. The least EPS yield of 0.78 g/l along with highest cell growth of 1.84(OD) was observed in medium B as shown in Fig. 1.
Fig. 1. Effect of different media on cell growth and EPS production
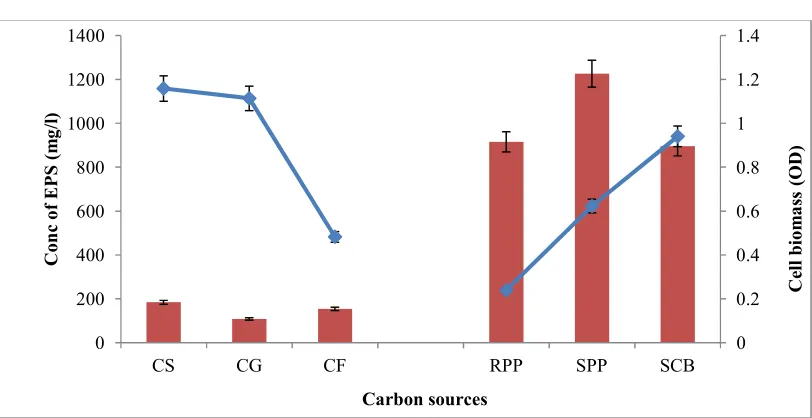
Fig. 2. Effect of organic and inorganic carbon substrates on EPS and cell biomass
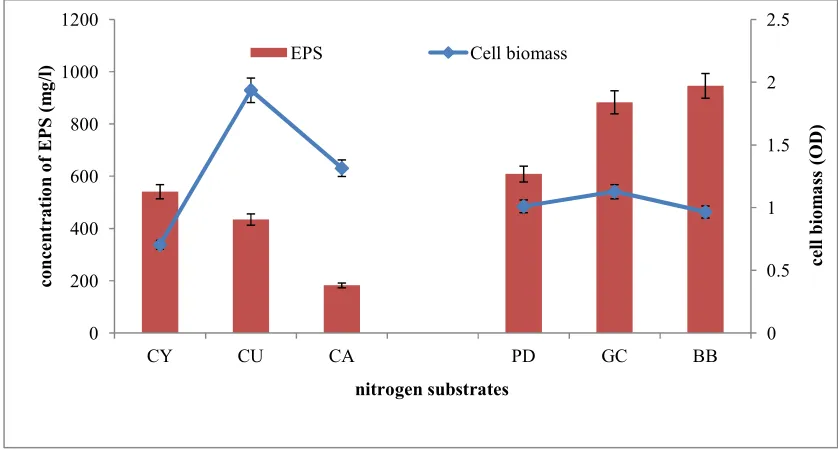
Out of the three synthetic nitrogen sources used for this optimization study, 0.5% yeast extract containing medium produced maximum EPS yield of 0.54 g/l and optimum growth of 0.71 (OD) after 24 hrs cultivation. Under the same condition, maximum cell growth of the strain (1.94(OD)) was noted in urea containing medium as shown in Fig. 3. The synthetic nitrogen source of the medium composition was replaced by
three different organic nitrogen extracts
individually (PD, GC and BB). Result obtained indicates that bacterial isolate was able to grow in the three tested nitrogen substrate media and BB containing medium produced the highest yield of 0.95 g/l at optimum cell growth of 0.97(OD) as shown in Fig. 3.
Result of the influence of initial pH on bacterial growth and production of EPS illustrated that
there was correlation between bacterial growth and exopolysaccharide production as the initial pH of the culture media was varied from range of 5 to 8. The maximum yield of 1.98 g/l EPS and uppermost biomass yield of 2.02(OD) was from lowest initial pH 5 while smallest amount yield of 1.15 g/l EPS with least cell biomass of 0.83(OD) was observed from highest initial pH 8 as shown in Fig. 4.
As the time of incubation increased, biomass yield of the bacterial isolate multiplied indicating exponential growth of bacteria. But maximum EPS yield of 1.16 g/l was observed on day 6 while peak of the cell density, 1.06(OD) was observed on day 9 as shown in Fig. 5.
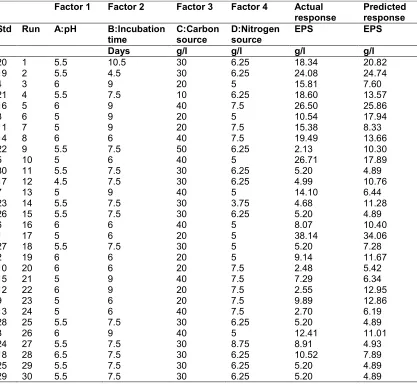
RSM result showed that trial 17 produced the highest EPS yield of 38.14 g/l with initial
0 0.5 1 1.5 2 2.5
0 200 400 600 800 1000 1200 1400 1600
MA MB MC MD ME
c
e
ll
b
io
m
a
ss
(
O
D
)
c
o
n
c
o
f
E
P
S
(
m
g
/l
)
MEDIA
EPS Cell biomass
0 0.2 0.4 0.6 0.8 1 1.2 1.4
0 200 400 600 800 1000 1200 1400
CS CG CF RPP SPP SCB
C
el
l
b
io
m
a
ss
(
O
D
)
C
o
n
c
o
f
E
P
S
(
m
g
/l
)
pH of 5 for the culture medium containing SPP 20 g/l as carbon source and BB 5 g/l as limiting nitrogen source incubated for the
period of 6 days as shown in Table 1 and Fig. 6 showing the interaction among initial pH, incubation time, carbon and nitrogen sources.
4. DISCUSSION
According to several researchers, the main criteria for selection of the most potential bacteria
exopolysaccharide producers were based on highest EPS yield of the isolates [21]. Liu and others reported isolate with the maximum EPS yield capability as the most potent producer bacteria (2010). Numerous authors suggested that media composition is essential parameters in determining EPS biosynthesis of bacteria strain [22,23]. The results showed that the most potent isolate code WAS11 used for this study was able to grow and produce EPS in all the selected media but the maximum EPS yield occurred in media C.
Fig. 3. Effect of synthetic and organic nitrogen substrates
Fig. 4. Effect of different initial pH
0 0.5 1 1.5 2 2.5
0 200 400 600 800 1000 1200
CY CU CA PD GC BB
c
e
ll
b
io
m
a
ss
(
O
D
)
c
o
n
ce
n
tr
a
ti
o
n
o
f
E
P
S
(
m
g
/l
)
nitrogen substrates
EPS Cell biomass
0 0.5 1 1.5 2 2.5
0 500 1000 1500 2000 2500
pH5 pH6 pH7 pH8
c
el
l
b
io
m
a
ss
(O
D
)
c
o
n
c
o
f
E
P
S
(m
g
/l
)
Fig. 5. Effects of incubation days
Table 1. Response surface experimental design for culture conditions influencing EPS production
Factor 1 Factor 2 Factor 3 Factor 4 Actual response
Predicted response Std Run A:pH B:Incubation
time
C:Carbon source
D:Nitrogen source
EPS EPS
Days g/l g/l g/l g/l
20 1 5.5 10.5 30 6.25 18.34 20.82
19 2 5.5 4.5 30 6.25 24.08 24.74
4 3 6 9 20 5 15.81 7.60
21 4 5.5 7.5 10 6.25 18.60 13.57
16 5 6 9 40 7.5 26.50 25.86
3 6 5 9 20 5 10.54 17.94
11 7 5 9 20 7.5 15.38 8.33
14 8 6 6 40 7.5 19.49 13.66
22 9 5.5 7.5 50 6.25 2.13 10.30
5 10 5 6 40 5 26.71 17.89
30 11 5.5 7.5 30 6.25 5.20 4.89
17 12 4.5 7.5 30 6.25 4.99 10.76
7 13 5 9 40 5 14.10 6.44
23 14 5.5 7.5 30 3.75 4.68 11.28
26 15 5.5 7.5 30 6.25 5.20 4.89
6 16 6 6 40 5 8.07 10.40
1 17 5 6 20 5 38.14 34.06
27 18 5.5 7.5 30 5 5.20 7.28
2 19 6 6 20 5 9.14 11.67
10 20 6 6 20 7.5 2.48 5.42
15 21 5 9 40 7.5 7.29 6.34
12 22 6 9 20 7.5 2.55 12.95
9 23 5 6 20 7.5 9.89 12.86
13 24 5 6 40 7.5 2.70 6.19
28 25 5.5 7.5 30 6.25 5.20 4.89
8 26 6 9 40 5 12.41 11.01
24 27 5.5 7.5 30 8.75 8.91 4.93
18 28 6.5 7.5 30 6.25 10.52 7.89
25 29 5.5 7.5 30 6.25 5.20 4.89
29 30 5.5 7.5 30 6.25 5.20 4.89
0 0.2 0.4 0.6 0.8 1 1.2
0 200 400 600 800 1000 1200 1400
D3 D6 D9
ce
ll
b
io
m
a
ss
(O
D
)
C
o
n
c
e
n
tr
a
ti
o
n
o
f
E
P
S
(m
g
/l
)
days
Table 2. Analysis of variance
Analysis of variance table [Partial sum of squares - Type III]
Source Sum of df Mean F p-value
squares square value Prob> F
Model 17.88 14 1.28 8.42 < 0.0001 significant
A-pH 0.13 1 0.13 0.84 0.3734
B-Incubation time 0.051 1 0.051 0.34 0.5693
C-Carbon source 0.27 1 0.27 1.76 0.2046
D-Nitrogen source 2.464E-003 1 2.464E-003 0.016 0.9003
Design-Expert® Software Factor Coding: Actual Exopolysaccharides (g/ml)
Design points above predicted value 38.14
2.13
X1 = A: pH X2 = B: Incubation time Actual Factors C: Carbon source = 30 D: Nitrogen source = 6.25
6 6.6 7.2 7.8 8.4 9 5 5.2 5.4 5.6 5.8 6 0 10 20 30 40 E x o p o ly s a c c h a r id e s ( g /m l) A: pH B: Incubation time (d)
Design-Expert® Software Factor Coding: Actual Exopolysaccharides (g/ml)
Design points above predicted value 38.14
2.13
X1 = A: pH X2 = C: Carbon source Actual Factors B: Incubation time = 7.5 D: Nitrogen source = 6.25
20 25 30 35 40 5 5.2 5.4 5.6 5.8 6 0 10 20 30 40 E x o p o ly s a c c h a r id e s ( g / m l) A: pH C: Carbon source (g/L)
Design-Expert® Software Factor Coding: Actual Exopolysaccharides (g/ml)
Design points above predicted value
Design points below predicted value
38.14
2.13
X1 = A: pH X2 = D: Nitrogen source Actual Factors B: Incubation time = 7.5 C: Carbon source = 30
5 5.5 6 6.5 7 7.5 5 5.2 5.4 5.6 5.8 6 0 10 20 30 40 E x o p o ly s a c c h a r id e s ( g /m l) A: pH D: Nitrogen source (g/l)
Design-Expert® Software Factor Coding: Actual Exopolysaccharides (g/ml)
Design points above predicted value
38.14
2.13
X1 = B: Incubation time X2 = C: Carbon source
Actual Factors A: pH = 5.5 D: Nitrogen source = 6.25
20 25 30 35 40 6 6.6 7.2 7.8 8.4 9 0 10 20 30 40 E x o p o ly s a c c h a r id e s ( g / m l)
Fig. 6. Response surface design of interaction among initial pH, incubation time, carb
Fig. 7. FT-IR spectrum of stra
Design-Expert® Software Factor Coding: Actual Exopolysaccharides (g/ml)
Design points above predicted value
Design points below predicted value
38.14
2.13
X1 = B: Incubation time X2 = D: Nitrogen source
Actual Factors A: pH = 5.5 C: Carbon source = 30
5 5.5 6 6.5 7 7.5
6 6.6 7.2
0 10 20 30 40
E
x
o
p
o
ly
s
a
c
c
h
a
r
id
e
s
(
g
/
m
l)
B: Incubation time (d) D: Nitrogen source (g/l)
6. Response surface design of interaction among initial pH, incubation time, carb source and nitrogen source
IR spectrum of strain code WAS11 exopolysaccharide
7.8 8.4 9
B: Incubation time (d)
Design-Expert® Software Factor Coding: Actual Exopolysaccharides (g/ml)
Design points above predicted value
Design points below predicted value
38.14
2.13
X1 = C: Carbon source X2 = D: Nitrogen source
Actual Factors A: pH = 5.5 B: Incubation time = 7.5
5 5.5 6 6.5 7 7.5
20 25 30
0 10 20 30 40
E
x
o
p
o
ly
s
a
c
c
h
a
r
id
e
s
(
g
/
m
l)
C: Carbon source (g/L) D: Nitrogen source (g/l)
6. Response surface design of interaction among initial pH, incubation time, carbon
35 40
Carbohydrates are the key nutritional requirement for the growth and cell development. Influence of carbohydrates on bacteria growth and EPS biosynthesis was reported to depend on strain type, specific sugar and cell carbohydrate characteristics [24]. This research studied the effect of both organic and inorganic carbon sources. Result of different inorganic carbon sources showed that sucrose substrate produced highest EPS yield than glucose and fructose substrates after 96h incubation. This was corresponding to the result obtained from the study of different carbon optimization by Shukla and others [14]. Supplementing the carbon source of medium by utilizing organic carbon extracts; SPP, RPP and SCB, results indicated that irrespective of the organic sources selected as carbon substrate, syntheses of EPS were higher than in inorganic carbon media. SPPE stimulated EPS production at least twice more than sucrose which was most suitable sugar used for this study. There study is synonymous with the study of Vaishnav and others [19]. Although cell growths were not stimulated suggesting that most sugars released from the organic extracts were employed for EPS production with little or no energy for growth [25].
Moghannem and others recommended that EPS production and yield were highly affected by the type and concentration of carbon sources in the medium (2018). Result obtained from the optimization study of the concentration of agricultural waste media indicated that SPPE was most effective and economical carbon source for EPS production among other carbon sources used. Bacterial growth and EPS yield
maintained higher levels at different
concentrations of SPPE comparable to skim milk
medium supplemented with whey protein
concentrate [26].
Cerning [27] stated that carbon source along with nitrogen source and other ion sources are important composition of media that enhance EPS production. Yeast extract was reported to
greatly influence EPS yield by L. plantarum
MTCC9510 and Paeniacillus polymyca EJS-3
[28,29]. Likewise study by Shankar and others showed that yeast extract was more efficient nitrogen substrate than other nitrogen sources
for growth and production of EPS by S. phocae.
The nitrogen substrates in this study were compared, though the maximum cell growth cell biomass was observed by urea containing medium but highest EPS yield was formed by yeast extract medium. This may be due to
presence of large quantities of free amino acids, short peptides and more growth factors on yeast extracts [30]. The production yield in BBE has a great economic interest as nitrogen source. Data obtained from single factor optimization indicated that the use of SPPE as carbon source and BBE as nitrogen source were significantly more economical nutritional requirement for production of EPS by isolate code WAS11 at industrial scale.
Zisu and Shah [31] described correlation exist between pH, EPS production yield and bacterial growth. The report of the influence of initial pH on production of EPS showed that as the pH reduce from 8 to 5, the EPS yield and the cell growth increase. Patel and others investigated the effect of pH on EPS production from pH range of 6 to 9 and results showed that lower pH gave higher EPS yield as compared to other pH (2018). Result confirmed that the highest bacterial growth and EPS yield was obtained at pH 5.
Throughout the optimization study of the influence of incubation days, EPS reached its maximum production yield at post stationary phase of the growth. Report illustrated that bacterial growth were retained at higher level while there was resulting decline of EPS yield after day 6 probably due to the action of glycohydrolase enzyme possibly released in the
culture medium which catalyzed the
polysaccharide degradation [32].
RSM depends on data obtained from single factor optimization and data analysis indicated that the maximum EPS yield was estimated to be 34.06 g/l and the actual yield obtained was 38.14 g/l which was in close accordance with the model prediction.
The FT-IR spectrum of the crude EPS code WAS11 strain revealed some characteristic functional groups according to data in literature. The broad stretching absorption peaks exhibited
at 3595, 3466 and 3297 cm-1 were assigned to
the hydroxyl (O-H) group of polysaccharide
(3600-3200 cm-1) [33]. The absorption at
2983cm-1 was attributed to the symmetrical
stretching vibration of aliphatic (CH2) group
which revealed the presence of sugar content [34]. The weak absorption peak noticed at 2687
and 2458 cm-1 correspond to amide stretching
vibration bands. An asymmetrical stretching peak
was observed at 1612 cm-1 which corresponds to
the ring stretching of galactose and mannose
represents asymmetrical bending of carboxylic acid group [35]. The stretching of C-O-C and C-O
at region of 1195 cm-1 was as result of the
glycosidic linkage corresponds to the presence of carbohydrates [36]. Furthermore, the peak at
1047 cm-1 (1000-1125 cm-1) range confirmed the
presence of uronic acid, O-acetyl ester linkage bonds [37]. Moreover, the small absorption at
approximately 852 cm-1 band was attributed to
sugar monomers in polysaccharide [38,39]. The
absorption at approximately 735 cm-1 (910-665
cm-1) peaks corresponds to the N-H wag of
primary amines [36].
5. CONCLUSION
This study concluded that bacterial strain code WAS11 posses the ability to grow and produce exopolysaccharide in defined medium whose carbon and nitrogen sources were replaced with hydrolyzed extracts of sweet potato peel and
bean bran as inexpensive resources.
Furthermore, the optimization study shows that 20 g/l of the sweet potato peels and 5 g/l of bean bran in the medium at pH 5 after 6 days produced highest yield (38.14 g/l) of the exopolysaccharide.
COMPETING INTERESTS
Authors have declared that no competing interests exist.
REFERENCES
1. Giavasis I. Production of microbial
polysaccharide for use in food. Microbial Production of Food Ingredients, Enzymes and Nutraceuticals. 2013;413-468.
DOI: 10.1533/9780857093547.2.413
2. Shukla PJ, Dave BP. Screening and
molecular identification of potential
exopolysaccharides (EPSS) producing
marine bacterial from the Bhavnagar coast
Gujarat. International Journal of
Pharmaceutical Science and Research. 2018;9(7):2973-2981.
3. Ates O. System biology of microbial
exopolysaccharide production. Frontier
Bioeng. Biotechnology. 2015;3:200.
4. Schmid J, Sieber V. Enzymatic
transformations involved in the
biosynthesis of microbial
exopolysaccharides based on the
assembly of repeat units. Chem. Biochem. 2015;16:1141-1147.
DOI: 10.1002/cbic.201500035
5. Arun J, Sathishkuma R, Muneeswaran T.
Optimization of extracellular
polysaccharide production in Halobacillus
trueperi AJSK using response surface
methodology. African Journal of
Biotechnology. 2014;13(48):4449-4457.
6. Oner ET. Microbial production of
extracellular polysaccharides from
biomass. Z. Fang, (Ed) Pretreatment techniques for biofuels and biorefineries. Green Energy and Technology. 2013;35-56.
DOI: 10.1007/978-3-642-32735-5-2
7. Moghannem SAM, Farag MMS, Shehab
AM, Azab MS. Exopolysaccharide
production from Bacillus velezensis
KY471306 using statistical experimental design. Brazillian Journal of Microbiology; 2018.
Available:https//10.1016/Jbm2017.05.012
8. Donot F, Fontana A, Baccou JC,
Schorr-Galindos. Microbial exopolysaccharides; Main examples of synthesis, excretion, genetics and extraction. Carbohydrate Polymer. 2012;87:951-62.
9. Sutherland IW. A sticky business. Microbial
polysaccharide, current products and
future trends. Microbiology Today.
2002;29:70-71.
10. Finore I, DiDonato P, Mastascusa V,
Nicolaus B, Poli A. Fermentation
technologies for the optimization of marine microbial exopolysaccharide production.
Marine Drugs. 2014;12:3005-3024.
DOI: 10.3390/md12053005
11. Rehm BHA. Bacterial polymers;
Biosynthesis, modifications and
applications. National Reviews in
Microbiology. 2010;8:578-592.
12. Kreyenschulte D, Krull R, Margaritis A.
Recent advances in microbial biopolymer
production and purification. Critical
Reviews in Biotechnology. 2014;34(1):1-15.
DOI: 10.3109/07388551.2012.743501
13. Nouha K, Yan S, Tyagi RD, Surampalli RY.
EPS producing microorganisms from
municipal wastewater activated sludge. Journal of Petroleum and Environmental Biotechnology. 2015;7:255.
14. Shukla V, Patel M, Dugginala. Isolation,
structural characterization and production of exopolysaccharide using batch culture
by Bacillus species isolated from soil.
International Journal of Research in
Engineering and Applied Science.
15. Hassan SWM, Ibrahim HAH. Production, characterization and valuable applications
of exopolysaccharide from marine
Bacillus subtilis SHI. Polish Journal of
Microbiology. 2017;66(4):449-461.
16. Dubois M, Gilles KA, Hamilton JK, Rebers
PA, Smith F. Colorimetric method for determination of sugars and related
substances. Analytical Chemistry.
1956;28:350-356.
17. Mishra A, Kumar N, Kumar R, Kumar R,
Tomar D. Mineralization of carbon,
nitrogen, phosphorus and sulphur from different organic waste in silty clay loam soils. Journal of Applied and Natural Science. 2016;8(1):16-22.
18. Patel K, Shah F, Dwivedi M.
Exopolysaccharide (EPS) producing
isolates from sugarcane field soil and antibacterial activity of extracted EPSs. Acta Scientific Microbiology. 2018;1(4):6-13.
19. Vaishnav A, Upadhyay K, Tipre D,
Dave S. Characterization of potent
exopolysaccharide producing bacteria
isolated from fruit pulp and potato
peels and enhancement in their
exopolysaccharide production potential. Journal of Microbiology, Biotechnology and Food Science. 2016;6(3):874-877.
20. Abu GO, Weiner RM, Rice J, Colwell RR.
Properties of an extracellular adhesive polymer from the marine bacterium,
Shewanella colwelliana. Biofouling.
1991;3:69-84.
21. Liu C, Lu J, Liu Y, Wang F, Xiao M.
Isolation, structural characterization and
immunological activity of an
exopolysaccharide produced by Bacillus
licheniformis. Bioresource Technology.
2010;101:5528-5533.
22. Vaningelgem F, Zamfir M, Adriany T,
DeVuyst. Fermentation conditions affecting
the bacterial growth and
exopolysaccharide production by
Streptococcus thermophilus ST111 in milk
based medium. Journal of Applied
Microbiology. 2004;97:1257-1273.
23. Vaningelgem R, Vander M, Zamfir M,
Adriany T, Laws P, DeVuyst L.
Streptococcus thermophilus ST 111
produces a stable-high-molecular-mass in milk-based medium. International Dairy Journal. 2004;14:857-864.
24. Nicolaus B, Schiano MV, Lama L, Poli A,
Gambacorta A. Polysaccharides from
extremophilic microorganisms. Origins.
Life Evolutional Biospheres. 2004;34:159-169.
25. Degeest B, DeVuyst L. Indication that the
nitrogen source influences both amount and size of exopolysaccharides produced
by Streptococcus thermophilus LY03 and
modeling of the bacterial growth and
exopolysaccharide production in a
complex medium. Applied Environmental Microbiology. 1999;65:2863-2870.
26. Zhang T, Zhang C, Li S, Zhang Y, Yang Z.
Growth and exopolysaccharide production
by Streptococcus thermophilus STI in skim
milk. Brazilian Journal of Microiology. 2011;42:1470-1478.
27. Cerning J. Exocellular polysaccharides
produced by lactic acid bacteria. FEMS Microbiology Review. 1990;87:113-130.
28. Sivakumar TSS, Narayani A, Shankar T,
Vijayabaskar P. Optimization of cultural condition for exopolysaccharide production
by Frateuria aurentia. International Journal
of Applied Biology and Pharmaceutical Technology. 2012;3:133-143.
29. Vijayabaskar P, Babinastarlin S, Shankar
T, Sivakumar T, Anandapandian KTK. Quantification and characterization of
exopolysaccharides from Bacillus subtillus
(MTCC 121). Advances in Biology
Resources. 2011;5:71-76.
30. Sivakumar T, Shankar T, Thangapandian
V, Mahendran S. Media optimization for
exopolysaccharide producing Klesiella
pneumonia KU215681 under varying
cultural condition. International Journal of Biochemistry and Biophysics. 2016;4(2): 16-23.
31. Zisu B, Shah NP. Effect of pH,
temperature, supplementation with whey protein concentrate and adjunct cultures on the production of exopolysaccharide
by Streptococcus thermophilus 1275.
Journals of Dairy Science. 2003;86:3405-3415.
32. Pham L, Dupont I, Roy D, Lapointe G.
Production of exopolysaccharide by
Lactobacillus rhamnosus and analysis of it
enzymatic degradation during prolonged
fermentation. Applied Environmental
Microbiology. 2000;6:2302-2310.
33. Kavita K, Singh VK, Mishra A, Jha B.
Characterization and antibiofilm activity of extracellular polymeric substances from
Oceanobacillus iheyensis. Carbohydrate
Polymers. 2014;101:29-35.
34. Iyer A, Mody K, Jha B. Characterization of
marine Enterobacter cloacae. Indian Journal of Experimental Biology. 2005;43: 467-471.
35. Freitas F, Alves VD, Pais J, Costa N,
Oliveira C, Mafra L, Hilliou L, Oliveira R,
Reis MA. Characterization of an
extracellular polysaccharide produced by a
Pseudomonas strain grown on glycerol.
Bioresource Technology. 2009;100(2):859-865.
36. Mishra A, Jha B. Isolation and
characterization of extracellular polymeric
substances from microalgae Dunaliella
salina under salt stress. Bioresources
Technology. 2009;100:3382-3386.
37. Bramhachari PV, Dubey SK. Isolation and
characterization of exopolysaccharide
produced by Vibrio harveyi strain VB 23.
The Society for Applied Microbiology,
Letters in Applied Microbiology. 2006;436: 571-577.
38. Castellane TC, Persona MR, Campanharo
JC, deMacedo Lemos EG. Production of exopolysaccharide from rhizobia with
potential biotechnological and
bioremediation applications. International Journal of Biological Macromolecules. 2015;74:515-522.
DOI: 10.1016/Jybiomac.2015.01.007
39. Chen Z, Shi J, Yang X, Liu Y, Nan B,
Wang Z. Isolation of exopolysaccharide producing bacteria and yeasts from
Tibetan kefir and characterization of
the exopolysaccharide. International
Journal of Dairy Technology. 2016;69:
3.
Available:https://doi.org/10.1111/1471-0307.12276
_________________________________________________________________________________
© 2019 Nwosu et al.; This is an Open Access article distributed under the terms of the Creative Commons Attribution License (http://creativecommons.org/licenses/by/4.0), which permits unrestricted use, distribution, and reproduction in any medium, provided the original work is properly cited.
Peer-review history: