BioMedCentral
Proteome Science
Open Access
Methodology
Development and standardization of multiplexed antibody
microarrays for use in quantitative proteomics
LT Perlee*
†1, J Christiansen
1, R Dondero
1, B Grimwade
1, S Lejnine
†1,
M Mullenix
1, W Shao
1, M Sorette
1, VT Tchernev
1, DD Patel
2and
SF Kingsmore
†1,3Address: 1Molecular Staging Inc., 300 George St., New Haven, CT 06511 USA, 2Thurston Arthritis Research Center and Department of Medicine,
University of North Carolina, 3330 Thurston Building, Chapel Hill, NC 27599 USA and 3National Center for Genome Resources, 2935 Rodeo
Park Drive East, Santa Fe, NM 87505 USA
Email: LT Perlee* - [email protected]; J Christiansen - [email protected]; R Dondero - [email protected]; B Grimwade - [email protected]; S Lejnine - [email protected]; M Mullenix - [email protected]; W Shao - [email protected]; M Sorette - [email protected]; VT Tchernev - [email protected];
DD Patel - [email protected]; SF Kingsmore - [email protected] * Corresponding author †Equal contributors
Abstract
Background: Quantitative proteomics is an emerging field that encompasses multiplexed measurement of many known proteins in groups of experimental samples in order to identify differences between groups. Antibody arrays are a novel technology that is increasingly being used for quantitative proteomics studies due to highly multiplexed content, scalability, matrix flexibility and economy of sample consumption. Key applications of antibody arrays in quantitative proteomics studies are identification of novel diagnostic assays, biomarker discovery in trials of new drugs, and validation of qualitative proteomics discoveries. These applications require performance benchmarking, standardization and specification.
Results: Six dual-antibody, sandwich immunoassay arrays that measure 170 serum or plasma proteins were developed and experimental procedures refined in more than thirty quantitative proteomics studies. This report provides detailed information and specification for manufacture, qualification, assay automation, performance, assay validation and data processing for antibody arrays in large scale quantitative proteomics studies.
Conclusion: The present report describes development of first generation standards for antibody arrays in quantitative proteomics. Specifically, it describes the requirements of a comprehensive validation program to identify and minimize antibody cross reaction under highly multiplexed conditions; provides the rationale for the application of standardized statistical approaches to manage the data output of highly replicated assays; defines design requirements for controls to normalize sample replicate measurements; emphasizes the importance of stringent quality control testing of reagents and antibody microarrays; recommends the use of real-time monitors to evaluate sensitivity, dynamic range and platform precision; and presents survey procedures to reveal the significance of biomarker findings.
Published: 15 December 2004
Proteome Science 2004, 2:9 doi:10.1186/1477-5956-2-9
Received: 30 July 2004 Accepted: 15 December 2004
This article is available from: http://www.proteomesci.com/content/2/1/9
© 2004 Perlee et al; licensee BioMed Central Ltd.
Background
Traditional immunoassay platforms have very limited multiplexing capability and high sample volume require-ment. The development and application of high through-put, multiplex immunoassays that measure hundreds of known proteins in complex biological matrices, is becom-ing a significant tool for quantitative proteomics studies, diagnostic discovery and biomarker-assisted drug devel-opment [reviewed in [1-4]]. Two broad categories of anti-body microarray experimental formats have been described: [1] direct labelling, single antibody experi-ments, and [2] dual antibody, sandwich immunoassays [4]. In the direct labelling method, all proteins in a com-plex mixture are tagged, providing a means for detecting bound proteins following incubation on an antibody microarray. In the sandwich immunoassay format, pro-teins captured on an antibody microarray are detected by a cocktail of detection antibodies, each antibody matched to one of the spotted antibodies. In addition, a variety of microarray substrates have been described, including nylon membranes, plastic microwells, planar glass slides, gel-based arrays and beads in suspension arrays. Much effort has been expended in optimizing antibody attach-ment to the microarray substrate. Finally, various signal generation and signal enhancement strategies have been employed in antibody arrays, including colorimetry, radi-oactivity, fluorescence, chemiluminescence, quantum dots and other nanoparticles, enzyme-linked assays, reso-nance light scattering, tyramide signal amplification and rolling circle amplification. Each of these formats and pro-cedures has distinct advantages and disadvantages, relat-ing broadly to sensitivity, specificity, dynamic range, multiplexing capability, precision, throughput, and ease of use [1-4]. In general, multiplexed microarray immu-noassays are ambient analyte assays [5]. Given the hetero-geneity of antibody array formats and procedures currently in use in proteomics studies, and the absence of a "gold standard", there exists an urgent need for develop-ment and adoption of standards that permit platform comparisons and benchmarking.
Unique, general considerations in assembling multi-plexed immunoassays include: Requirements for elimina-tion of assay cross-reactivity; configuraelimina-tion of multi-analyte sensitivities; achievement of dynamic ranges appropriate for biological relevance when performed in diverse matrices and biological states; and optimization of reagent manufacturing and chip production to achieve acceptable reproducibility. In contrast to traditional mon-oplex enzyme-linked immunoassays, generally agreed specifications and standards for antibody microarrays have not yet been formulated. A number of recent articles have started to examine certain of these issues [3,6,7].
Microarray immunoassays performed on planar glass slides and employing signal enhancement with rolling cir-cle amplification (RCA), have been developed by several groups and have demonstrated usefulness in measure-ments of temporal and dose-dependent changes in a vari-ety of immunological model systems and human diseases [[1,2,8-16]; Patel, D.D. et al. Submitted]. In general, these RCA microarray immunoassays have utilized indirect sandwich immunoassays featuring five steps (Figure 1):
I. Analytes in an applied sample bind to capture antibod-ies immobilized on a silanized glass surface.
II. Applied secondary biotinylated detector antibodies bind to captured analytes, creating a highly specific immune complex.
III. Biotinylated detector antibodies bound to the immune complex are detected with a universal anti-biotin antibody. The latter is conjugated to primer oligonucle-otides that are pre-annealed to a complementary circular oligonucleotide.
IV. DNA polymerase extends the 3' ends of primers around the circles, resulting in long, single stranded RCA products that remain attached to the complex.
The RCA product, composed of tandem DNA repeats complementary to the circle sequence, is detected by hybridization with cyanine 5 (Cy5)-labeled complemen-tary oligonucleotides.
The present report describes initial development of ardized operating procedures, quality controls and stand-ards for microarray immunoassays performed on planar glass slides using signal enhancement with RCA. These metrics have been tested for use in generation of data with adequate sensitivity, reproducibility and assay perform-ance for biomarker discovery [[12-14,16], Patel D.D et al., submitted]. Initial specifications and standards are also described for the addition of new analytes to antibody microarrays, which are needed to ensure that a high level of performance is maintained. While certain of these rec-ommendations and standards are specific to RCA immu-noassays, others represent generally applicable first generation standards for benchmarking antibody array platforms that enable interoperability of data generated in proteomics studies.
Results
Data Quality
Proteome Science 2004, 2:9 http://www.proteomesci.com/content/2/1/9
slides with RCA signal enhancement was evaluated for specificity, sensitivity, reproducibility and accuracy using standardized titrations, spiked biological matrices and clinical samples. Array performance was evaluated based on ability to: measure analytes across a broad dynamic range at sufficiently low coefficients of variation (CVs); detect proteins at levels requisite to capture biologically relevant expression differences; confirm reliability of methods to normalize data to minimize platform impre-cision and demonstrate the utility of generating standard curves to convert analyte MFI (mean fluorescence inten-sity) data into mass unit information.
Data Redaction
An advantage of arrays is the ability to measure each ana-lyte multiple times, enhancing precision. Capture anti-body spots were printed in quadruplicate on planar glass slides providing redundancy of individual analyte
meas-urements. Data redaction was applied to raw immu-noassay data to improve data quality by eliminating outlier data points. Outliers were identified by employing two subsequent statistical approaches in a step-wise manner.
First, the Bland-Altman plot was used. Bland-Altman plots are often used in DNA microarray analysis to identify dif-ferences and/or replicate outliers. This involves plotting the difference between the logarithm of intensities of two replicates (M) versus the average of logarithm of intensi-ties (A) for each analyte within an individual array (see Material and Methods). Thus, there will be 6 MvA plots for each data set to reflect the 170 analytes positioned across 6 arrays. Each MvA plot will contain 3*Ns*Na points, where 3 reflects the number of possible unique pair wise combinations of the three replicates, Ns repre-sents the number of samples and Na defines the number
Schematic layout of antibody microarray slide and RCA immunoassay Figure 1
Schematic layout of antibody microarray slide and RCA immunoassay. At the far left is an illustration of the 1" × 3" slide platform containing sixteen individual sample wells with an etched barcode. Within each of the wells, a 16 × 16 configura-tion of printed capture antibodies is arrayed. Each of the capture antibodies is capable of binding analytes from applied samples and undergoing RCA signal amplification. Finally, the fluorescently labeled signal, detected through conventional laser scanning, is quantified.
MS
I
MS
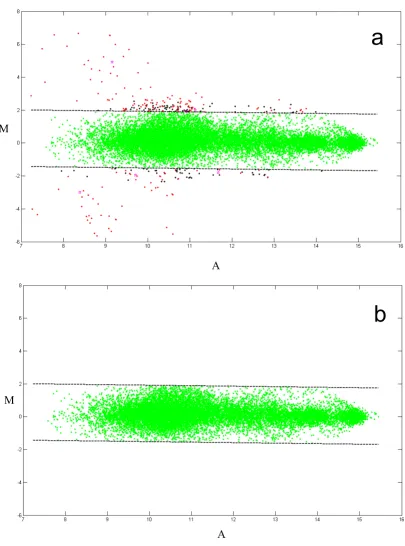
An example of raw data quality and outlier removal Figure 2
An example of raw data quality and outlier removal. (panel a, top) Raw data (37 analytes) from array 4 containing all sample replicates shown on an MvA plot (a typical microarray data plot of the log ratio vs. the log difference for each pair of
intensities. See: Dudoit, S., Yang, Y. H, Callow, M. J., and Speed, T. P. (2002) Statistica Sinica 12, 111–140). The dashed lines
indi-cate a 99% confidence interval around the data and outliers of this interval are shown in red, black or magenta. (panel b, bottom)
Redacted data with 1% of outlier data removed (all points outside of the displayed confidence interval).
a
M
A
b
M
Proteome Science 2004, 2:9 http://www.proteomesci.com/content/2/1/9
of analytes measured on a given array. An example of an MvA plot produced in a project comprising 150 clinical serum samples for Array 4 with 37 analytes is shown in Figure 2 (panel a). This plot contains 3*150*37 = 16650 data points. The quadruplicate measurements within an arrayfor each anlayte are represented as a mean replicate value.. Lines represent 99% confidence intervals for indi-vidual data points. Data points outside of 99% confidence intervals are considered outliers. The quality and /or intensity of individual spots are manually investigated for each outlier by using proprietary visualization software, which allows examination of individual spot image/qual-ity at every data processing step. Outliers are redacted by removing aberrant spots from the data set. The resulted MvA plot is shown on Figure 2 (panel b).
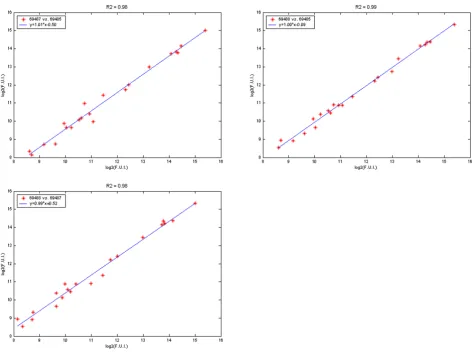
The second step of data reduction involves a linear corre-lation analysis. Pair-wise correcorre-lation analysis is done between all replicates of individual sample. Figure 3 shows the three scatter plots generated for the three repli-cates of a representative sample. The correlation coeffi-cient (R2) is examined for each plot. Each plot contains Na
data points, where Na reflects the number of analytes. Plots with R2 values <0.95 are examined to identify the
cause of the poor correlation. We have identified two major sources of poor correlation: incorrect positioning of the capture grid during image quantitation and general aberrations in image spot quality. Assigning the specific source of low correlation is accomplished by tracing back to the image data. In the case of grid misplacement, sus-pect data images are re-quantified. Poor correlations due
Pair wise scatter plots between three replicates of a sample Figure 3
Pair wise scatter plots between three replicates of a sample. Each replicate was assayed on a different slide. Solid lines repre-sent linear regression fits. Regression equation is indicated within legend box along with the individual slide barcodes for this
particular assay. R2 value of the fit is indicated in the title. Both X and Y-axes indicate mean fluorescence signal Log
to aberrant spot morphology/intensity are manually examined and removed from data set. If the R2 value does
not improve as a result of outlier removal, the replicate is redacted from the data set. The sample is considered passed if there are two replicates with R2 >= 0.95. The pass
rate is defined as the number of passed samples divided by the total number of samples. A run of an array is con-sidered to be passed if 85% of the samples have two or more passed replicates.
In our experience, applying the MvA statistical approach first, followed by the linear correlation analysis is an effi-cient process to identify outliers without compromising data throughput. Since, MvA plots can be generated quickly, it allows for relatively fast redaction of significant outliers using an objective semi-automated approach. In contrast, the sample correlation analysis is considerably more labor intensive and currently requires manual inves-tigation of each scatter plot with R2 values < 0.95. This
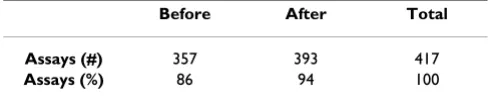
process reduces throughput of data redaction, particularly on large data sets. Table 1 shows the impact of using MvA plot analysis as a first step approach for outlier removal in a clinical project containing 106 samples. Each assay in Table 1 represents a single sample replicate, with a total possible number of assay points equal to 418 (106*3 = 418). The table reflects an assay count of 417 due to one sample having only two replicates due to a shortfall in sample volume. The correlation analysis performed on all sample replicates increased the pass rate by 8% following outlier removal. This improvement was due to the elimi-nation of individual analyte replicates having a negative impact on total sample correlation derived from all ana-lyte replicates within an array (Table 1).
In general, for data sets with more than 40 samples, out-lier removal only demonstrated small improvements in reducing average CVs across all samples. The most signifi-cant impact of outlier removal is on improving reproduc-ibility across the three replicates of the individual samples. In our experience, outlier removal has been shown to reduce individual sample replicate CVs by 2–3 fold. This effect is directly related to improving sample correlation pass rates by by 10–20%.
Normalization
Many systematic factors can modify spot intensity during the process of measurement. Normalization is the process of reducing the effects of systematic variation on spot intensity. Normalization in DNA microarrays typically involves adjusting distributional summaries of data (mean, median) from each chip to common reference val-ues. For example, one assumption could be that the aver-age signal from each protein chip should be the same, as with DNA microarrays and the difference between repli-cate values is due to systematic variability in the measure-ment process. Unfortunately, the nature of protein antibody microarrays, configured with a multiplex of individual capture and detector antibodies, is more spe-cialized and differentiated than that of a DNA microarray. Use of a single reference factor derived from a global value is not sufficiently refined to take into account the differ-ence in platform configuration. In the current report, the organization of protein microarrays allows the measure-ment of up to 16 samples per slide (chip). This is very dif-ferent from DNA microarrays where one chip represents the total collection of measured values for an individual sample.
To accommodate the differences inherent to the platform, we have applied a normalization strategy based on the three major sources of technical variability observed in our system. The first type of variability relates to spot-to-spot differences observed between quadruplicate spot-to-spots of the individual analytes printed within a sample well. The second level of variability can be described as the differ-ence in measurements between wells within the same slide. The third element of variability represents the varia-bility observed between sample wells compared across different slides. We found that slide-to-slide variability is the largest source of variation accounting for more than 70% of the total measurement imprecision (data not shown). Thus the goal of normalization is to reduce the imprecision of slide-to-slide measurement error since this represents the major source of platform variability.
Normalization is performed using a system of standard controls to reduce the effect of slide-to-slide variability. A series of four standard control samples (see "Anchor Point Calibrators" in Methods and Materials) are run in 4 wells of each slide. Each control sample represents a cocktail of the full repertoire of analytes for the given array tittered at 4 specific concentrations. The standards have been optimized at concentrations (12 pg/ml, 111 pg/ml, 333 pg/ml and 1000 pg/ml) to capture measurements across the linear range of detection for each analyte. The global average of total analyte signal for the four prepared con-trols is calculated across all slides run in a batch. An adjustment factor is created for each slide that reflects the difference between global intensity average for all slides
Table 1: Improved sample pass rates achieved through individual analyte data reduction
Before After Total
Assays (#) 357 393 417
Proteome Science 2004, 2:9 http://www.proteomesci.com/content/2/1/9
and the individual intensity average based on the controls from the individual slide. The averaged pixel intensity of each spot on the slide is scaled by the adjustment factor.
As an example, the average value of the adjustment factor was evaluated across a batch of 33 slides and found to
have a value of 1.33+/- 0.47. The primary benefit of nor-malization was in reducing the replicate sample CVs. Fig-ure 4 contains two panels revealing the impact of normalization on individual analyte CVs across a series of samples for a given analyte. The upper panel shows the variation in raw MFI signal intensities on a logarithm scale
Effect of Normalization Figure 4
observed between the 3 replicate measurements for each of the 11 samples. The lower panel reveals the impact of normalization on reducing variability. Normalization typically reduced sample replicate CVs an average of 5% without producing rank order changes in analyte MFI.
Assessment of Platform Precision
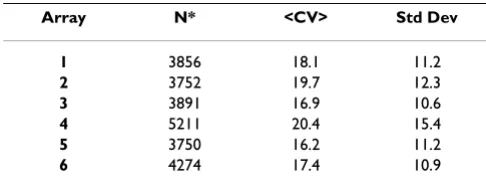
A 15-point series of standardized titrations containing recombinant proteins diluted in buffer were used to eval-uate platform precision. This assessment was used in the quality control of each slide lot prior to release, as well as within each client project to verify run-time analyte per-formance. Six replicates for each point were run in the quality control testing of each slide lot and six replicates of each point were run within each client study to generate standard curves. CVs were evaluated for each concentra-tion of analyte across six slides. Average CVs were calcu-lated for each analyte. Statistical summaries of CV distribution across all array 2 analytes using the standard-ized 15-point standard titration series are shown in Table 2. The mean CVs of the control titration replicates were typically in the 10–15% range following normalization. Collectively evaluating mean, median and interquantile range CVs served to identify measurements significantly influenced by outlier values producing a skewed distribu-tion. In general, CVs obtained for the quadruplicate within-well analyte measurements were 5–9% for the pre-pared controls. Replicate sample CVs obtained from bio-logical samples tended to be somewhat higher than prepared controls with quadruplicate within well meas-urements at 10–15% post normalization and 20–25% average CVs for replicates samples positioned in wells across different slides. Table 3 reveals CVs obtained in a project containing 110 clinical serum samples run across the 6 arrays. Each sample was tested in triplicate generat-ing 3 replicates measurements obtained from 3 different slides. The average CVs were 18%, 20%, 17%, 20%, 16% and 17 % for Arrays 1, 2, 3, 4, 5 and 6 respectively. The
data reduction rate was less than 5% of all data points. This reduction rate is typical of what we have observed across more than 30 clinical projects.
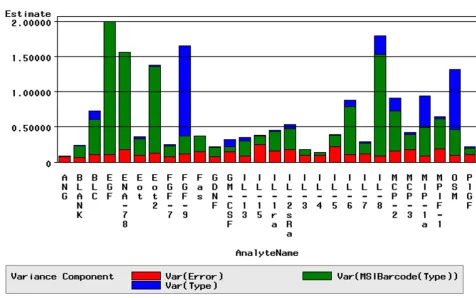
Variance Decomposition
A variance decomposition analysis was performed to reveal the extent to which platform error influenced the ability to identify biomarkers. The variance component assigned to platform error was typically found to be an order of magnitude lower than the average inter-individ-ual variation. Figure 5 reveals the contribution of platform error on the total variance observed in a given project for each analyte across array 1. These results indicated the sys-tem variability was sufficiently low to capture moderate expression level differences that were reflective of biolog-ical change.
Average lower limit of quantitation (LLQ)/ upper limit of quantitation (ULQ) values and analyte dynamic range
The left panel of Figure 6 shows a typical dose response curve of MFI (mean fluorescence intensity) versus analyte concentration, generated for a single analyte based on the 3 replicate measurements from the 15-point titration series containing a multiplex of recombinant analytes
Table 2: Mean and standard deviation of analyte MFI CVs from titration standards for a given array
%CV
Conc. (pg/ml) N* Maximum Mean Minimum Std. Dev.
12 26 19.4 14.0 9.4 2.4
111 26 15.8 9.4 6.1 2.9
333 26 15.3 9.4 4.5 2.5
1,000 26 29.1 12.0 2.6 5.8
3,000 26 26.4 9.7 2.5 6.2
9,000 26 22.2 7.8 2.8 4.3
27,000 26 16.3 8.2 2.5 4.0
81,000 26 19.7 7.8 2.6 4.1
* N reflects 26 analytes measured on array 2.
Table 3: Mean and standard deviation of MFI CVs from clinical samples
Array N* <CV> Std Dev
1 3856 18.1 11.2
2 3752 19.7 12.3
3 3891 16.9 10.6
4 5211 20.4 15.4
5 3750 16.2 11.2
6 4274 17.4 10.9
Proteome Science 2004, 2:9 http://www.proteomesci.com/content/2/1/9
spiked into buffer at fixed concentrations. Each titration point was replicated across 3 control slides generating 3 replicate measurements. The vertical lines defined the LLQ and ULQ as well as the dynamic range of the individ-ual analyte within a 30% CV of analyte concentration. The right panel of Figure 6 shows the corresponding clinical sample values obtained in the same run revealing the sam-ple values that fell within, above and below the linear range of detection as defined by the standard titrations. Table 4 contains a summary of the average dynamic range obtained for the 170 analytes surveyed over 8 independ-ent runs.
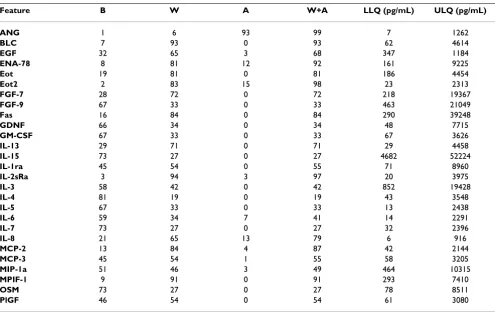
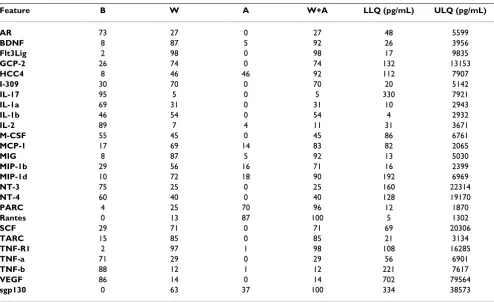
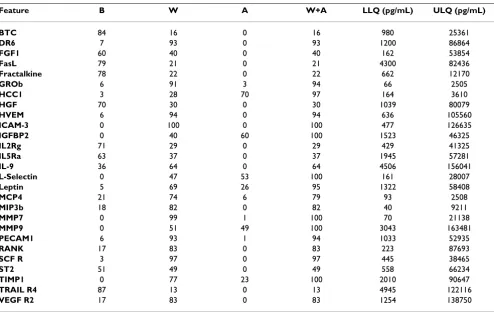
Performance assessment
A performance assessment of individual analytes was con-ducted to determine the utility of each analyte across mul-tiple projects covering diverse disease areas. Each analyte was evaluated according to the percentage of clinical
sam-ples that fell within (W), below (B) or above (A) the linear range of detection. (Tables 5,6,7,8,9,10) Analytes were considered to be detectable if the percentage of samples that fell in the W+A categories was greater than 50%. The projects surveyed across 8 independent studies containing over 1,000 clinical samples. The disease areas included rheumatoid arthritis, osteoarthritis, systemic lupus ery-thematosus (SLE), chronic obstructive pulmonary disease (COPD), asthma, diabetes and ovarian cancer. The average percentage of detectable analytes was 56% for array 1, 62% for array 2, 67% for array 3, 73% for array 4, 81% for array 5 and 85% for array 6 across the 8-project survey group. A limited number of analytes (<5%) revealed high endogenous concentrations, producing assay saturation where >90% of the measured samples fell above the linear range of detection. In most cases, this could be resolved by re-running a sample dilution or scan-ning at a lower gain. Although there were analytes that
Variance Decomposition Figure 5
had detectable percentages below 50%, in many cases these reflected analytes that were only detected under up-regulated conditions associated with specific disease states or conditions of drug induction, revealing value within specific disease or therapeutic areas. Tables 5,6,7,8,9,10 also reveal the average LLQ/ULQ values of the 170 ana-lytes within a 30% CV of concentration obtained from the control titrations run in parallel with the clinical samples.
Validation of Array Performance
The development of an antibody array featuring 25–40 novel immunoassays requires extensive validation related to the comprehensive assessment of antibody cross reac-tivity, definition of analyte minimal detection limits
(MDL) and establishing robust assay performance. Each antibody array must be validated for use with several matrices, since the latter may have different ambient ana-lyte levels (and therefore, different ideal MDL) or cross-reactivity profiles.
Analyte sensitivity
Analyte sensitivity was assessed to identify analytes lack-ing adequate performance for retention on an array. Addi-tional experiments were performed to determine the endogenous levels of each analyte. For analytes without previously reported biological values, the "0 × n" assays indicated the approximate ambient analyte level. Testing across multiple biological matrices was required, since
LLQ/ULQ Figure 6
LLQ/ULQ. (Left) Plot of 3 replicate points from a 15-point titration series of IL-8. The LLQ is indicated by the green vertical line and the ULQ indicated by the rightmost black vertical line. The zero point was removed from the curve fitting procedure since the data undergoes a log transformation. The right panel reveals sample values that fell within and above dynamic range of assay. Here, the majority of tested points for IL-8 fell within the LLQ/ULQ dynamic range.
Table 4: Average dynamic range achieved across each of the production arrays
Detectable1
((W+A)>50%)
> 1 log > 1.5 log > 2 log > 2.5 log > 3 log
Array 1 59% 96% 78% 41% 0% 0%
Array 2 65% 100% 92% 77% 12% 0%
Array 3 67% 100% 70% 33% 7% 0%
Array 4 92% 97% 92% 54% 16% 3%
Array 5 100% 92% 80% 48% 20% 0%
Array 6 85% 100% 74% 41% 7% 0%
Average 78% 98% 81% 49% 10% 1%
Proteome Science 2004, 2:9 http://www.proteomesci.com/content/2/1/9
different matrices affected the detection of analyte specific signals. The "0 × n" experiments also revealed the level of non-specific background which was influenced by the total concentration of antibody load in the detector mix. In our experience, certain plasma matrices were also more likely to generate high background when compared to matched serum samples. The impact of high generalized background is a reduced sample pass rate. When back-ground was observed, the total detector antibody concen-tration could often be reduced to minimize background noise. Ultimately, a balance between reduction in back-ground and enhancement of sensitivity was required to achieve maximal analyte performance in a mutiplex configuration.
Analyte cross reaction
The results of the 1 × (n-1) assays identified analytes that demonstrated cross-reaction between the captured ana-lyte and the complex detector mix prepared without the cognate detector antibody. Binding between the spiked analyte and the cognate capture that generated signal, indicated a cross-reaction to one or more non-cognate
detector antibodies contained within the complex mix. In cases where non-cognate detector signal was observed, an additional series of experiments were run with the corresponding analyte tested against each of the individ-ual detectors to identify the cross-reacting detector anti-body. Since cross reaction is an additive process, the outcome of the cross reaction assessment allowed for adjustments to be made to achieve a balance between maximizing content with multiplexed array specificity. The 0 × (n-1) assays were run to provide a baseline of MFI values to compare to the results obtained in the 1 × (n-1). In addition, the 0 × (n-1) experiments also served to screen the various biological matrices for cross-reactivity with endogenous proteins.
Analyte performance under multiplexed conditions
Serum MDLs were typically found to be higher than buffer MDLs due to the presence of endogenous analyte, poten-tial analyte-binding proteins present in the biological matrix and other possible matrix-related interferences. The assay conditions used to stress test the system under conditions of high analyte load were designed to identify
Table 5: Array 1: Averaged LLQs/ULQs in pg/mL obtained from 15 point standard titrations
Feature B W A W+A LLQ (pg/mL) ULQ (pg/mL)
ANG 1 6 93 99 7 1262
BLC 7 93 0 93 62 4614
EGF 32 65 3 68 347 1184
ENA-78 8 81 12 92 161 9225
Eot 19 81 0 81 186 4454
Eot2 2 83 15 98 23 2313
FGF-7 28 72 0 72 218 19367
FGF-9 67 33 0 33 463 21049
Fas 16 84 0 84 290 39248
GDNF 66 34 0 34 48 7715
GM-CSF 67 33 0 33 67 3626
IL-13 29 71 0 71 29 4458
IL-15 73 27 0 27 4682 52224
IL-1ra 45 54 0 55 71 8960
IL-2sRa 3 94 3 97 20 3975
IL-3 58 42 0 42 852 19428
IL-4 81 19 0 19 43 3548
IL-5 67 33 0 33 13 2438
IL-6 59 34 7 41 14 2291
IL-7 73 27 0 27 32 2396
IL-8 21 65 13 79 6 916
MCP-2 13 84 4 87 42 2144
MCP-3 45 54 1 55 58 3205
MIP-1a 51 46 3 49 464 10315
MPIF-1 9 91 0 91 293 7410
OSM 73 27 0 27 78 8511
PlGF 46 54 0 54 61 3080
cross-reaction thresholds for each of the individual ana-lytes. MFI cut off values were used to identify significant increases in non-cognate signal that warranted removal of a feature from the array. The results provide a certain util-ity in predicting array performance under conditions where sample analyte concentrations exceed reported bio-logical levels. Examples might include patient samples tested under diseased states, elevated analytes produced in stimulated cell culture supernatants or in samples exhibiting a strong drug response. The final validation involved measuring the accuracy of the multiplex assay when challenged with a high concentration of analyte. Figure 7 shows the correlations of signal intensities obtained between (1 × n) compared to (n × n)
experi-ments at 50x MDL levels. High R2 values obtained
between the two conditions provided a measurement of the accuracy of the multiplexed system.
Discussion
Thirty years of widespread use of conventional, monoplex immunoassays has established firm benchmarks for per-formance in protein measurement. In the present paper, we have examined several, unique but general
considera-tions in assembling multiplexed immunoassays with performance similar to conventional monoplex immu-noassays. These include development of a comprehensive validation program to identify and minimize antibody cross reaction under highly multiplexed conditions; appli-cation of standardized statistical approaches for data han-dling for highly replicated assays; inclusion of standardized samples in each run to normalize sample replicate measurements; quality control of reagents and antibody microarrays; implementation of real-time mon-itors to evaluate sensitivity, dynamic range and platform precision; and initial procedures for identification of spe-cific, significant immunoassay results in biomarker dis-covery projects involving clinical samples. Each of these will be discussed briefly.
Requirement for a comprehensive array validation program
An array validation program represents the foundation of tests required to establish robust assay performance in a multiplexed environment. The most significant compo-nent in array validation is the comprehensive evaluation of cross reactivity. The vast majority of the ~5000
com-New array validation Figure 7
New array validation. Stress testing at 50X MDL analyte concentration. The pink line reveals the specific MFI signal for each analyte at 50X MDL in the presence of all detectors (n × n). The blue line shows the signal for each analyte under conditions where all analytes are added at 50X MDL along with all detector antibodies minus the cognate detector antibody (n × (n-1)) to reveal non-specific signal contributed by non-cognate detectors.
Proteome Science 2004, 2:9 http://www.proteomesci.com/content/2/1/9
monly available antibody pairs available today have not previously been evaluated for cross reactivity in a multi-plexed environment. Therefore, the recommended pro-gram should include procedures that identify analytes demonstrating cross reactivity with immobilized capture antibodies as well as cross reaction that might manifest between the secondary detector antibody with a non-cog-nate analyte or non-specific binding to an immobilized capture agent.
The performance of analytes in a multiplexed configura-tion should be benchmarked against the baseline, mono-plex performance. This multimono-plexed immunoassay comparison with baseline performance, together with minimal standards for multiplexed cross-reactivity, per-mits determination of the practical, optimal number of array elements that can be successfully combined. In our experience, using dual-antibody, sandwich immu-noassays, planar glass slides and RCA signal amplifica-tion, protein micorarrays can generally accommodate multiplexing of 25–35 analytes without an appreciable drop in individual analyte sensitivity or performance. Specifically, we have described development of six
differ-ent dual-antibody sandwich immunoassay arrays, each containing 25–37 sandwich immunoassays. Since cross reactivity is an additive process, the ultimate goal is to achieve a balance between maximal multiplexing and monoplex-like performance. With exhaustive selection for antibodies without cross-reactivity in multiplexed format, it is possible to multiplex 50 sandwich immunoassays. However, this exercise is very expensive. In our experience, suspension arrays, alternative microarray surface sub-strates and attachment chemistries do not offer significant advantages in multiplexing while maintaining performance. We have not evaluated the impact of novel, affinity ligands on multiplexing.
Additional array validation for cross-reactivity should include "stress-testing" under high analyte load to reflect conditions where analytes may be significantly over-expressed. In our experience, levels of induction of pro-teins in common biological matrices can be very large fol-lowing drug administration or in disease states, and may induce cross-reactivity that is not observed in testing within normal biological analyte levels.
Table 6: Array 2: Averaged LLQs/ULQs in pg/mL obtained from 15 point standard titrations
Feature B W A W+A LLQ (pg/mL) ULQ (pg/mL)
AR 73 27 0 27 48 5599
BDNF 8 87 5 92 26 3956
Flt3Lig 2 98 0 98 17 9835
GCP-2 26 74 0 74 132 13153
HCC4 8 46 46 92 112 7907
I-309 30 70 0 70 20 5142
IL-17 95 5 0 5 330 7921
IL-1a 69 31 0 31 10 2943
IL-1b 46 54 0 54 4 2932
IL-2 89 7 4 11 31 3671
M-CSF 55 45 0 45 86 6761
MCP-1 17 69 14 83 82 2065
MIG 8 87 5 92 13 5030
MIP-1b 29 56 16 71 16 2399
MIP-1d 10 72 18 90 192 6969
NT-3 75 25 0 25 160 22314
NT-4 60 40 0 40 128 19170
PARC 4 25 70 96 12 1870
Rantes 0 13 87 100 5 1302
SCF 29 71 0 71 69 20306
TARC 15 85 0 85 21 3134
TNF-R1 2 97 1 98 108 16285
TNF-a 71 29 0 29 56 6901
TNF-b 88 12 1 12 221 7617
VEGF 86 14 0 14 702 79564
sgp130 0 63 37 100 334 38573
Finally, array validation should be performed across all common sample matrices to examine effects on assay performance associated with endogenous analyte, matrix specific analyte binding proteins or other matrix-specific inhibitors. Absence of cross-reactivity for an immu-noassay in one matrix does not always imply absence of cross-reactivity in others. The matrices for which the anti-body microarrays described herein have been validated include isotonic buffers, serum, citrate plasma, heparin plasma, EDTA plasma, cell culture supernatants, amniotic fluid, sputum, and exhaled breath condensates. Several of the arrays have also been validated for use with ex vivo treated whole blood. EDTA plasma and ex vivo treated whole blood had higher levels of background signal and lower sample pass rates than other matrices.
Applying Standardized Approaches to Data Redaction A significant advantage of array-based immunoassays is the ability to measure each analyte in a sample many times. Removal of outlier replicates is obligatory for microarray assays due to signal-related and morphology-based artefacts typically associated with dispersing small
volumes of material on a solid substrate in a microarray format. Application of standardized statistical approaches for data redaction is superior to manual inspection and removal of outliers since operator-dependent subjectivity is minimized and throughput is greatly increased. The data redaction procedures described herein employed two, separate steps: Bland-Altman plots and linear correlation analysis. Bland-Altman plots were employed first and identified 99% confidence intervals for all collected data points. This enabled rapid identification and elimination of the outlying 1% of the data with min-imal human intervention. This was determined to be an objective, reproducible redaction procedure that greatly reduced time and effort associated with the subsequent, second data redaction step of linear correlation analysis. Linear correlation analysis required performance of 3 replicate assays on each sample, and manual inspection of the series of 3 scatter plots generated from pair-wise corre-lations of these 3 sample replicates. Individual replicate points for each specific analyte that fell outside the R2>
0.95 range were eliminated. In order for data from sample replicates to pass and be admitted into the final data set,
Table 7: Array 3: Averaged LLQs/ULQs in pg/mL obtained from 15 point standard titrations
Feature B W A W+A LLQ (pg/mL) ULQ (pg/mL)
BTC 84 16 0 16 980 25361
DR6 7 93 0 93 1200 86864
FGF1 60 40 0 40 162 53854
FasL 79 21 0 21 4300 82436
Fractalkine 78 22 0 22 662 12170
GROb 6 91 3 94 66 2505
HCC1 3 28 70 97 164 3610
HGF 70 30 0 30 1039 80079
HVEM 6 94 0 94 636 105560
ICAM-3 0 100 0 100 477 126635
IGFBP2 0 40 60 100 1523 46325
IL2Rg 71 29 0 29 429 41325
IL5Ra 63 37 0 37 1945 57281
IL-9 36 64 0 64 4506 156041
L-Selectin 0 47 53 100 161 28007
Leptin 5 69 26 95 1322 58408
MCP4 21 74 6 79 93 2508
MIP3b 18 82 0 82 40 9211
MMP7 0 99 1 100 70 21138
MMP9 0 51 49 100 3043 163481
PECAM1 6 93 1 94 1033 52935
RANK 17 83 0 83 223 87693
SCF R 3 97 0 97 445 38465
ST2 51 49 0 49 558 66234
TIMP1 0 77 23 100 2010 90647
TRAIL R4 87 13 0 13 4945 122116
VEGF R2 17 83 0 83 1254 138750
Proteome Science 2004, 2:9 http://www.proteomesci.com/content/2/1/9
the overall sample replicate-to-replicate correlation for the 25–37 analytes of the array was required to have an R2> 0.95. Experience in multiplexed immunoassay
meas-urements in samples across more than 30 research projects indicated the R2 value >0.95 to be routinely
achievable and associated with high quality replicate data. In each project, the data lost through these two sequential redaction procedures was typically less than 5% of the total original data. An additional quality metric to assess the overall run performance was that at least two of the three replicates must have passed for 85% of the total samples. Runs falling short of this metric were failed and
subject to repeat. The typical run fail rate was less than 3%.
Within-Run Controls to Normalize Data
Within-run controls were employed to account for the effects of systematic variation in replicate measurements. Variation was identified at three levels based on the unique configuration of the 16 sample well microarray chip. The lowest level of variability was observed between the quadruplicate spots of an individual analyte measured within a single sample well. The next level of variation was described as the difference between replicate analyte val-ues measured in different wells located within the same
Table 8: Array 4: Averaged LLQs/ULQs in pg/mL obtained from 15 point standard titrations
Feature B W A W+A LLQ (pg/mL) ULQ (pg/mL)
ALCAM 0 100 0 100 991 145528
CD27 10 90 0 90 508 148468
CD30 53 47 0 47 2460 128280
CTACK 0 100 0 100 43 10691
Eot-3 37 63 0 63 130 28149
FGF-2 31 67 2 69 102 5814
FGF-4 57 43 0 43 260 14563
Follistatin 8 92 0 92 138 57120
GRO-g 12 75 13 88 59 4344
I-TAC 11 89 0 89 16 6191
ICAM-1 1 76 23 99 289 29018
IFN-g 39 60 1 61 14 7365
IFN-w 37 58 5 63 1177 42508
IGF-II 0 85 15 100 46 13538
IGF-1R 33 67 0 67 330 91601
IGFBP-1 2 72 26 98 272 85578
IGFBP-3 0 7 93 100 5530 30760
IGFBP-4 0 80 20 100 410 22880
IL-1 sR1 30 70 0 70 534 54857
IL-10rb 12 88 0 88 28 11331
IL-16 28 72 0 72 724 86874
IL-1 srII 19 81 0 81 509 76440
IL-2rb 71 29 0 29 10277 107828
LT bR 14 86 0 86 34 37957
Lymphotactin 28 72 0 72 166 9216
M-CSF R 0 91 9 100 1951 121318
MIP-3a 16 84 0 84 13 3389
MMP-10 10 90 0 90 158 42033
PDGF-Ra 30 66 5 70 8112 151722
PF4 0 23 77 100 67 5458
TGF-a 33 67 0 67 35 2678
TIMP-2 0 12 88 100 130 25224
TRAIL R1 33 67 0 67 21 10956
VAP-1 1 23 76 99 4624 150226
VE-cadherin 1 94 5 99 2652 146826
VEGF-D 34 66 0 66 1370 100539
b-NGF 27 73 0 73 141 12400
slide. The highest level of variation was associated with measurements taken from a single sample applied to multiple wells positioned across different slides within a run. Since slide-to-slide variation demonstrated the high-est system variation, a series of four controls were designed to minimize the impact on sample replicate measurements. The four controls contained all analytes for that array at four concentrations spread across the dynamic range. The four controls were run on every slide within a project and used to generate a global average of total analyte signal. Based on the global average, each individual slide was assigned an adjustment factor to compensate for the slide specific intensity bias. The analyte signal from each individual slide could then be scaled by the adjustment factor to normalize the intensity values between the sample replicates positioned across different slides. In addition, it is possible to use a blocking experimental design, intentionally positioning sample replicates across different slides and different slide tions to eliminate the potential for a slide-specific or loca-tion-specific intensity bias. An example of the latter might have been the well at the corner of a slide. Replicate meas-urements in conjunction with a mechanism to normalize
systemic variation results in the production of high qual-ity data required for maximal sensitivqual-ity in the identifica-tion of significant differences between samples in multiplexed immunoassays. An additional benefit of inclusion of standardized controls run across all slides of every project is the ability to standardize data, for example in mass units, and enable data comparisons between runs, between days and between projects. Such comparisons are necessary when projects constitute large numbers of sam-ples or when it is desired to create a relational database of assay results. Our platform described herein, for example, can perform triplicate measurements on up to 200 sam-ples in a single run.
Stringent Quality Control of Reagents and Arrays
Quality control of approximately 1200 individual rea-gents is necessary in order to provide consistent perform-ance of 170 immunoassays on the array platform described herein. These reagents, unfortunately, have widely different shelf life and storage conditions. Strin-gent quality control procedures specifying performance metrics associated with these reagents were required to achieve reproducible array performance across hundreds
Table 9: Array 5: Averaged LLQs/ULQs in pg/mL obtained from 15 point standard titrations
Feature B W A W+A LLQ (pg/mL) ULQ (pg/mL)
4-1BB 46 54 0 54 334 92233
ACE-2 37 63 0 63 1138 128330
AFP 4 96 0 96 17 11483
AgRP 18 82 0 82 72 13198
CD141 0 62 38 100 780 14852
CD40 30 70 0 70 101 19145
CNTF Ra 18 82 0 82 46 21212
CRP 4 28 68 96 201 12376
D-Dimer DD5 0 4 96 100 12070 65452
E-Selectin 0 85 15 100 89 21531
HCG 40 59 0 60 345 18736
IGFBP-6 0 2 98 100 855 38589
IL-12p40 44 56 0 56 2505 159213
IL-18 0 100 0 100 5 3743
LIF Ra 45 54 1 55 5350 117637
MIF 3 84 13 97 9753 132966
MMP-8 0 82 18 100 111 48374
NAP-2 0 19 81 100 103 9114
Neut Elast 0 66 34 100 376 24009
P-Selectin 0 82 18 100 2128 93967
PAI-II 28 72 0 72 251 115374
Prolactin 0 96 4 100 1133 77120
Protein C 0 83 17 100 1266 154054
Protein S 0 1 99 100 10808 64646
TSH 43 57 0 57 81 15614
Proteome Science 2004, 2:9 http://www.proteomesci.com/content/2/1/9
of slide lots and reagent sets. Each new lot of a given com-ponent was benchmarked to an earlier lot to verify per-formance. Analyte intensity, dose-response curve, LLD/ ULD absolute values, dynamic range and background sig-nal were evaluated in fuctiosig-nal tests performed on all assay components. Historical performance was moni-tored by comparing running averages obtained from ear-lier lots to prevent performance change over time. These procedures were made practical by assembling cocktails of reagents for each step in an assay, dispensing these in sin-gle-use aliquots, establishing optimal storage conditions and shelf life, and performing regular (typically weekly) quality checks on aliquots. Implementation of such pro-cedures required use of a laboratory information manage-ment system.
Real-Time Monitors of Platform Performance
The utility of integrating real-time platform performance monitors cannot be understated. Given the complex nature and potential instability of biological reagents associated with a multiplex antibody array, it is critical have a program in place to evaluate performance beyond
the quality control release. Real time monitors measure performance of controls under conditions identical to the test samples and reflect a second level verification of assay performance. Our test system employed a series of monitors to capture precision metrics that would create a flag to review the data if the specifications were not met. The requirements included mean coefficients of variation of assay values for controls be less than 15% and for sample replicates be less than 25% for project samples run within a batch. Failure to achieve these metrics indicated a problem related to the performance of the manufactured slides and/or reagents or a technical failure associated with sample handling or assay execution. 15-point stand-ardized titrations were also performed on 6 slides in every run in order to captured detail related to analyte dynamic range, LLQ/ULQ values, dose response behaviour, and background signal that provided a comprehensive assess-ment of real time platform performance. The detail of the performance assessment was included in final reports for each project to verify data quality and generate confidence in the data generated from a highly complex assay.
Table 10: Array 6: Averaged LLQs/ULQs in pg/mL obtained from 15 point standard titrations
Feature B W A W+A LLQ (pg/mL) ULQ (pg/mL)
6Ckine 0 100 0 100 152 27541
ACE 0 60 40 100 3283 93777
CA125 19 81 1 81 273 120834
CNTF 67 33 0 33 2562 109254
ET-3 9 83 8 91 881 25735
Endostatin 0 17 83 100 432 9966
ErbB1 1 95 4 99 3864 86553
ErbB2 12 88 0 88 2293 118586
FGF R3 (IIIb) 47 53 0 53 455 89028
FGF R3 (IIIc) 53 47 0 47 214 51823
FGF-6 42 58 0 58 220 18535
G-CSF 69 31 0 31 1487 49342
HB-EGF 41 59 0 59 47 3143
IFN-a 41 59 0 59 20 5021
LIF 52 48 0 48 655 52660
MMP-1 3 97 0 97 537 103951
MMP-2 0 99 1 100 1446 154542
OPN 0 97 3 100 496 60615
PAI-1 0 10 90 100 22 8289
PDGF Rb 14 86 0 86 645 59309
PEDF 0 19 81 100 2599 63199
TGF-b RIII 10 50 40 90 595 13518
Tie-2 43 57 0 57 6005 147662
VEGF R3 10 90 0 90 466 37150
uPA 12 88 0 88 89 16374
uPAR 11 89 0 89 1259 125972
VCAM-1 0 49 51 100 1577 150401
Evaluating the Utility of Multiplexed Immunoassays in Quantitative Proteomics
Evaluating data generated from multiplexed immu-noassays for utility in systematic identification of signifi-cant differences between samples, or "biomarker discovery", is an important step in understanding the true platform performance. One of the procedures that revealed the sensitivity of the platform for biomarker dis-covery was variance decomposition analysis for each project. Variance decomposition analysis examines the magnitude of individual components of platform varia-tion and how they compare to analyte variavaria-tion between samples or individuals. In our experience the platform error of the system described herein was generally an order of magnitude lower than the heterogeneity observed between samples or individuals of the same test group. The utility of this test is in revealing the extent to which platform error impacts the ability to discover moderate expression level differences between samples that are reflective of biological change. Platforms with lower pre-cision will have less sensitivity for detection of relevant differences between samples and will discovery only a subset of the markers that would have been identified with a more precise system.
Finally, a global performance assessment should be per-formed across multiple projects covering diverse disease areas to gain a solid understanding of the platform utility. An evaluation of this type can be used to identify assays that will not identify differences in expression between samples because they are not sufficiently sensitive, unable to generate sufficient dynamic range given the window of expression, or reveal high endogenous abundance pro-ducing assay saturation artefacts. In addition, specific assays that have appropriate sensitivity and dynamic range may be constitutively expressed and therefore poor biomarker candidate analytes for certain disease or treat-ment effect studies. This analysis may be used to direct efforts to continue to optimize the survey platform in order to generate the highest value in identifying biomar-kers using a quantitative proteomic approach.
Conclusions
Protein microarrays offer the ability to simultaneously survey multiple protein markers in an effort to develop expression profile changes across multiple protein ana-lytes for potential use in diagnosis, prognosis, and meas-urement of therapeutic efficacy. The current report details certain minimal standards, use of which was found to be necessary to generate the requisite specificity, sensitivity and reproducibility to discover biomarkers. Results revealed that a multiplex system could be operated with high analyte specificity, adequate detection sensitivity and sufficiently broad dynamic range to capture expression differences across diverse disease and therapeutic areas.
Methods
Slide Manufacture Glass inspection
Raw soda-lime glass slides (1" × 3") prepared with a Teflon mask configured to provide 16 individual sample wells and an etched barcode for traceability were sub-jected to visual inspection to identify imperfections that might translate into printing and/or scanning artifacts. Slides with scratches, surface contamination or defects in the applied Teflon mask were identified through a visual examination using a long wavelength inspection lamp equipped with a 532 nm filter. The inspection also failed slides that did not meet stringent dimensional specifica-tions, required for downstream printing and automated assay conditions.
Surface activation
Slides passing the visual inspection were silanized with 3-cyanopropyltriethoxysilane according to procedures pre-viously described [17]. Measurements of water contact angle were taken at six discrete locations across the slide surface over a 2% batch sampling to evaluate the uniform-ity of the applied surface. Since the mean value of contact angle measurements can be influenced by external factors, the deviation in measurements within a batch was also evaluated as an indicator of surface uniformity. Slide batches achieving a mean contact angle value of 52 ± 5 degrees and an average standard deviation of less than 3 degrees were considered suitable for printing.
Printing arrays
Capture antibodies prepared as previously described [11] were printed onto coated slides using a PerkinElmer Spo-tArray Enterprise piezoelectric, non-contact arrayer housed in a class 10,000 controlled access cleanroom. Quadruplicate spots of ~350pL of each capture antibody were applied to each of the 16 wells within a slide gener-ating 256 printed elements per well, 4096 spots per slide and 108 slides per print batch.
Controls Printed features
Proteome Science 2004, 2:9 http://www.proteomesci.com/content/2/1/9
acted as a monitor for spot contamination resulting from carry-over between sequentially printed features.
15-point standard titration calibrators
Preparations of standardized multiplex analyte titration series were manufactured using recombinant analytes diluted in buffer that covered the range from 12 pg/mL up to 81 ng/mL at 14 discrete points along with two zero ana-lyte buffer blanks. These titration points were distributed among the sixteen available wells on a slide (Figure 1). The standard titrations, designed to overlap the linear range of detection for each individual analyte, were used to generate standard curves from which sample analyte concentrations were determined. The standardized titra-tions were utilized in both the quality control testing per-formed on each print lot prior to release, as well as within each client project to verify real-time analyte performance. Six replicates for each point were run in the quality con-trol testing of each slide lot and three replicates of each point were run within each client study to generate stand-ard curves.
Anchor point calibrators
The three replicates tested for each study sample were positioned across different slides to avoid slide specific signal bias. Four of the fifteen standard titration points identified as "anchor" points were run across four wells of each sample slide to allow for data normalization of the replicates. The four specific points selected for each array were intended to capture the linear range of detection across the dose response curves for the individual panels of analytes. The remaining 12 wells of the slide were reserved for study samples.
Slide Qualification Microscopic Examination
Microscopic inspection of printed spots was performed on a 10% sampling of slides within each print batch. Slide selection was biased to interrogate slides located at critical positions on the arrayer deck, reflecting the beginning, middle and end of the print run. Printed slides were exam-ined under a light microscope to evaluate spot position-ing, morphology and print grid alignment within each well. Print lots demonstrating features with poor spot morphology, missing spots or misaligned features were not released for use.
Positional confirmation
Slides were subject to a full assay function test to confirm the proper location of the printed capture antibodies. Each printed slide lot was tested to confirm the position of the individual feature by spiking in purified analytes in groups of 1–3 per well at a fixed analyte concentration, and performing the full RCA assay to confirm signal at the appropriate printed location. Slide lots revealing signals
in inappropriate locations, printing defects or missing sig-nals failed the positional QC test and were not released for use.
Performance assessment
Functional testing was performed on a 10% sampling of each slide lot to evaluate the performance of each analyte. Replicates of the 15-point standardized cytokine titration series, were run to evaluate analyte dose-response, average fluorescent signal intensity, replicate spot variability, rep-licate sample correlations and LLQ/ULQ values to estab-lish functionality of individual features as well as overall array performance for each slide lot produced. Values obtained for the various metrics were compared to histor-ical averages to identify deviations in performance for the individual analytes. Slide lots were failed if analyte dose-response curves produced sample correlations with R2
val-ues less than 0.90, if average replicate spot-to-spot CVs were >15%, or if RCA signal amplification as measured by the biotinylated mouse IgG calibration standards fell below predefined MFI cutoffs.
Assay
Assay Automation
The manual RCA microarray immunoassay reported pre-viously was modified to optimize performance on an automated platform (Protedyne BioCube). Manual immersion washes were substituted with pipette delivered solutions finely tuned to control pipette tip aspiration and delivery position above printed slide wells and to carefully control liquid application and aspiration speeds to minimize disruption to the assembled immunosandwich complex. Incubation times were increased from 30 to 45 minutes for two of the assay steps (RCA signal amplification and detector incubation) and the number and volume of washes between steps increased from 2 to 4–5 and from 20 uL to 30 uL respectively. A Tecan LS200 unit was used to scan the slides. Microarray images were quantified using image capture software (ImageGrabber) developed in-house.
Clinical Samples
Sample procurement/processing
Frozen serum samples from over 800 clinical patients were thawed, centrifuged to remove particulate matter and mixed with 0.25 mg/ml Heteroblock (Omega), 0.25 mg/ml IIR (Bioreclamation) and 0.1% Tween-20 prior to the assay. Twenty microliters of serum was applied to each well.
Data processing Outlier removal
combination of automated and manual methods. MvA plots, were generated by plotting the difference of the log intensities (M=log2(Rep1/Rep2) versus the average of the log intensities (A=log2((Rep1*Rep2))/2) for each of the replicates across all analytes. Patterns were visualized using fitted curves from robust local regression with applied visual cues to identify a 99% confidence interval. All outliers in the MvA plot outside of the interval (having a p-value < 0.01) were automatically removed from anal-ysis. The MvA scatter plots also allowed the user to high-light subsets of points on the plot and investigate patterns of intensity differences observed between replicate values. In cases where redaction of an entire replicate (comprised of 4 individual spots) was too stringent, individual spots could be removed using an in-house developed software tool (Terminator) to visually inspect aberrant data points. Data redaction using this method was performed on a limited basis to remove individual spot outliers with poor circularity, non-uniform pixel intensity or missing spots.
Sample replicate correlation QC
As a quantitative QC measure, data review included a sample replicate correlation assessment with a predefined correlation coefficient (R2) value cutoff. An ideal
microar-ray, when compared to its identical replicate, would have a R2 value of 1. Any comparison producing values lower
than the cutoff would result in at least one failed replicate. Individual sample correlations were generated by plotting analyte MFI values (on a Log2 scale) from each replicate against the other replicates individually covering all com-binations of replicates over the 25–37 analytes within the array. The R2 values obtained for the three plots were
man-ually reviewed to identify failed sample replicates. Only sample replicates with R2 values >0.95 for replicates run
within a day or R2 values >0.90 for replicates run across
multiple days passed the correlation QC. A summary of the overall sample replicate pass rate monitored the number of failed replicates observed across each of the individual arrays. Project performance specifications required that >85% of all study samples had at least 2 reported replicates.
Data Normalization
Individual sample values were normalized using linear regression of the anchor points run across 4 wells of each sample slide to reduce assay imprecision observed among replicates. A four-point standard titration was run on every slide for normalization and quality control pur-poses. Fluorescence intensities of the four spot replicates for each analyte within a well were averaged on a logarith-mic (base two) scale to generate within-slide titration curves. Linear regression coefficients (slope and intercept) were calculated between individual titration curves from each slide to generate an "average" titration curve. Calcu-lated slope and intercept were used to transform averaged
analyte values for each sample well. Data normalization was performed on the data set after outlier removal.
Precision assessment
A standardized precision assessment was performed on each run to monitor assay performance with respect to; within well variation (based on mean coefficient of varia-tion (CV) observed between quadruplicate printed spots for all features across all sample wells of a project) and between-slide variation (reflecting the average CV observed between all sample replicates across all samples in a study). The mean and median CVs with standard deviations were also metrics included in the precision assessment. The precision assessment was performed as a quality control using the 15-point titration calibrators to qualify new slide lots and generate quality metrics for each client project.
LLQ/ULQ determinations
Mean fluorescent intensity (MFI) values, on a logarithmic scale, from the 3 replicate measurements of the 15 point standard titration series were used to generate precision profiles to define the upper and lower limit of quantita-tion (ULQ, LLQ) within a predefined concentraquantita-tion CV [18]. To do this, a dose-response curve was fitted to the 15-point calibrators using 4-paramter logistic curve fitting procedures. The MFI standard deviation (SD) of the tripli-cate measurements was converted to concentration SD for the 15 concentration units by dividing by the slope of the dose-response at each concentration point. The conver-sion provides the relative SD or %CV as a function of analyte concentration to define the precision of the assay for each analyte throughout the working range.
Variance decomposition analysis
The VARCOMP procedure of SAS (SAS Institute), was used to obtain estimates of the variance components in a mixed model. The fixed effect variable represents variance observed in different groups in the study, for example groups of healthy versus diseased individuals. Random effects were represented by unique sample identifiers nested within levels of a fixed variable. This component of variance represented within-group differences associated with patient-to-patient variability or disease heterogene-ity. The residual variance represented the platform error.
New Array Validation Establishing analyte sensitivity
Proteome Science 2004, 2:9 http://www.proteomesci.com/content/2/1/9
antibodies that revealed binding to non-cognate antigens were removed or replaced with suitable alternatives. Ana-lytes that demonstrated low signal across all matrices were removed. If signals were low in buffer, a comparison was made with signals obtained in serum or plasma to deter-mine if the endogenous analyte level was detectable and determine if depressed signals were due to analyte instability in a non-biological matrix. Assessment of ana-lyte endogenous level was performed using a "0 × n" for-mat where unadulterated serum and plasma (heparin, citrate, EDTA) are assayed with the full complement of detector antibodies for a given array.
Evaluating cross reaction
Two conditions were examined to study potential cross-reactivity between the complex detector antibody mixture and the immobilized capture analyte. The first condition included a 1 × (n-1) format in which 1 analyte was tested in the presence of all detectors minus the detector anti-body specific to the added analyte (n-1). In the case of an array containing 40 printed features, 40 unique detector antibody cocktails are prepared containing 39 of the detector antibodies found in the complex mix, with each mix containing all but one of the 40 corresponding detec-tors. The 40 individual reaction mixes are added to spe-cific arrays after the arrays were incubated with the antigen corresponding to the missing detector. The second condi-tion represented the 0 × (n-1) format where no analyte was added in the presence of all detectors minus the detec-tor specific to the analyte under examination. In each case the analytes were spiked in buffer, serum, and plasma (heparin, citrate, EDTA) at a fixed analyte concentration of 50 ng/ml.
Stress testing
Single analyte titrations were prepared in buffer, serum and plasma (heparin, citrate, EDTA) to assign a minimum detection limit (MDL) for each analyte based on a 95% confidence interval above background. The format of the experiments included an n × n design, where all analytes were run in the presence of all detectors. Then, using a 1 × n format, where only one antigen was added to an assay containing all detectors (n), each analyte was tested at 0X, 10X, 50X, and 100X MDL across the same test matrices to identify non-cognate cross-reaction under high analyte load. Additional antigen titration experiments were run to compare the performance achieved in the presence of a single antigen (1 × n) to one in which all analytes were present (n × n).
List of Abbreviations
MFI: Mean Fluorescence Intensity.
RCA: Rolling Circle Amplification.
CV: Coefficient of Variation
R2: correlation coefficient
LLQ: lower limit of quantitation
ULQ: upper limit of quantitation
MDL: minimal detection limits
SD: standard deviation
Competing interests
L.T. Perlee, J. Christiansen, B. Grimwade, S. Lejnine, V. Tchernev and M. Sorette were employees of Molecular Staging, Inc. and D.D. Patel and S.F. Kingsmore have received consulting fees.
Authors' contributions
RD oversaw the manufacturing of reagents, JC established standardized quality control testing procedures, MS implemented assay automation and oversaw all clinical testing. BG was responsible for data curation, SL per-formed statistical analysis. MM and WS contributed to array develoment. SFK, VTT and DDP were involved in study design, LTP in project execution and LTP, SL, JC and SFK in manuscript preparation.
Acknowledgements
We would like to thank David Ward and Peter Fuller for continued support and long standing scientific contribution to Molecular Staging.
References
1. Kingsmore SF, Patel DD: Multiplexed protein profiling on anti-body-based microarrays by rolling circle amplification.Curr Opin Biotechnol 2003, 14:74-81.
2. Kingsmore SF, Schweitzer B: Measuring proteins on microarrays.Curr Opin Biotechnol 2002, 13:14-19.
3. Nielsen UB, Geierstanger BH: Multiplexed sandwich assays in microarray format.J Immunol Methods 2004, 290:107-20. 4. Haab BB: Methods and applications of antibody microarrays in
cancer research.Proteomics 2003, 3:2116-22.
5. Saviranta P, Okon R, Brinker A, Warashina M, Eppinger J, Geierstan-ger BH: Evaluating sandwich immunoassays in microarray format in terms of the ambient analyte regime.Clin Chem
2004, 50:1907-20.
6. Wu P, Grainger DW: Toward immobilized antibody microar-ray optimization: print buffer and storage condition compar-isons on performance.Biomed Sci Instrum 2004, 40:243-8. 7. Wacker R, Schroder H, Niemeyer CM: Performance of antibody
microarrays fabricated by either DNA-directed immobiliza-tion, direct spotting, or streptavidin-biotin attachment: a comparative study.Anal Biochem 2004, 330:281-7.
8. Schweitzer B, Wiltshire S, Lambert J, O'Malley S, Kukanskis K, Zhu Z, Kingsmore SF, Lizardi PM, Ward DC: Immunoassays with rolling circle DNA amplification: a versatile platform for ultrasensi-tive antigen detection. Proc Natl Acad Sci USA 2000,
97:10113-10119.
9. Wiltshire S, O'Malley S, Lambert J, Kukanskis K, Edgar D, Kingsmore SF, Schweitzer B: Detection of multiple allergen-specific IgEs on microarrays by immunoassay with rolling circle amplification.Clin Chem 2000, 46:1990-3.